- Overview
- Read Me First
- Planning
- Daily Operating Procedures
- Deployment Topology Recommendation:
- Query Performance Configuration
- Expanding ECA cluster Size for performance
- Reduce the Load on PowerScale Cluster by Disabling Audit Events
- Audit Use cases
- How to Configure What PowerScale will audit
- How To Enable User logon and logoff support for the built in Logon monitor Compliance Report
- How to get list a of audit configuration options
- Verify the settings with list command
- How to Configure and Operate Easy Auditor
- Report Query Builder
- How Queries are Executed
- How to search for Audit Events
- Built In Reports
- Stale User Access Report
- Access User Report
- Login Monitor Report (compliance)
- Employee Exit Report
- Count
- Saved Queries Tab
- How to load a saved search
- How to delete a saved search
- How to Load a Query and Search
- How to Load and Schedule a Query
- How to delete a saved Query
- How to delete run a Query as a report
- Running Reports Tab
- Running Reports Monitoring
- How to Cancel a running report
- Best Practice:
- How to Monitor Progress of a Running Search
- Finished Reports
- Filter Reports tab
- Report Schedule Tab
- How to delete a saved Scheduled Query
- How to load a Query and set a Schedule
- How to edit a saved Scheduled Query
- Active Auditor Tab
- Active Auditing Tab Overview
- Overview
- How to Configure Custom Real-time Audit Policies
- Overview:
- How to Manage customer Real-time Audit policies
- How to Configure real time audit policies
- How the UI elements work for real-time audit policy rules
- UI Examples
- Multiple individual rules using OR between rules
- Multiple individual rules using AND between rules
- A group of rules using AND between rules
- A group of rules using OR between rules
- A group plus comparison to an individual rule using AND between the group rules and an AND between the group and single rule
- Auditor Active Trigger Use Case Examples
- Directory Rename Realtime detection
- Directory or File ACL change Realtime Detection
- Login Realtime Detection
- HoneyPot Detection
- How to configure Mass Delete protection
- Overview:
- How to configure Data Loss Prevention
- Overview:
- How to manage Active Auditor Events
- Actions available to Manage Active Auditor Events
- How to Archive an active auditor event
- How to Display active auditor historical events
- WireTap
- How to Configure Wiretap
- Where Did My Folder go? Tab
- Overview
- Limitations
- Use Case
- How to Use Where did my folder go?
- Overview
- RoboAudit
- How Use RobotAudit
- How to Monitor RobotAudit jobs
- How to verify RobotAudit test Results
- Auditor Role Based Access
- How to view debug logs for Searches
Overview
The Easy Auditor solution for PowerScale requires existing Eyeglass DR cluster licenses for each PowerScale cluster plus an Eyeglass clustered agent license.
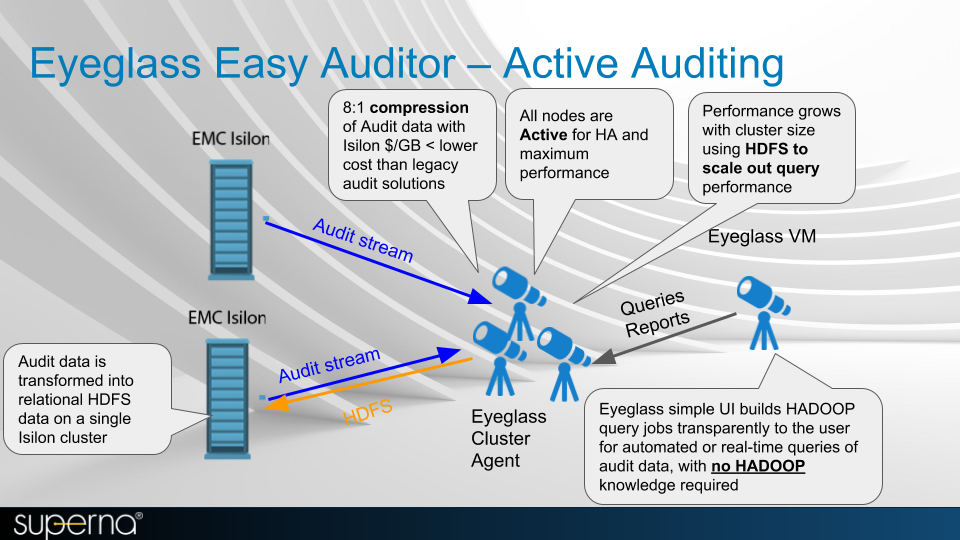
The Eyeglass Easy Auditor solution allows customers to set policies for both real-time policies and scheduled searches to alert on file actions. Static reports can also be scheduled for more complex longer running analytics.
Read Me First
- Complexity of auditing a multi protocol file system requires understanding of NFS and SMB.
- NFS - is a case sensitive protocol that means remove mounts and operations will generate case sensitive file and directory audit events. These audit events are sent to Easy Auditor to process with the case preserved. This means locating data based on the path and file name case will be honored as expected.
- SMB - Is not a case sensitive protocol. NTFS view of file systems will honor case in the display of Explorer but operations over SMB can open, delete files using the wrong case and the action will still succeed. This also means the case of the file operation sent to Isilon will be sent to the audit records and can result in a mismatch between the actual file system case and the audit event recorded. This is how Isilon works when creating audit events. Reach this technical advisory of how mounting shares with a subdirectory mount can generate audit data that does not match the actual file system. Tech note.
- If a user renames a path below an SMB share mount audit data saved in the database will still have the old path case in the database. This means searching for audit data within Easy Auditor will attempt to search the current file system path as entered into the GUI but will not find any records since the database stores the previous case path.
- Work Around: Always begin a search at the base path of the SMB share. This will ensure that all records will be located, even if users change the path on folders and files under the SMB share path.
Planning
Several decisions are required to configure auditing for 1 or more clusters with a single ECA cluster.
- Number of clusters to assign to a single ECA cluster
- Number of audit events per second (number of active smb or NFS connections is used to size event rate)
- WAN link speed to send audit events over the wan to a centralized ECA cluster. See mini ECA architecture option for distributed auditing.
- Query performance
Daily Operating Procedures
- It is expected that alarms are monitored daily and acted upon. Some alarms indicate network connection issues to managed clusters. The impact of not monitoring alarms is missed audit data ingestion. This is daily task.
- If audit data is present in the database as a result of network issues in your environment, re-ingestion will be required. See guide here. NOTE: This is a slow background process to ingest old audit data stored on the cluster.
- Robo Audit feature should always be configured and monitored to verify normal audit data ingestion, and storage in the database. This feature also tests searching on a daily basis.
Deployment Topology Recommendation:
- Centralize the ECA cluster when possible and use the WAN link to send audit events. Audit data is XML over NFS and tolerates latency well. See the installation guide for bandwidth guidelines.
Query Performance Configuration
Two key factors of the Auditor Analytics database is write performance to PowerScale over HDFS for storing audit event streams and read performance for queries. Additional advanced configuration can be completed after contacting support.
To expand a cluster from 6, 9 or 12 VM's follow the steps below.
| Event Rate Total per ECA Cluster | Number of ECA VM’s | Comments |
|---|---|---|
| 10000 or greater events per second (run this command isi statistics query current --nodes=all --stats=node.disk.xfers.rate.sum) and send results support | 6 to 9 to 12 ECA VM cluster | Nodes 2-12 only run containers for read and writing data and analysis. These VM’s can have memory lowered, contact support for assistance. |
Expanding ECA cluster Size for performance
See Install guide expanding cluster size to increase to 6 or 9 or 12 nodes. Increasing cluster size will increase event rate processing and analysis job report speed.
Reduce the Load on PowerScale Cluster by Disabling Audit Events
PowerScale can disable some event types to reduce audit work load.
- New in 8.2 release each audit event can be enabled or disabled. Use this command isi audit settings modify --help. Open a case with support to get a recommendation of which events can be disabled.
- --audit-success (close | close_directory | close_file | close_file_modified | close_file_unmodified | create | create_directory | create_file | delete |delete_directory | delete_file | get_security | get_security_directory | get_security_file | logoff | logon | open | open_directory | open_file |open_file_noaccess | open_file_read | open_file_write | read | read_file | rename | rename_directory | rename_file | set_security | set_security_directory |set_security_file | tree_connect | write | write_file | all) | --clear-audit-success | --add-audit-success (close | close_directory | close_file |close_file_modified | close_file_unmodified | create | create_directory | create_file | delete | delete_directory | delete_file | get_security |get_security_directory | get_security_file | logoff | logon | open | open_directory | open_file | open_file_noaccess | open_file_read | open_file_write | read| read_file | rename | rename_directory | rename_file | set_security | set_security_directory | set_security_file | tree_connect | write | write_file | all) |--remove-audit-success (close | close_directory | close_file | close_file_modified | close_file_unmodified | create | create_directory | create_file | delete |delete_directory | delete_file | get_security | get_security_directory | get_security_file | logoff | logon | open | open_directory | open_file |open_file_noaccess | open_file_read | open_file_write | read | read_file | rename | rename_directory | rename_file | set_security | set_security_directory |set_security_file | tree_connect | write | write_file | all)]
- In previous OneFS releases there is less control over events that are enabled or disabled
- isi audit settings modify --help
- --add-audit-success (close | create | delete | get_security | logoff | logon | read | rename | set_security | tree_connect | write | all) |
- Open a support case to get recommendations on events to disable.
Audit Use cases
The following use cases can be addressed by Easy Auditor
- Find file deletes in the file system using searches
- Configure a scheduled query to find deletes or other file actions and get alerts real-time
- Quickly find renamed directories using “Where did my folder go?” And revert the files to the previous location
- Monitor secure shares for users copying data from the share
- Report on user activity for compliance with HIPPA , PCI
- Identify the top users for creates and deletes
- Performance monitoring paths in the file system to profile application workflows or users
- Track user activity for security audits
- Find insider threats with advanced search
- Store long-term audit data for compliance reporting
- Identify excessive permissions to data to assist with removing access to users that do not require access
How to Configure What PowerScale will audit
These ISI commands should be used to validate and change what events PowerScale will audit per access zone.
List audit settings on an access zone
isi audit settings view --zone=data (data is the zone name)
Default should look like this example
Audit Failure: create, delete, rename, set_security, close
Audit Success: create, delete, rename, set_security, close
How To Enable User logon and logoff support for the built in Logon monitor Compliance Report
Run these commands per access zone (example zone name below is data) to enable logon and logoff auditing
isi audit settings modify --zone=data --audit-success=logon,logoff,create,delete,rename,set_security,close
isi audit settings modify --zone=data --audit-failure=logon,logoff,create,delete,rename,set_security,close
How to get list a of audit configuration options
isi audit settings modify --zone=data --help (zone name data is example only)
Verify the settings with list command
Audit Failure: close, create, delete, logoff, logon, rename, set_security
Audit Success: close, create, delete, logoff, logon, rename, set_security
How to Configure and Operate Easy Auditor
Use this section on how the configure and use Easy Auditor to search audit data.
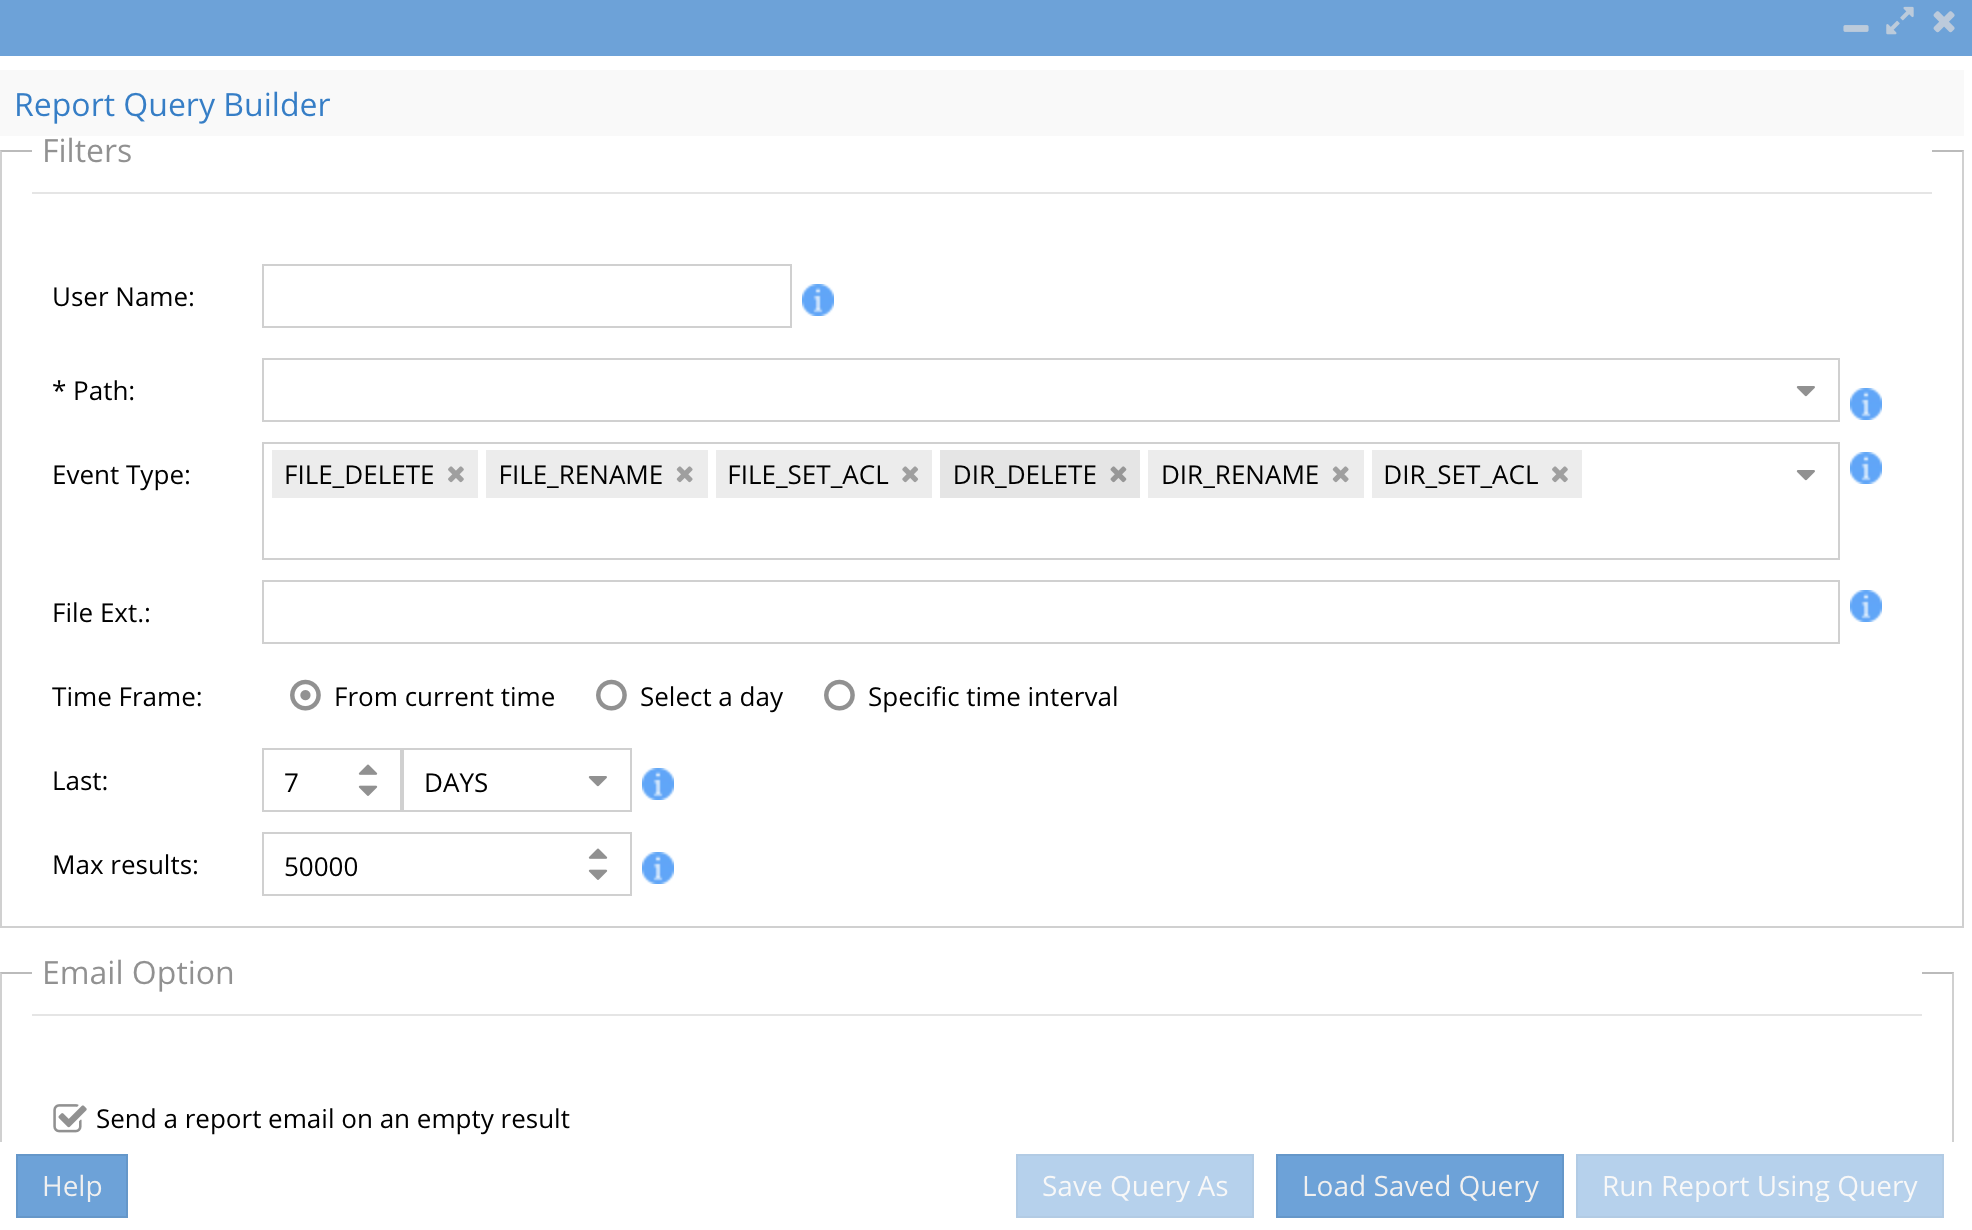
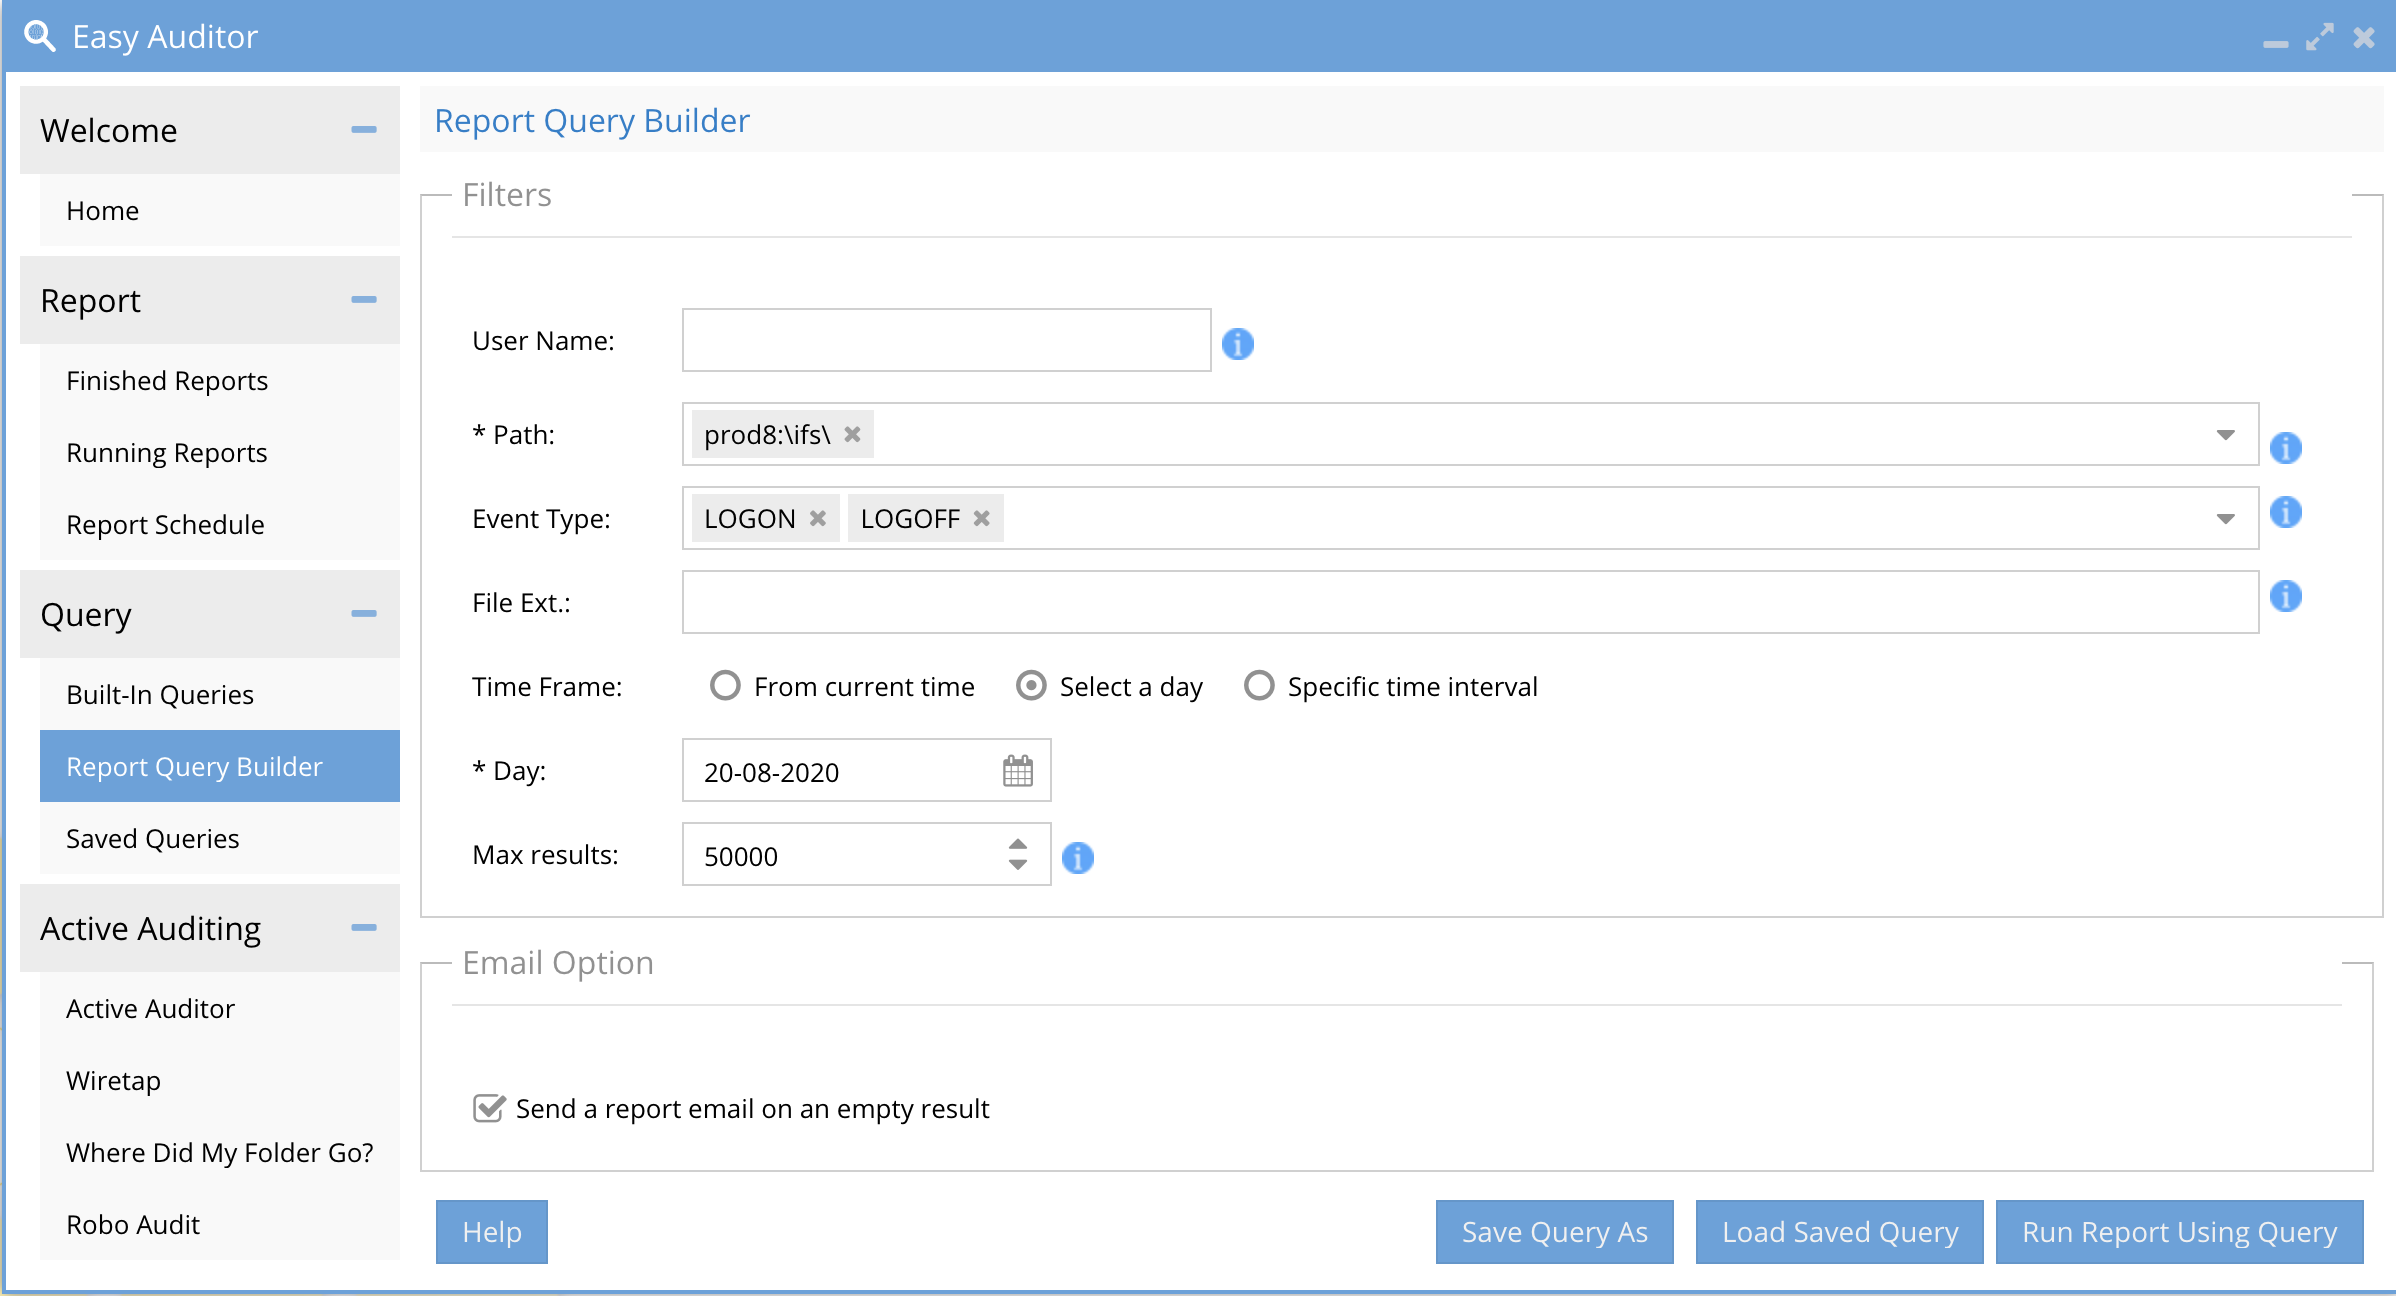
Report Query Builder
Use this tab to search by user(s), path(s) , file extension ,file action and date range.
How Queries are Executed
How to search for Audit Events
- The search event types defaults to the most common searches, click the drop down to see all available event types. Reducing the scope of the event types will speed up search times.
- Search by entering data into the GUI fields
- Blank for the user field means any user. to Search for specific user enter user@domain or domain\user (domain must be upper case). NOTE: This will resolve an active directory user to a SID and will support Windows SMB protocol user auditing.
- The path field must be entered to select a cluster and path to audit. To speed up search times select a path as close to the audit events you are interested in finding. example don't enter /ifs this will increase search times.
- Extension field will match files with a specific extension to limit to file types of interest and this can reduce search times by ignore file types you do not need results. Enter only the extension example docx or xlsx or pdf (NOTE: do not enter the period)
- Time Range:
- Enter days in the past
- a specific day
- or custom date and time range
- NOTE: searching over a shorter time window will decrease search times. Always narrow the time window on a search and use multiple searches if the first search does not provide the audit data you are looking for.
- Max results default is 50 000 records, the search will finish once the max results has been crossed. The best Practice is to narrow the search criteria to avoid returning too much data in a search. The maximum results supported is 1 Million events; this will generate a very large CSV and take more time to complete the search.
- If you know the name of the file, then follow GIF instructions to enter the file name to the search path NOTE: file name search is case sensitive.
- NOTE: Email option if enabled will send an email even if the query returns no data. Disable this check box to skip sending an email if no data is returned. This option is best used for scheduled queries.
- Use the save option to save the query to saved query tab to reload at a later date.
- Use the Run Report as Query
- Execute a search with the search button
- Sort
- Use Sort to return the results in the preview screen according to these settings
- NOTE: Search supports up to 1,000,000 records. Saved queries can be run as a report to return more data as csv download files.
- NOTE: All Searches use Continuous mode that will update the CSV on report tab each time 50 000 records are found. This allows results to be viewed during the execution of search for faster preview or results review. The CSV can be repeatedly downloaded during a long search as required. If the results are found, the search can be canceled from the running reports tab.
Built In Reports
Stale User Access Report
This report will be used to build a list of users that have accessed data using SMB shares and calculate the last read or write of each share they have access to mount based on AD group membership. This report will list all users that can mount shares and whether they have accessed data during the reporting time period.
Recommendation: Use this report to determine which users may not require access to SMB shares based on access patterns. This is a security report that can be shared with departments that manage SMB share access.

|
NOTE: This is a long-running report that can take hours to complete on a large database. Large user count Active Directory domains can also cause the report to run longer to analyze data access. |
Report Parameters
- SMB share
- Time period to analyze
Access User Report
This report will be used to build a list of users and SMB shares and map out user to share access to determine excessive permissions or validate existing share access that may not be in line with the desired security policies. The report generates a list of shares and a list of active directory users and groups that have access SMB share. The AD groups can be expanded to a list of users for NAS administrators that do not have access to Active Directory.
Recommendation: Use this report to determine which users may not require access to SMB shares based AD group membership.. This is a security report that can be shared with departments that manage SMB share access.
|
|
NOTE: Large user count Active Directory domains can also cause the report to run longer to analyses data access. |
Report Parameters
- SMB Share
Login Monitor Report (compliance)
This report satisfies HIPAA and PCI Requirements to track login to systems storing compliance data. NOTE: This built in report has moved to the Query builder interface as of release 2.5.6 patch release. This simplifies searching and speeds up the reporting process.
- Prerequisites
- NOTE: logon and logoff events are disable on PowerScale by default follow these steps to enable. Replace the zone name for the zone you want to audit
- isi audit settings modify --add-audit-success logon --zone System
- isi audit settings modify --add-audit-success logoff --zone System
- isi audit settings modify --add-audit-failure logoff --zone System
- isi audit settings modify --add-audit-failure logon --zone System
- isi audit settings modify --add-audit-success logon --zone System
- NOTE: logon and logoff events are disable on PowerScale by default follow these steps to enable. Replace the zone name for the zone you want to audit
- How to run a Logon Report
- Open the Query build tab and enter a search based on the screen shot below. This will retrieve all the logon and logoff events for a day. The path field can be left at /ifs as it is not used in the search. Select a day or a time range as required for your search. NOTE: Searching over more days will take longer to complete the search.
- Sample report in the Finished reports tab
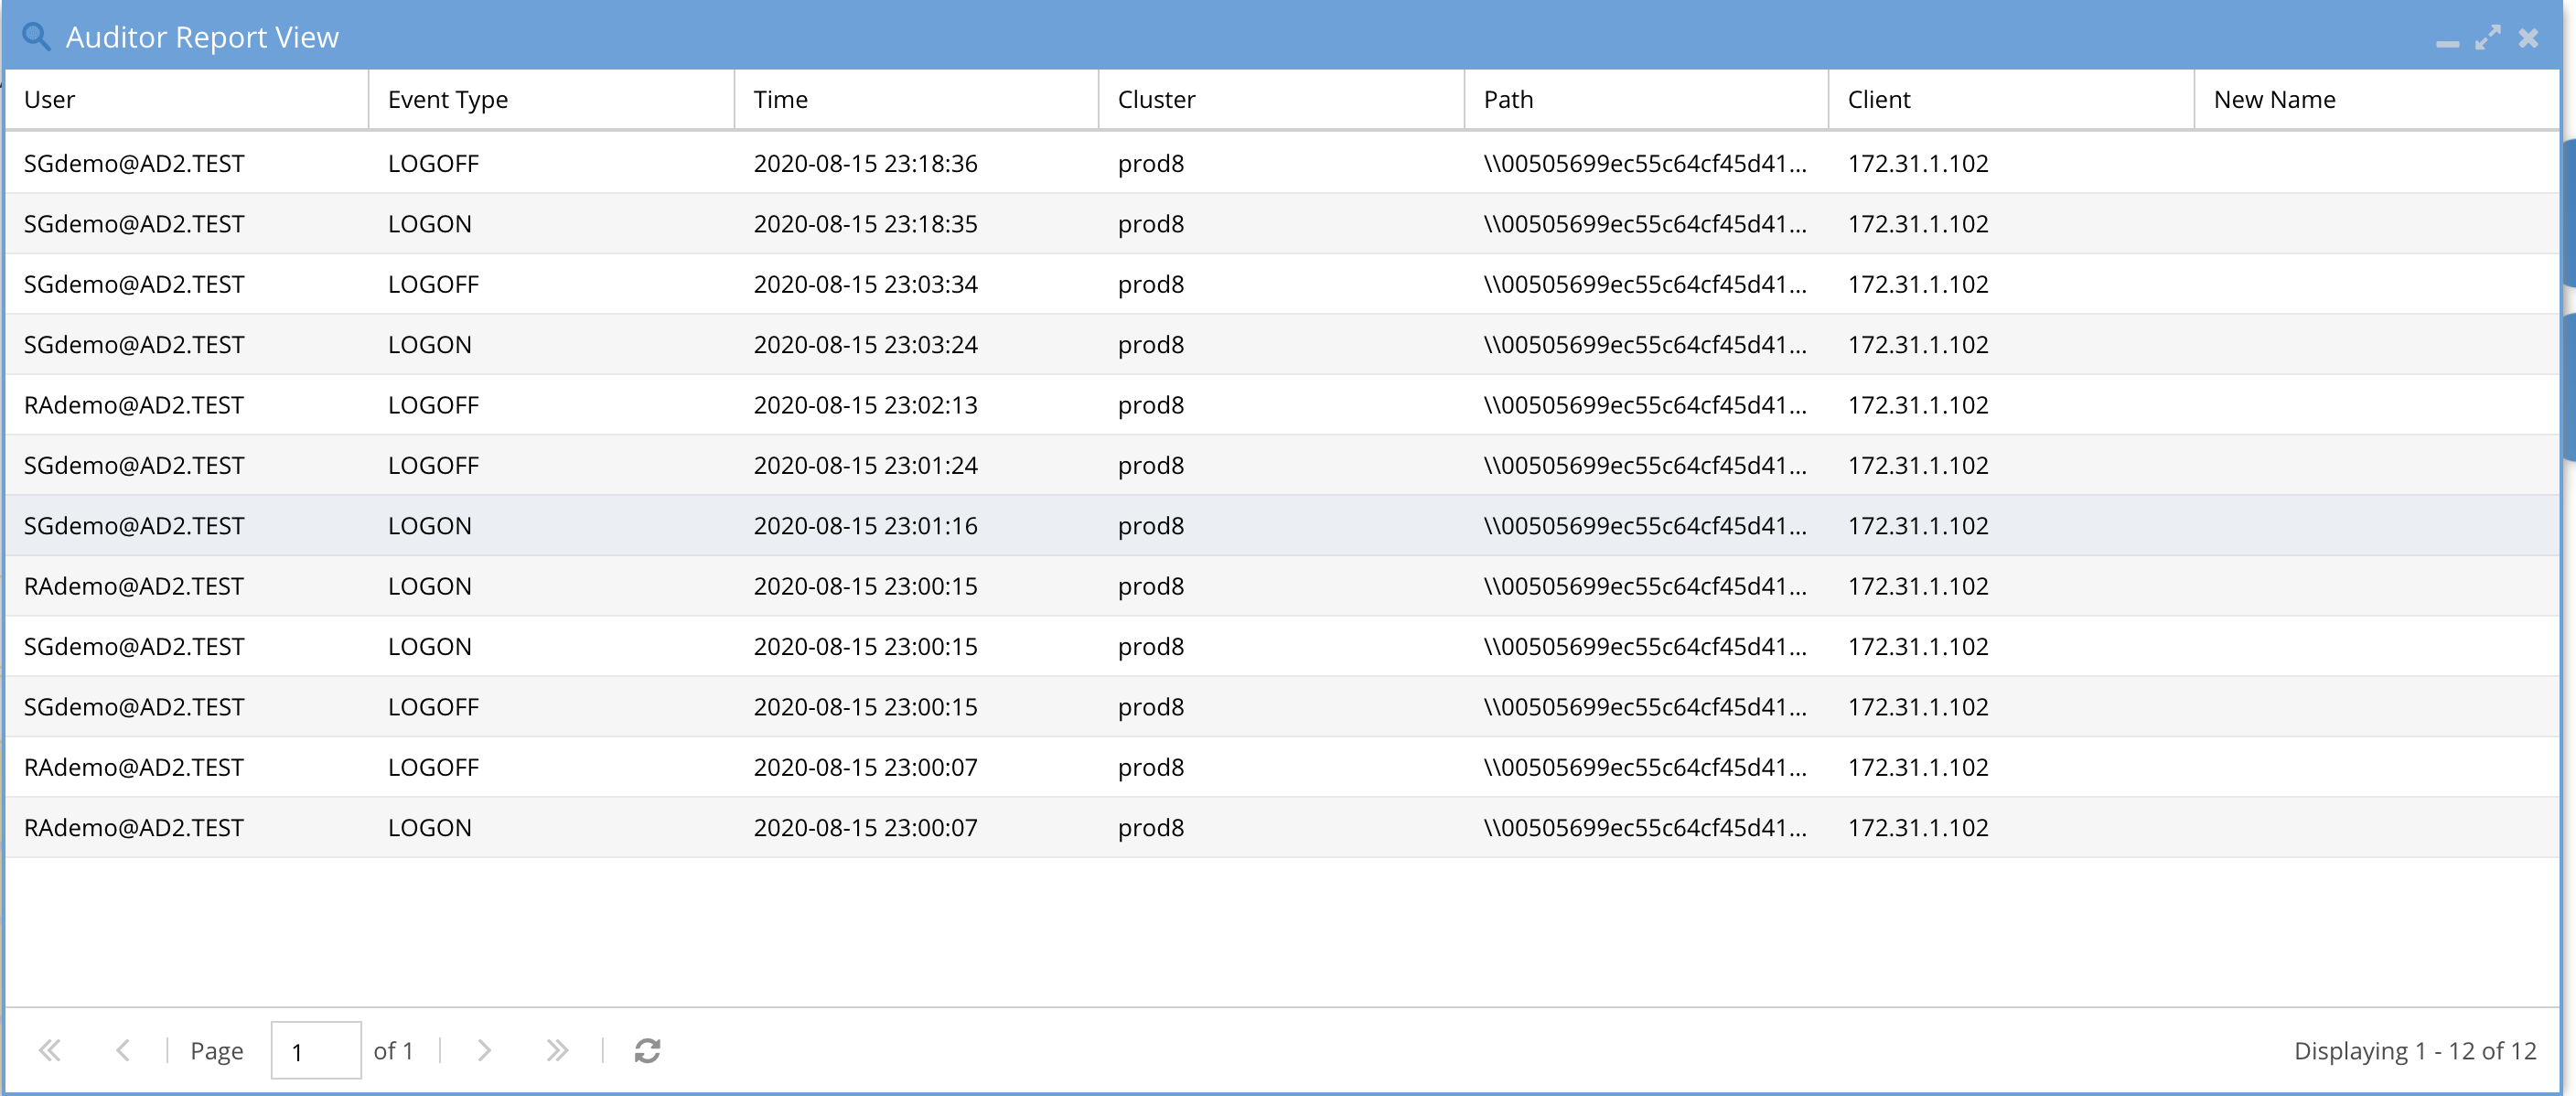
- Open the Query build tab and enter a search based on the screen shot below. This will retrieve all the logon and logoff events for a day. The path field can be left at /ifs as it is not used in the search. Select a day or a time range as required for your search. NOTE: Searching over more days will take longer to complete the search.
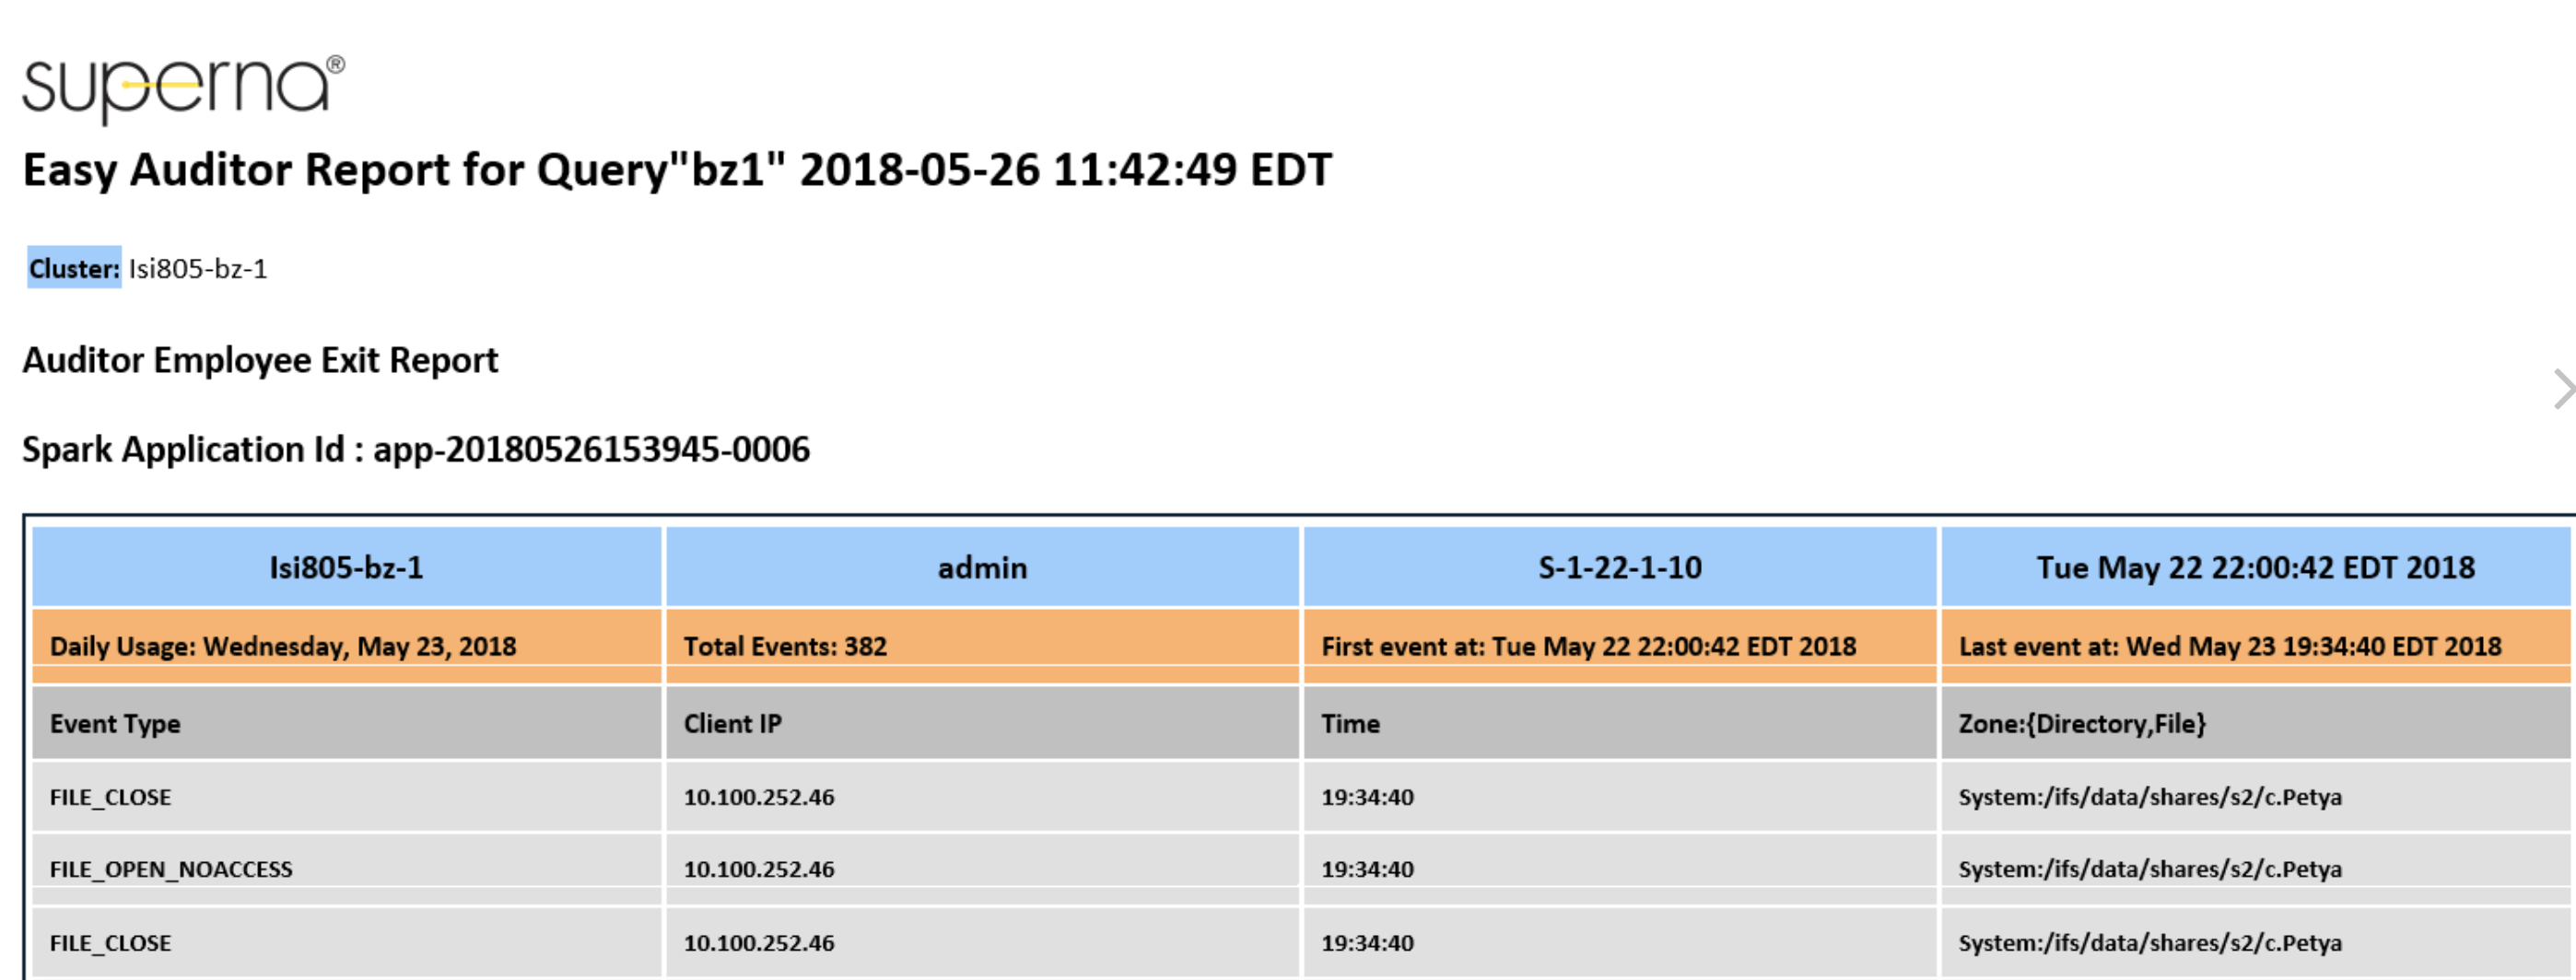
Employee Exit Report
This report would be run prior to an employee leaving your company and provides a view of all files the user accessed in any way over the last 30 days. This is typically done as part of an HR process. The report will show user activity by day over the last 30 days.
- Select the employee exit report
-
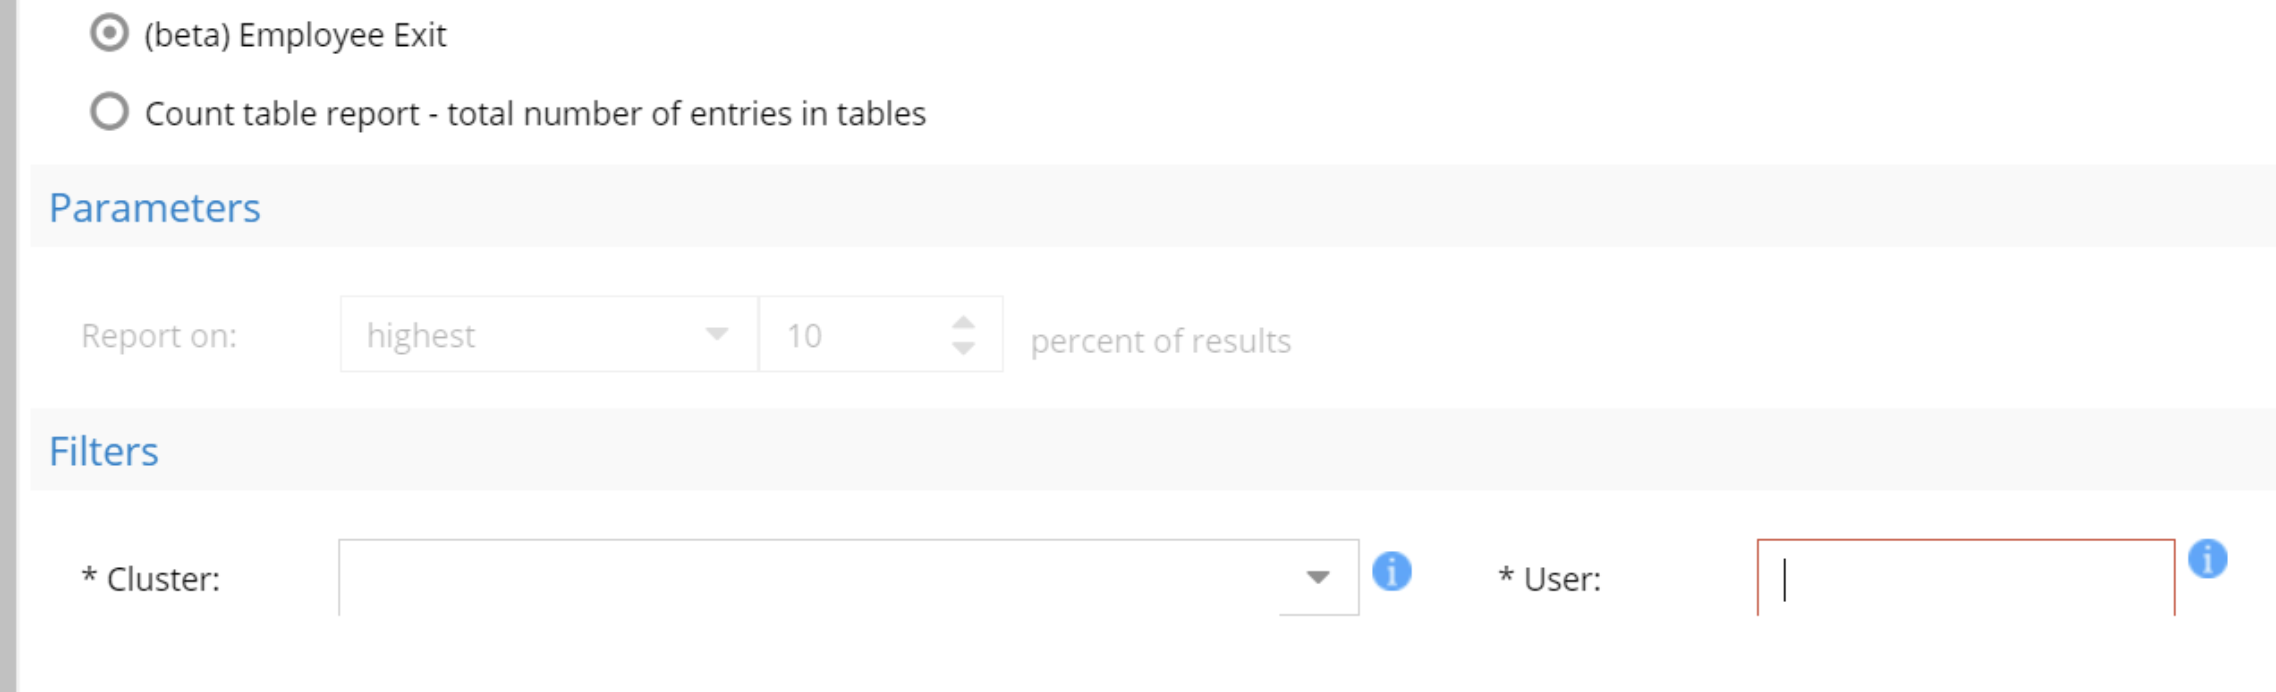
- Enter the userid user@domainname or domain\userid
- if the user SID cannot be resolved an error will be returned.
- Select the cluster
- Save and name the report
- Execute the report
- View results on the report tab
- Download CSV to send to HR
- Example email report
-
Count
This report will be recommended to run by support to count the rows in each system table in the analytics database. On a large database this job can take a very long time to complete. We recommend using DB size procedure in this guide.
|
|
NOTE: This report can run for hours on a large database and generate IO to the cluster. Run in off peak hours example overnight or weekends. |
Report Parameters
- None
Saved Queries Tab

How to load a saved search
- Use the saved query tab and select a query and click load query
- Execute the search with search button
How to delete a saved search
- Select one or more saved queries with a check box
- Click delete
How to Load a Query and Search
- Select checkbox of the query
- Click Load Query
- Then click search from the search UI
How to Load and Schedule a Query
- Select the checkbox of the query
- Click the Load Scheduled Query
- On Schedule tab set the interval the query should run and other schedule settings
How to delete a saved Query
- Select the checkbox of the query
- Click the Delete Query
How to delete run a Query as a report
Use this option to return all rows and generate a CSV of the results versus preview
- Select the checkbox of the query
- Click Run Report
- Then go to the running reports tab to monitor completion
- Results are available on the Report history tab
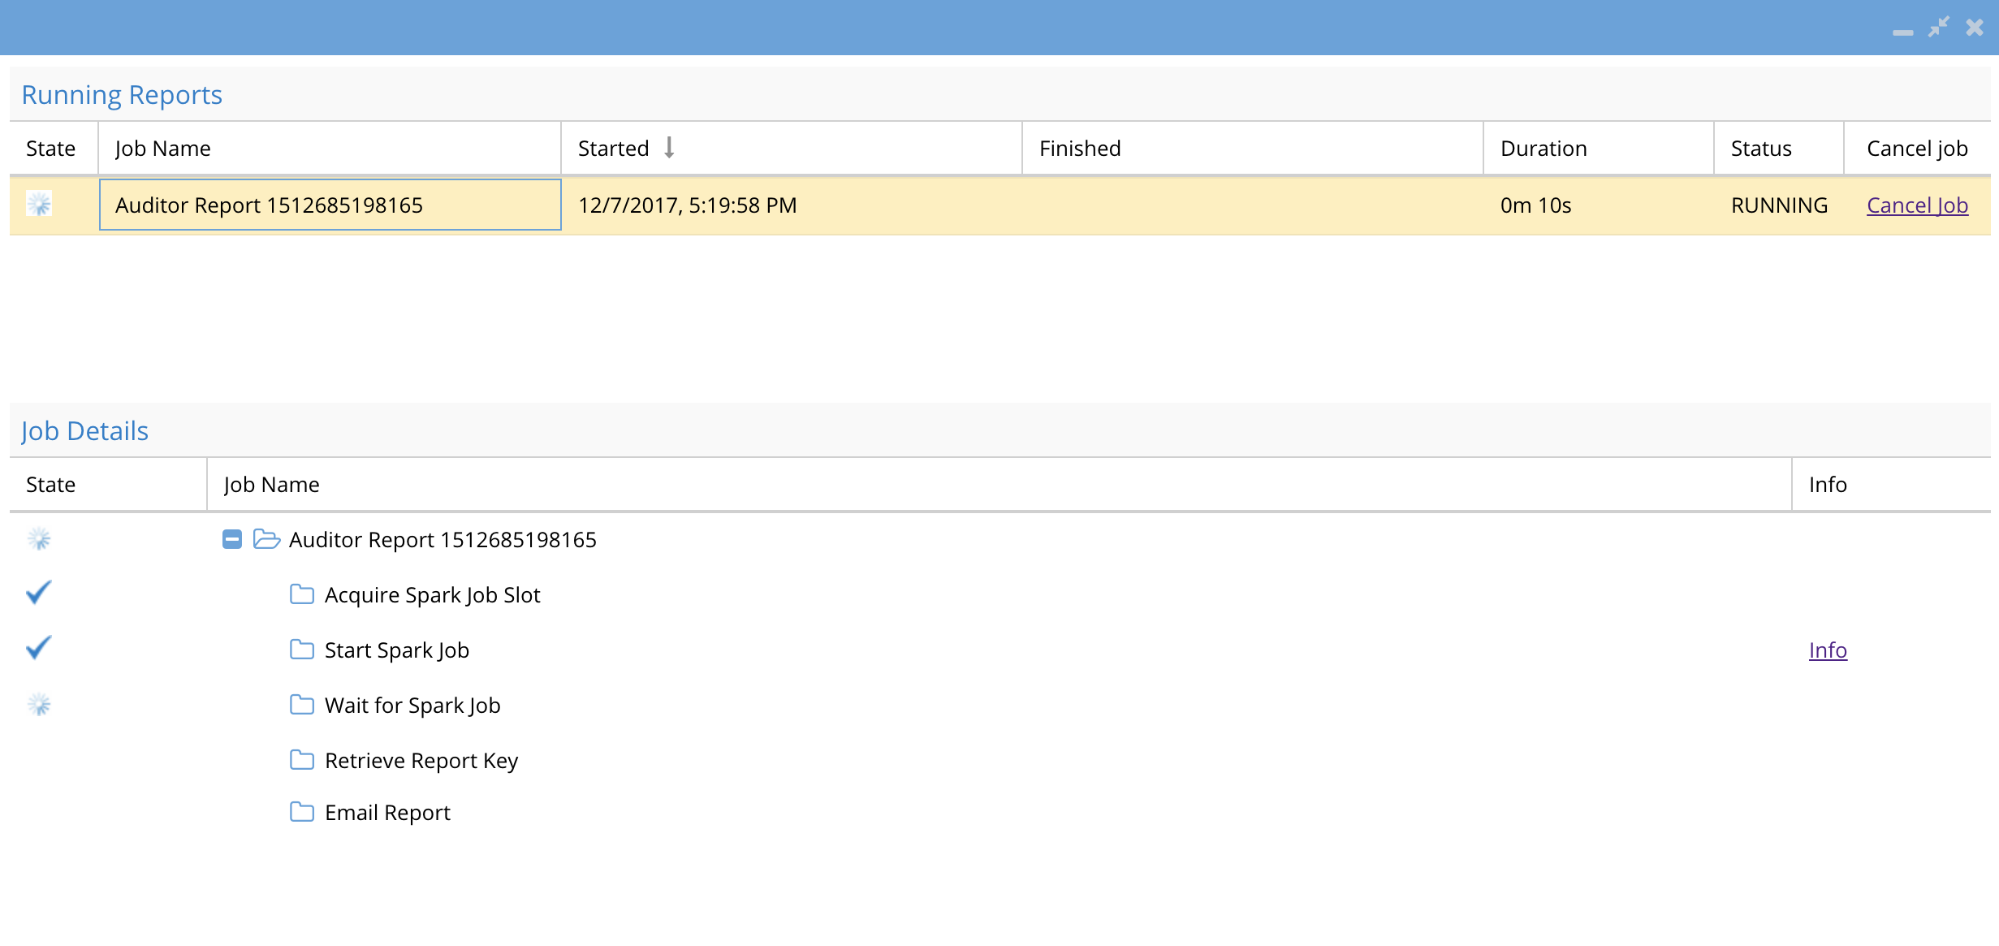
Running Reports Tab
Shows all active running report jobs and details of the running report along with duration and status. Use this tab to monitor a running job and the duration of the running report. Click the link to see the finished report.
Running Reports Monitoring
How to Cancel a running report
- Click the cancel link to cancel a running job
- Once a job is finished a clickable link is displayed to take you to the results on the Finished Report tab.
Best Practice:
- Large reports with a lot of data will take longer to complete, use this screen to determine if changing the query should be done to speed up the report for long running reports.
- Cancel or view reports that are completed or running from this screen.
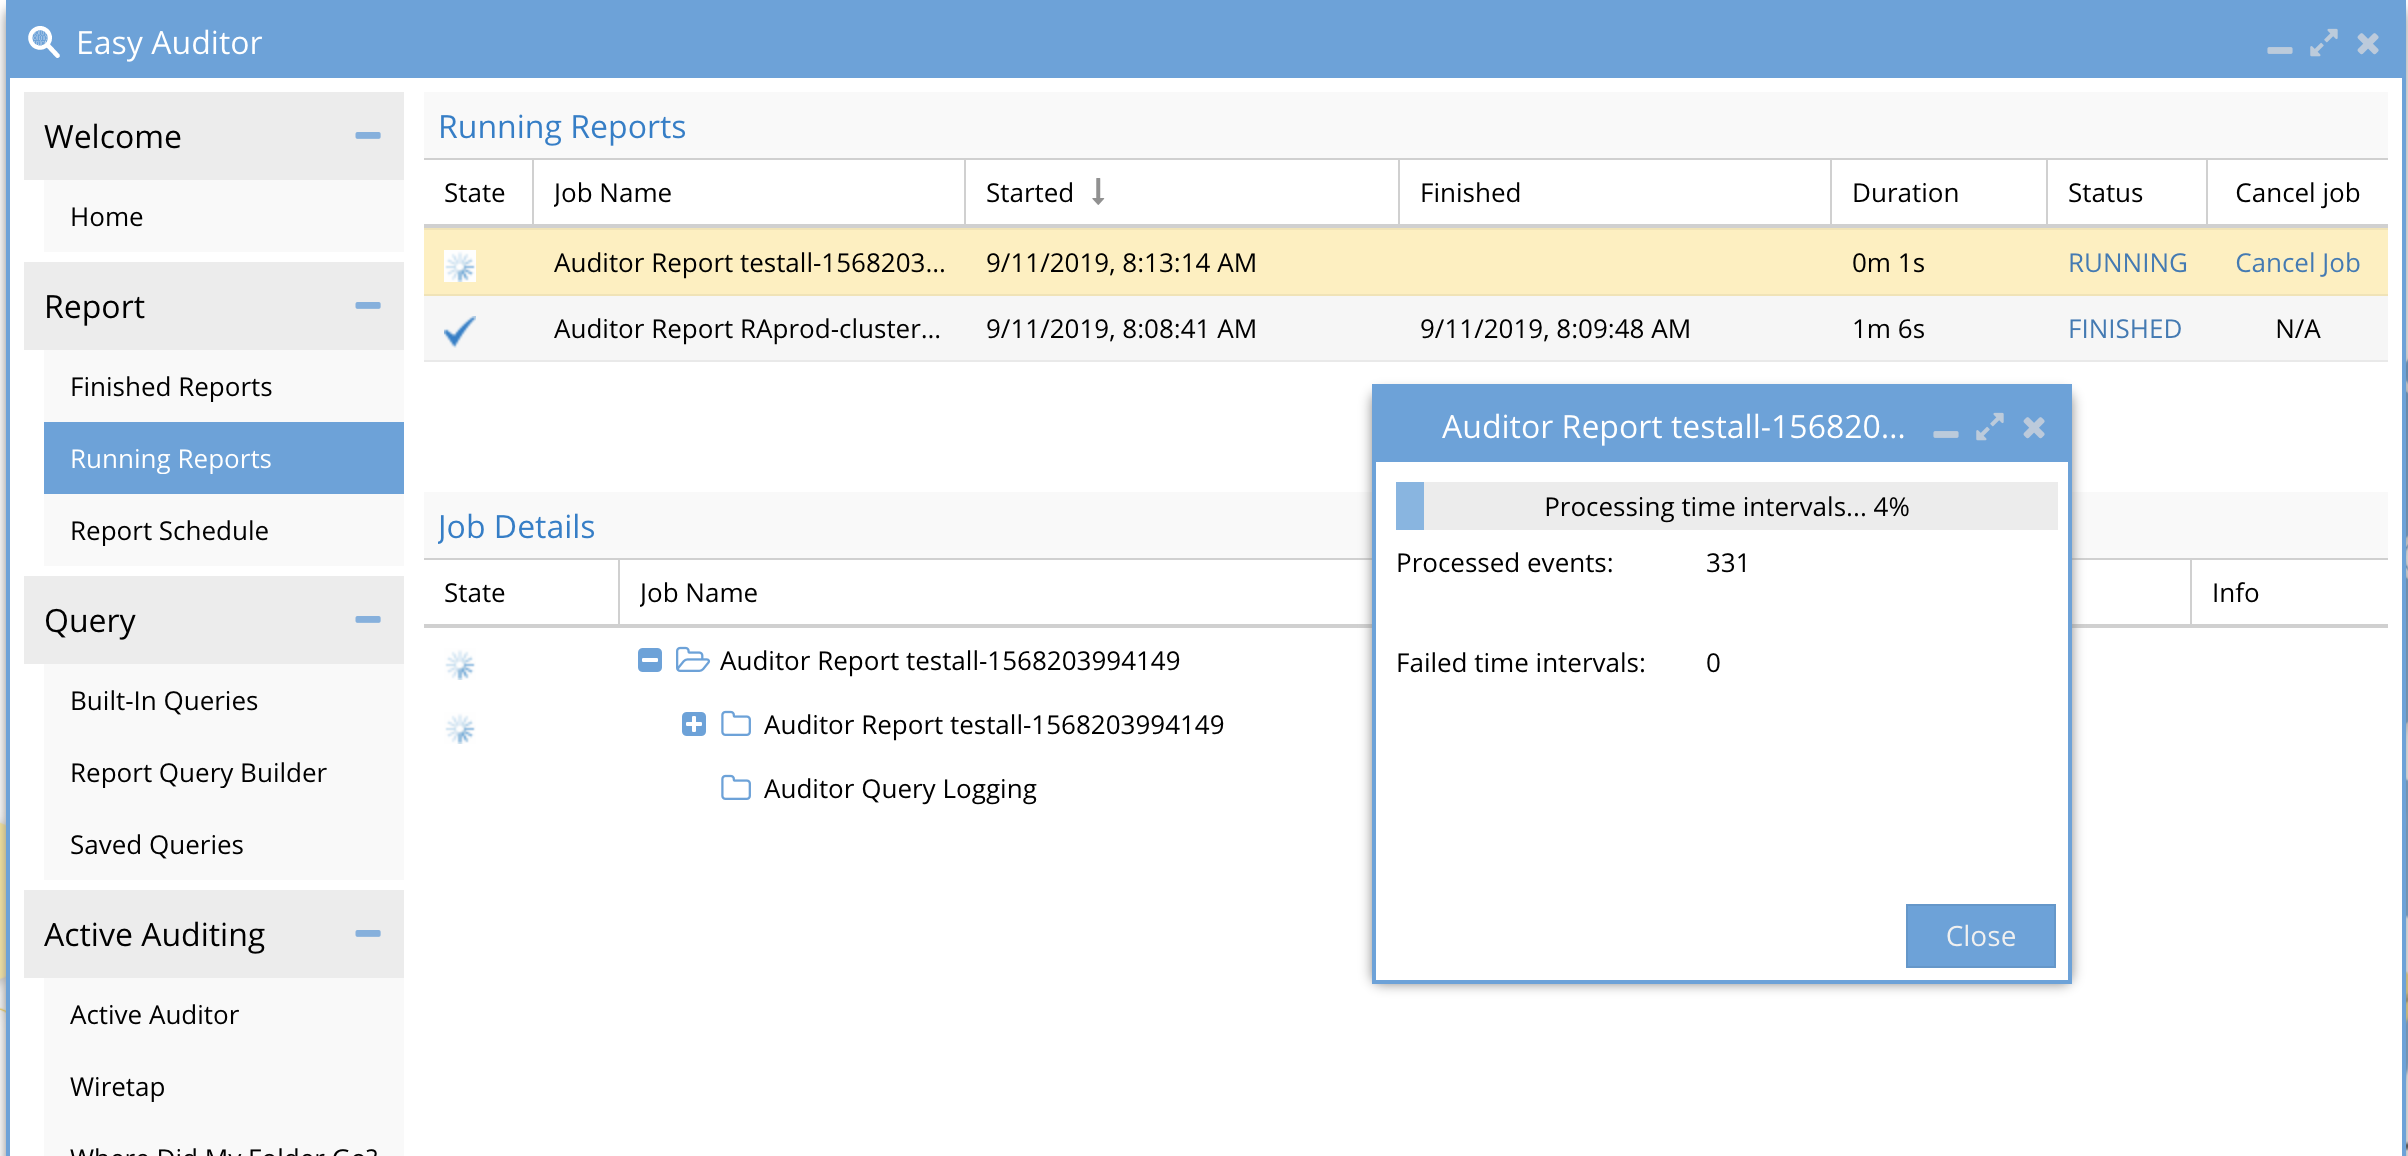
How to Monitor Progress of a Running Search
When a search is running you can monitor its percent completion to know how far along the search has progressed and how many file events have been found during the search. You can also see partial results of a running search on the Reports tab with View preview and Download CSV while a search is running.
- Click on the Running Status in the Running Reports tab to view the real time statistics of the search including % completion, found events and any failed searches in a portion of the database.
Finished Reports
This tab stores all reports and results for download
The saved reports shows completion time, duration, date range covered, job ID, number of rows of results and a download link to the report. A debug link to the search query details is now available for support purposes.
For long running queries the CSV file can be downloaded to get partial data returned from the query, using the continous search mode.
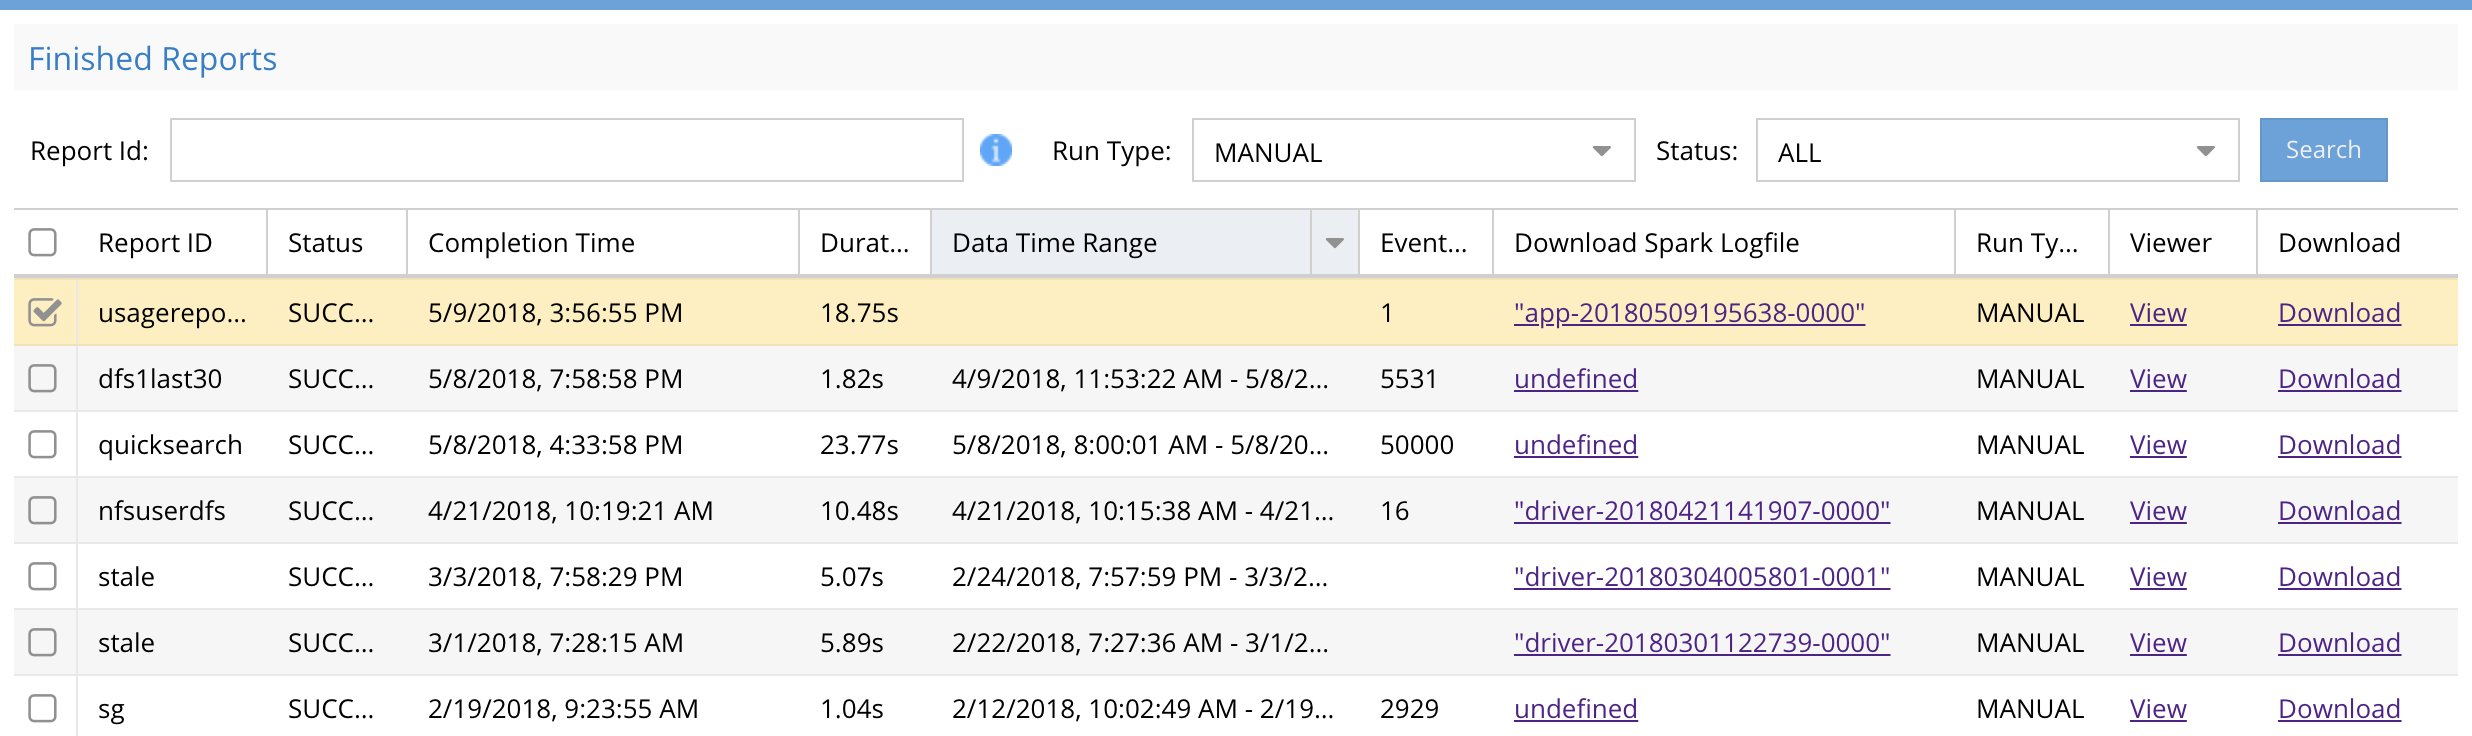
Filter Reports tab
Use the Search button and dialog box to filter the list of display reports.
-
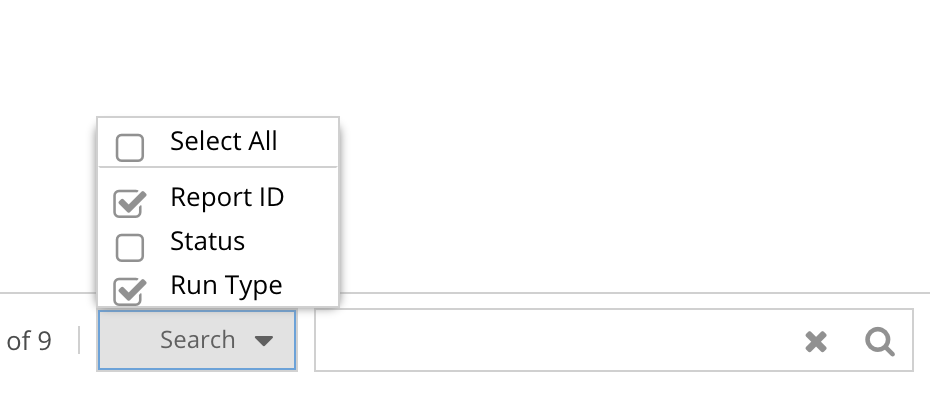
- Select all to search and filter any Report ID, Run type (Manual or scheduled), Status (success or failed)
- Example to find all reports that begin with User. Enter User in the search box.
- Example to find all the scheduled reports enter scheduled
- NOTE: default filtering will NOT show scheduled reports and only shows manually executed reports, to see scheduled reports filter the report. This was done incase scheduled searches had 100's of reports that would make it hard to find manual searches.
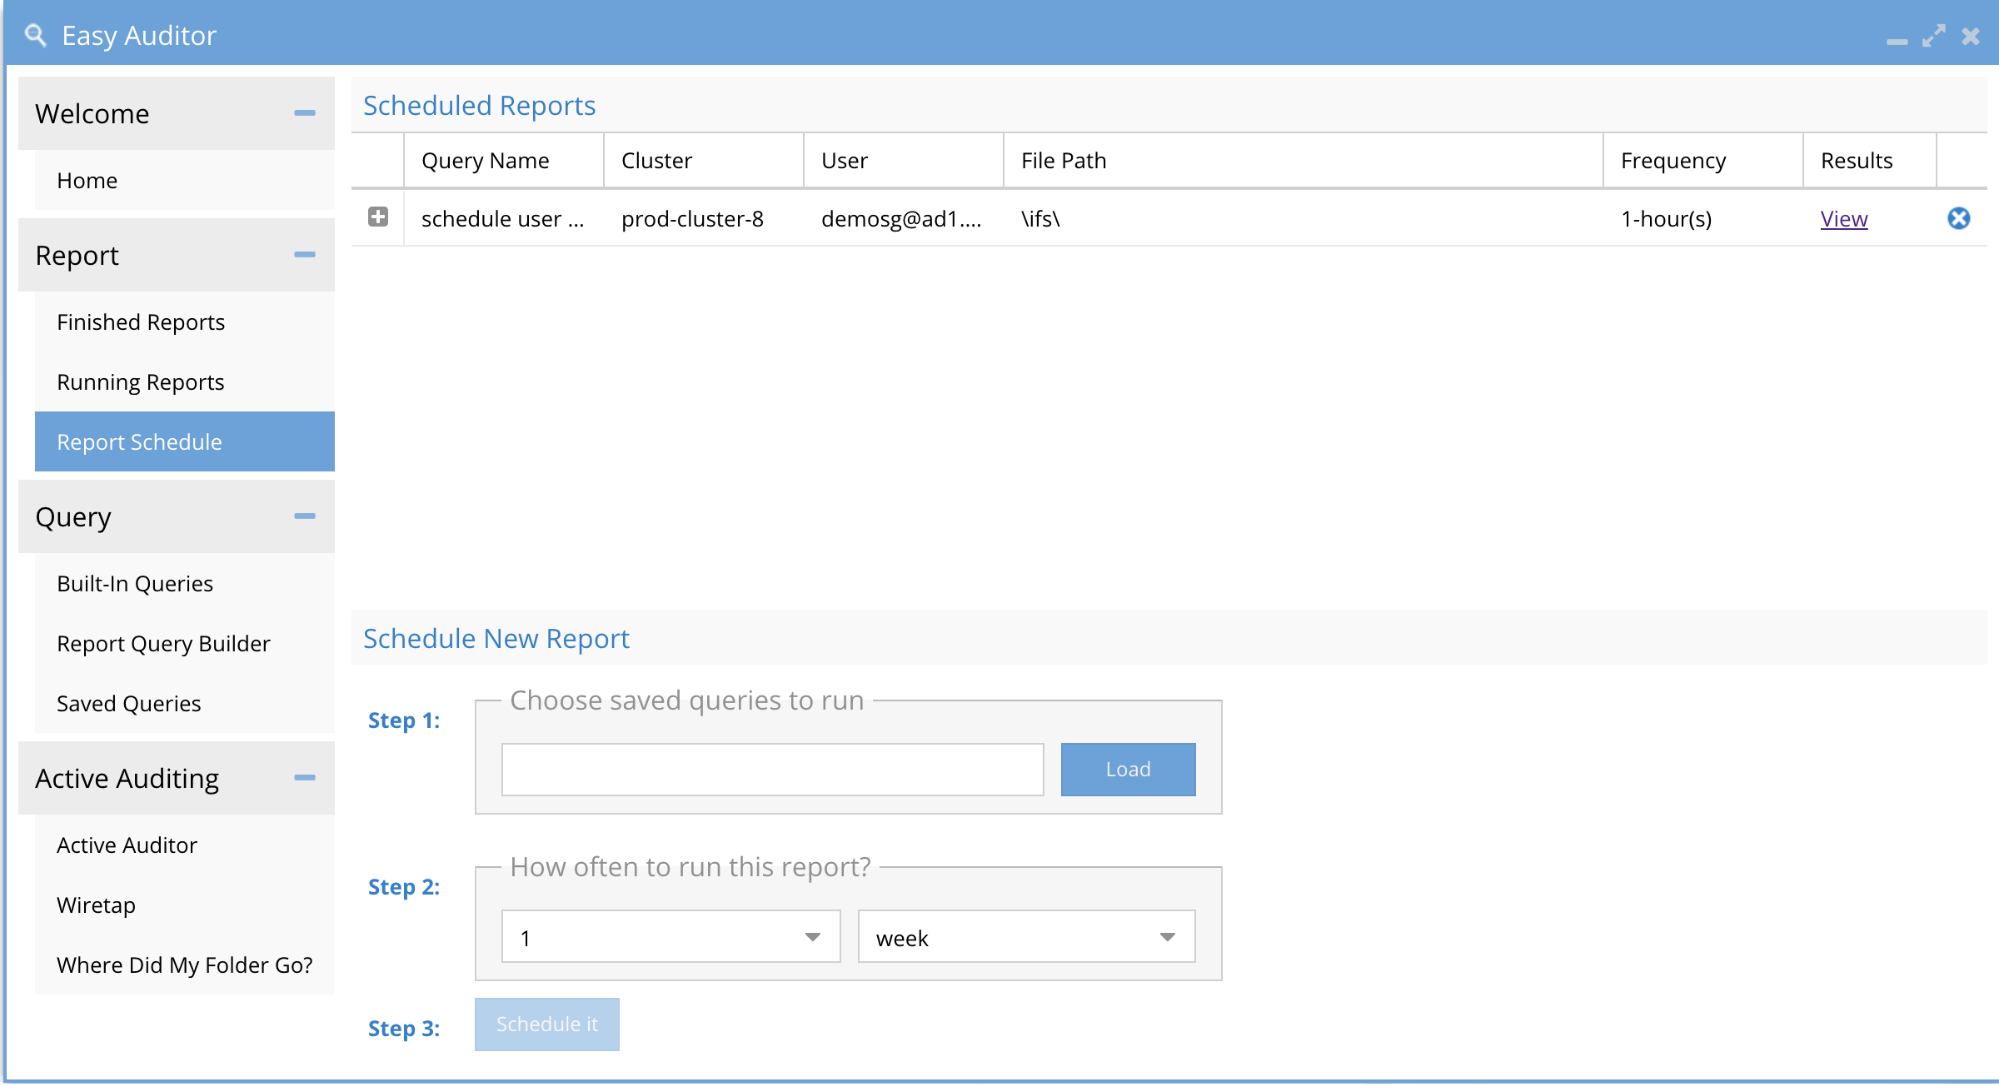
Report Schedule Tab
Use this tab to view, load and delete scheduled queries.
|
|
NOTE: See tested feature limits for scheduled search limits |
How to delete a saved Scheduled Query
- Select the Schedule checkbox
- Click Delete Schedule
How to load a Query and set a Schedule
- Click the load saved Query
- Select a query from the list
- Set the schedule
- Click Schedule to save
How to edit a saved Scheduled Query
- Select the schedule from the list with the checkbox
- Change the schedule
- Click the schedule button
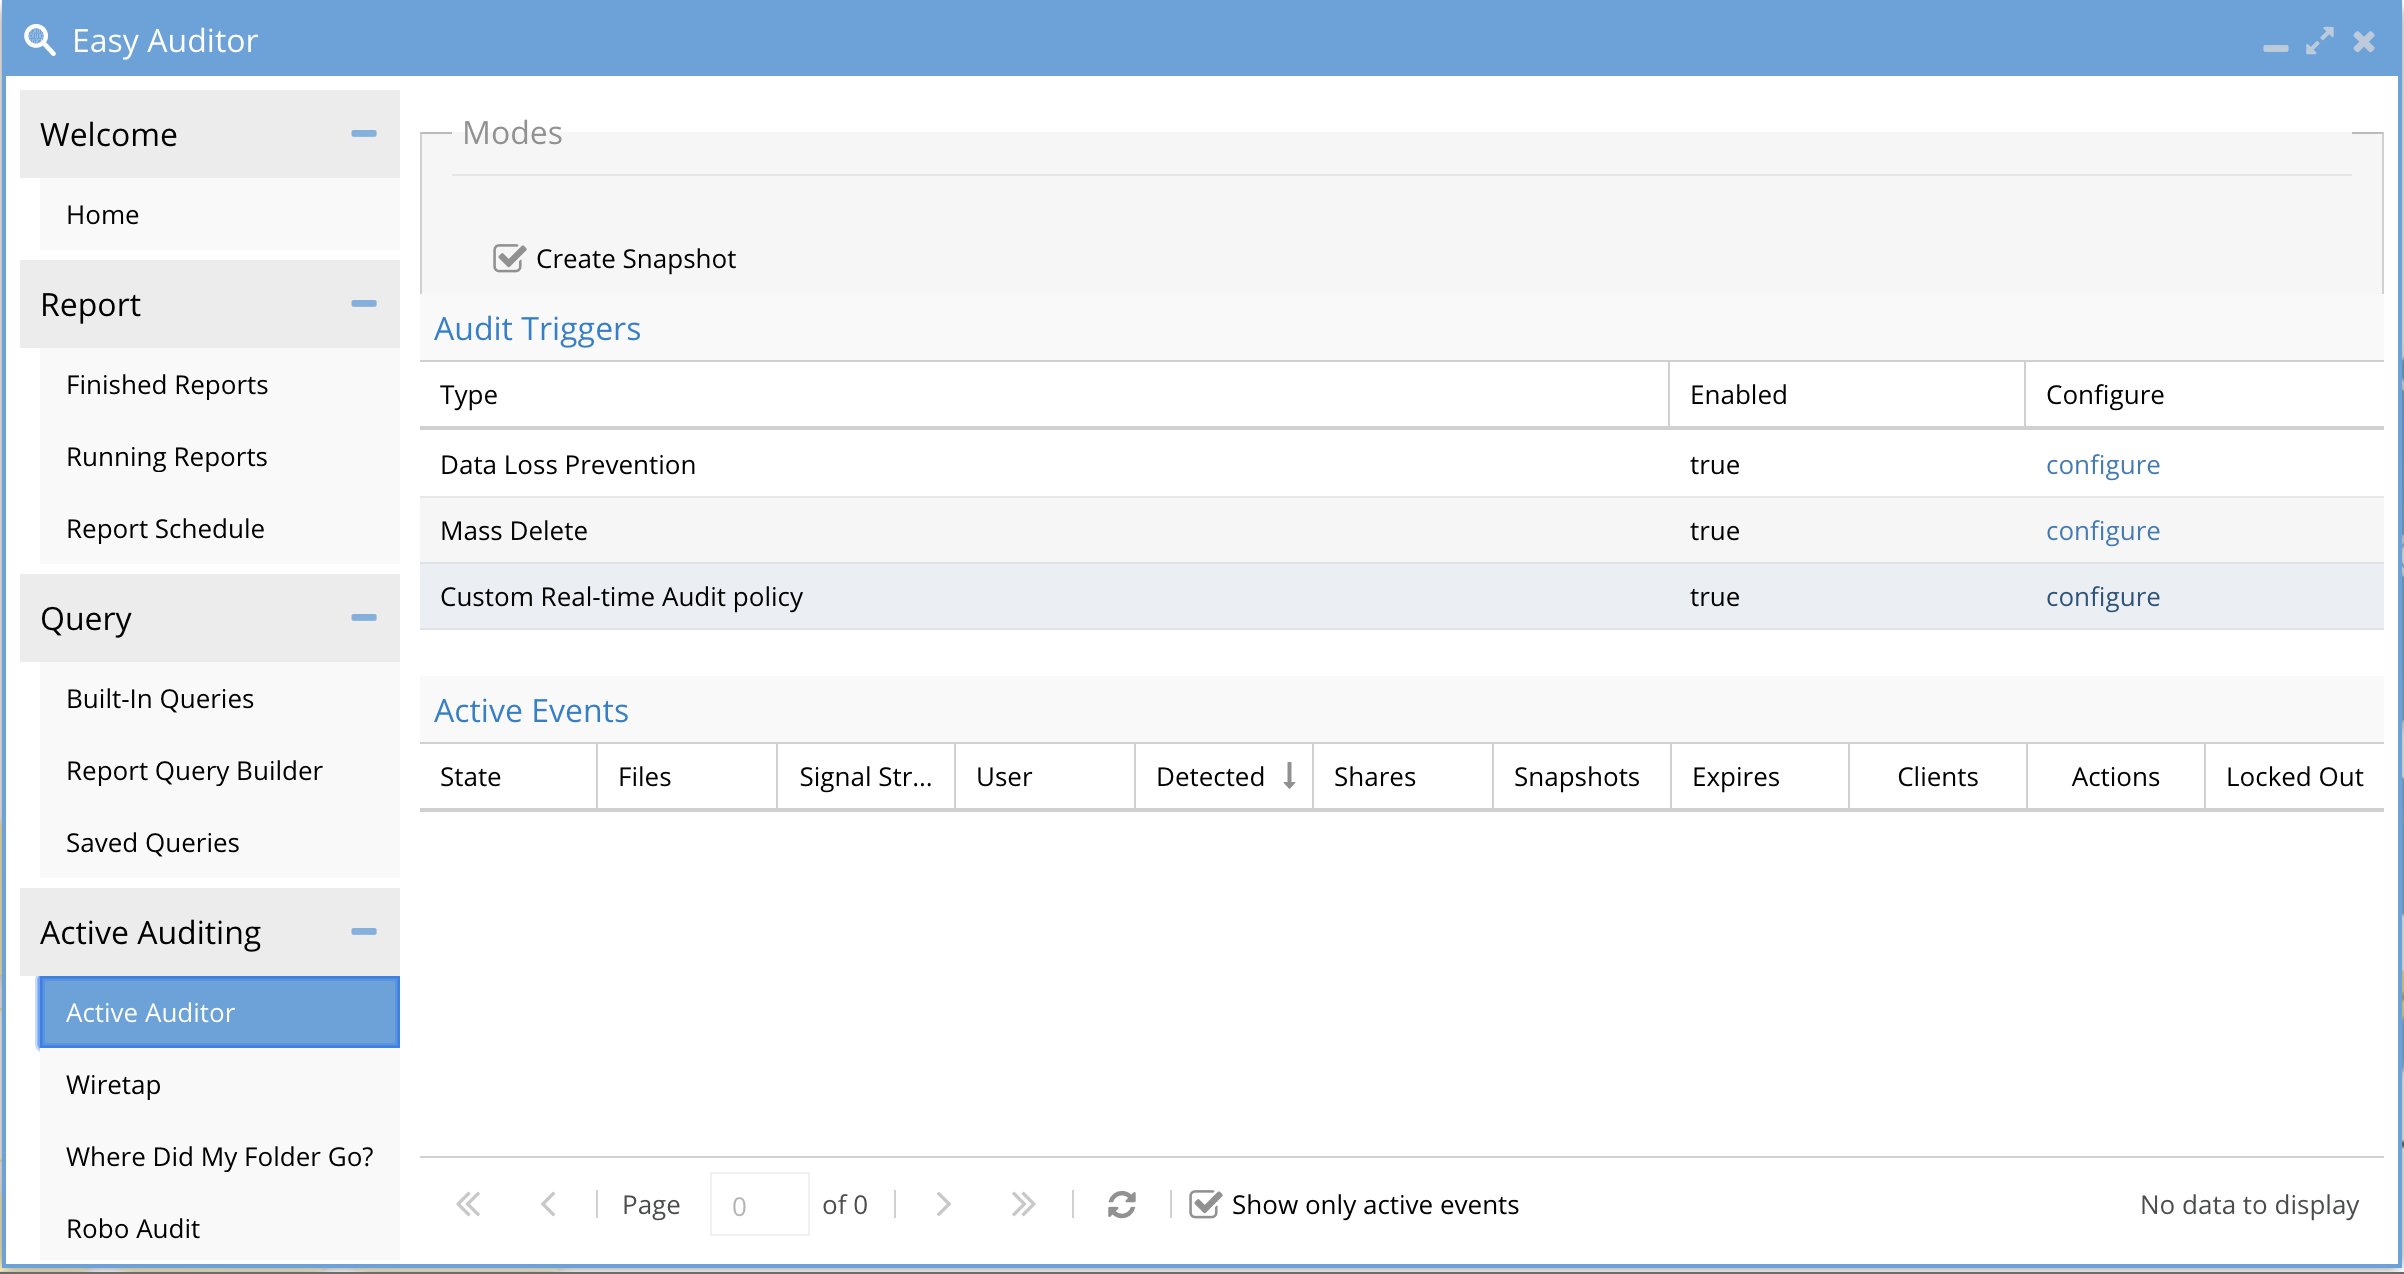
Active Auditor Tab
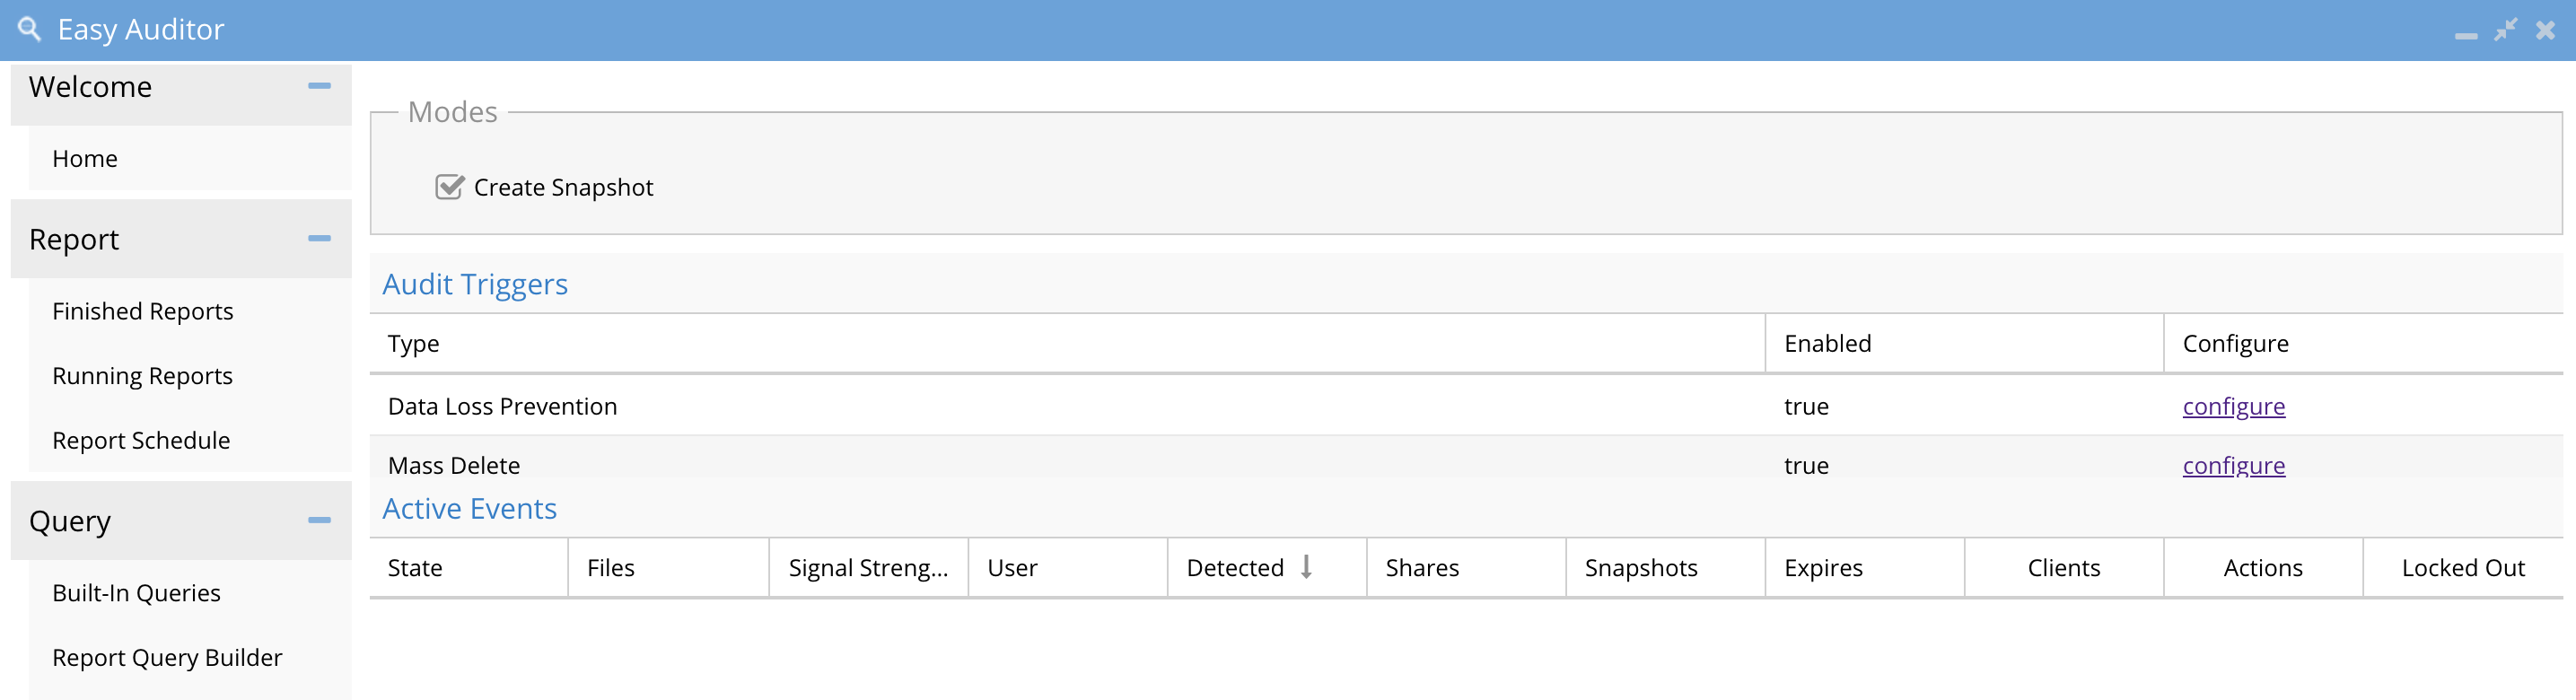
This tab is for configuring real-time audit features, to secure and protect data from delete and data loss on secure shares. Any active triggers are displayed on this page with relevant information for the active audit trigger.
Active Auditing Tab Overview
Overview
The policies on this tab are a policy that the ECA cluster will execute in real-time as events are processed.
The feature allows for per-user monitoring of file deletes or data copies upto threshold over a period of time
The main tab indicates if the audit feature is enabled or disabled.
NOTE: These triggers are supported for SMB users only. Not supported for NFS client connections
How to Configure Custom Real-time Audit Policies
Overview:
This feature eliminates most of the reasons to run reports and automates the security of almost any scenario. This feature allows administrators to build simple or complex policies that identify patterns, users, actions or even network access to the file system. This solution is designed to eliminate running reports in a reactive security mode and enables, for the first time, a proactive security solution for auditing.
This feature also includes predictive threshold monitoring that takes the threshold crossing settings and uses rate prediction to provide more accurate detections.
How to Manage customer Real-time Audit policies
-
Select the Active Auditor Configure option for Custom real-time policies
-
- The image below shows all configured triggers. The enable check box enables all trigger processing. A trigger can be edited or deleted.
-
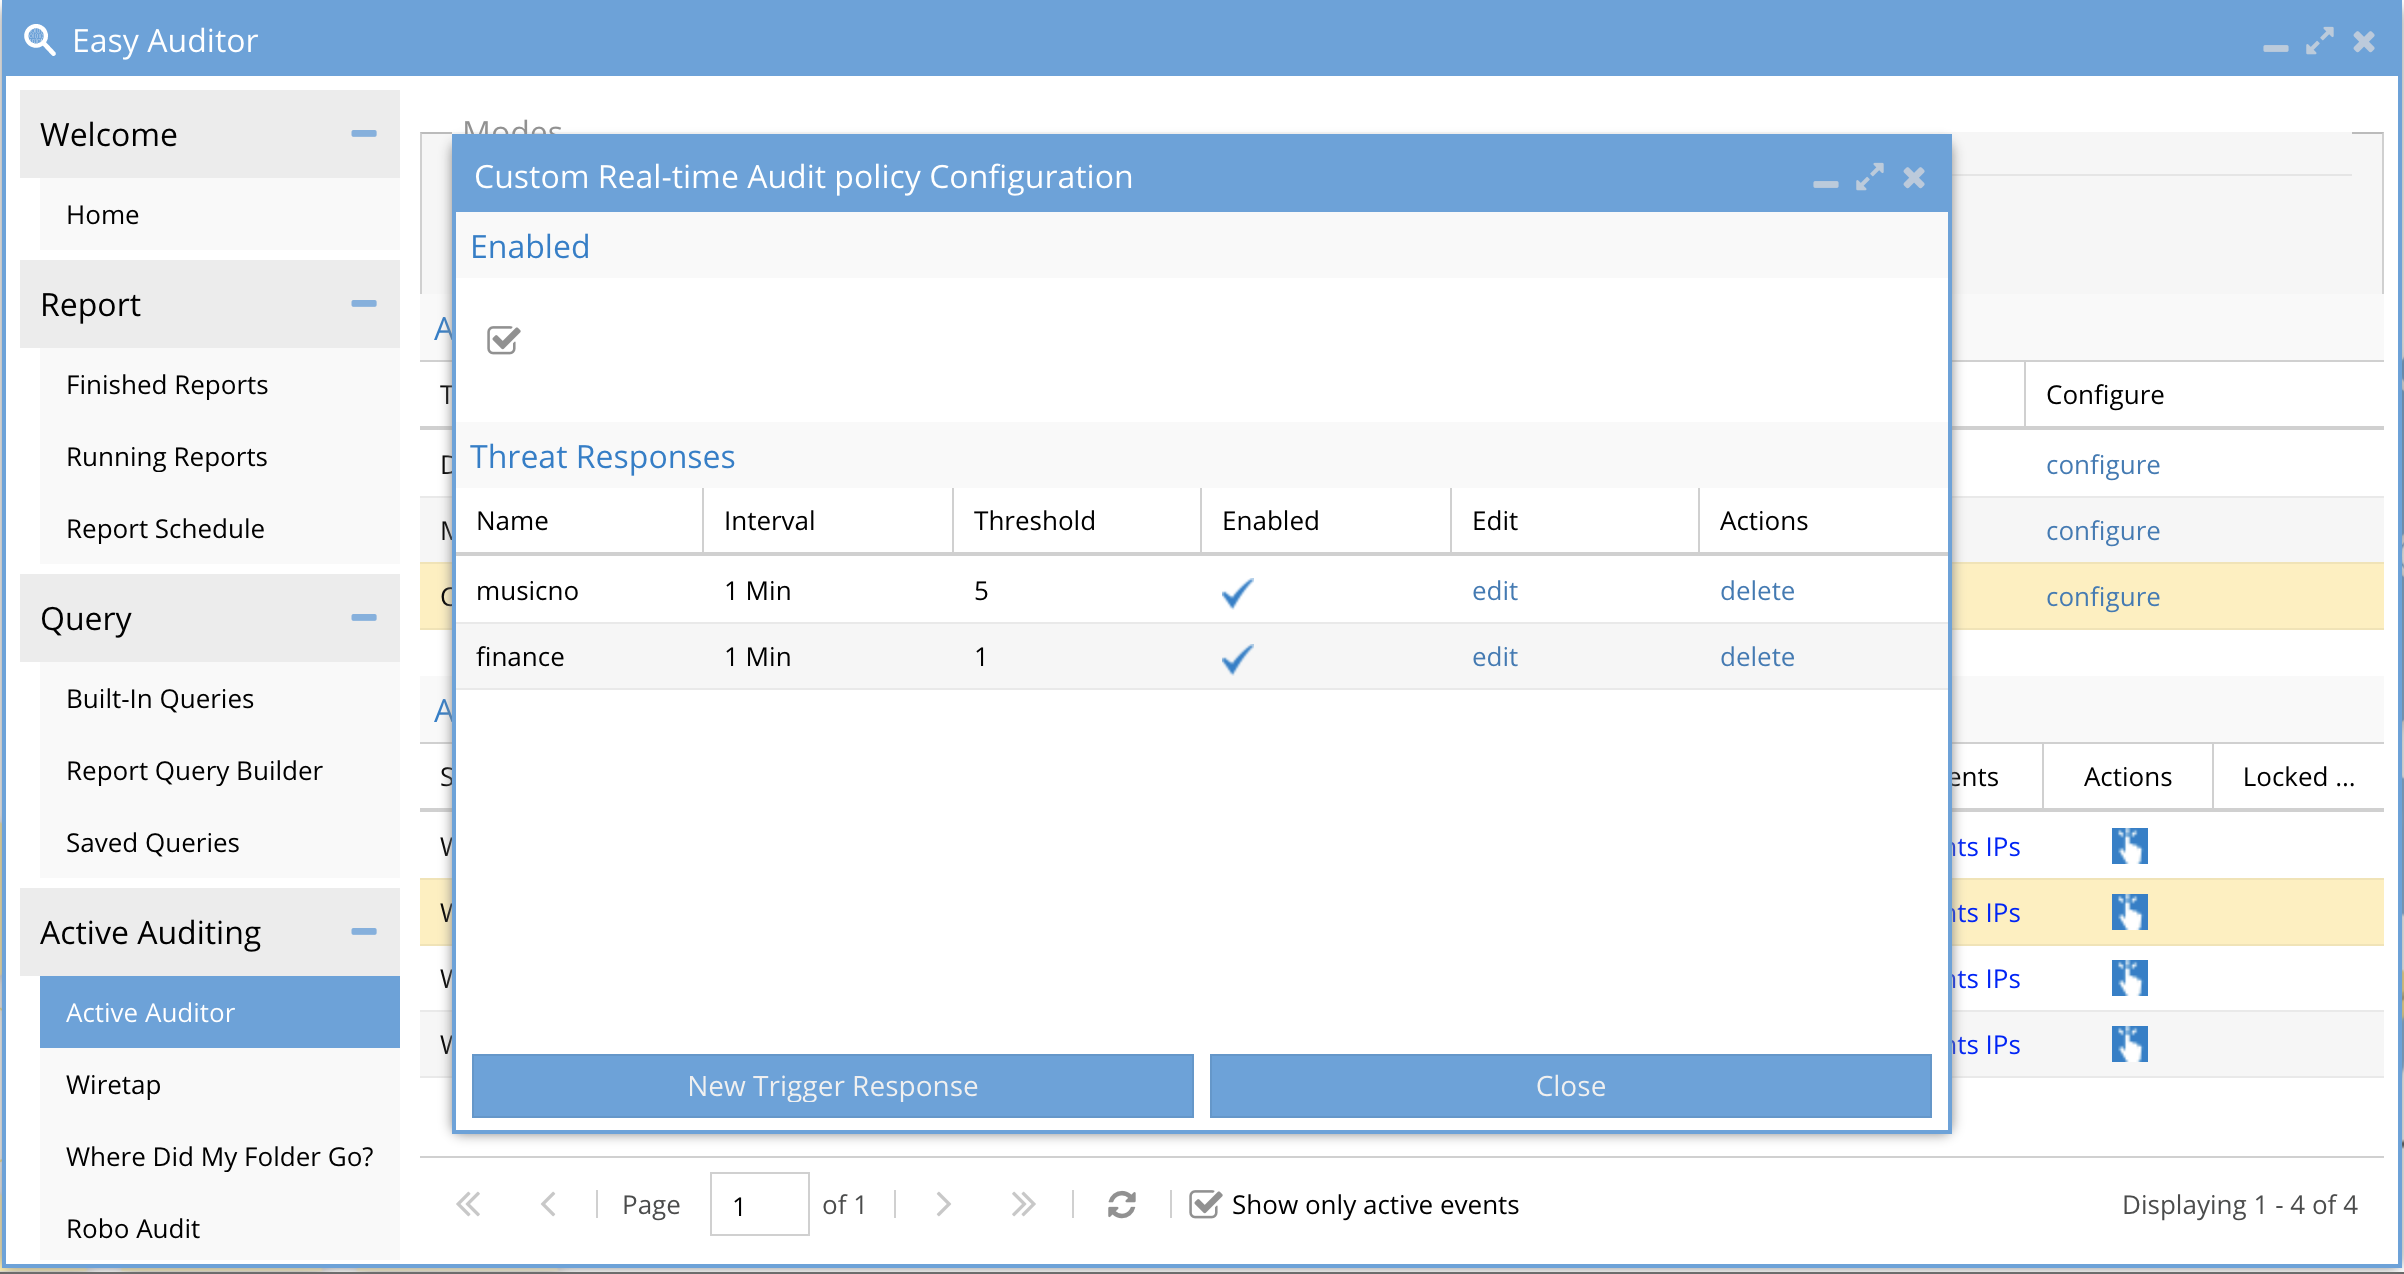
- To Create a new trigger click the New Trigger Response button.
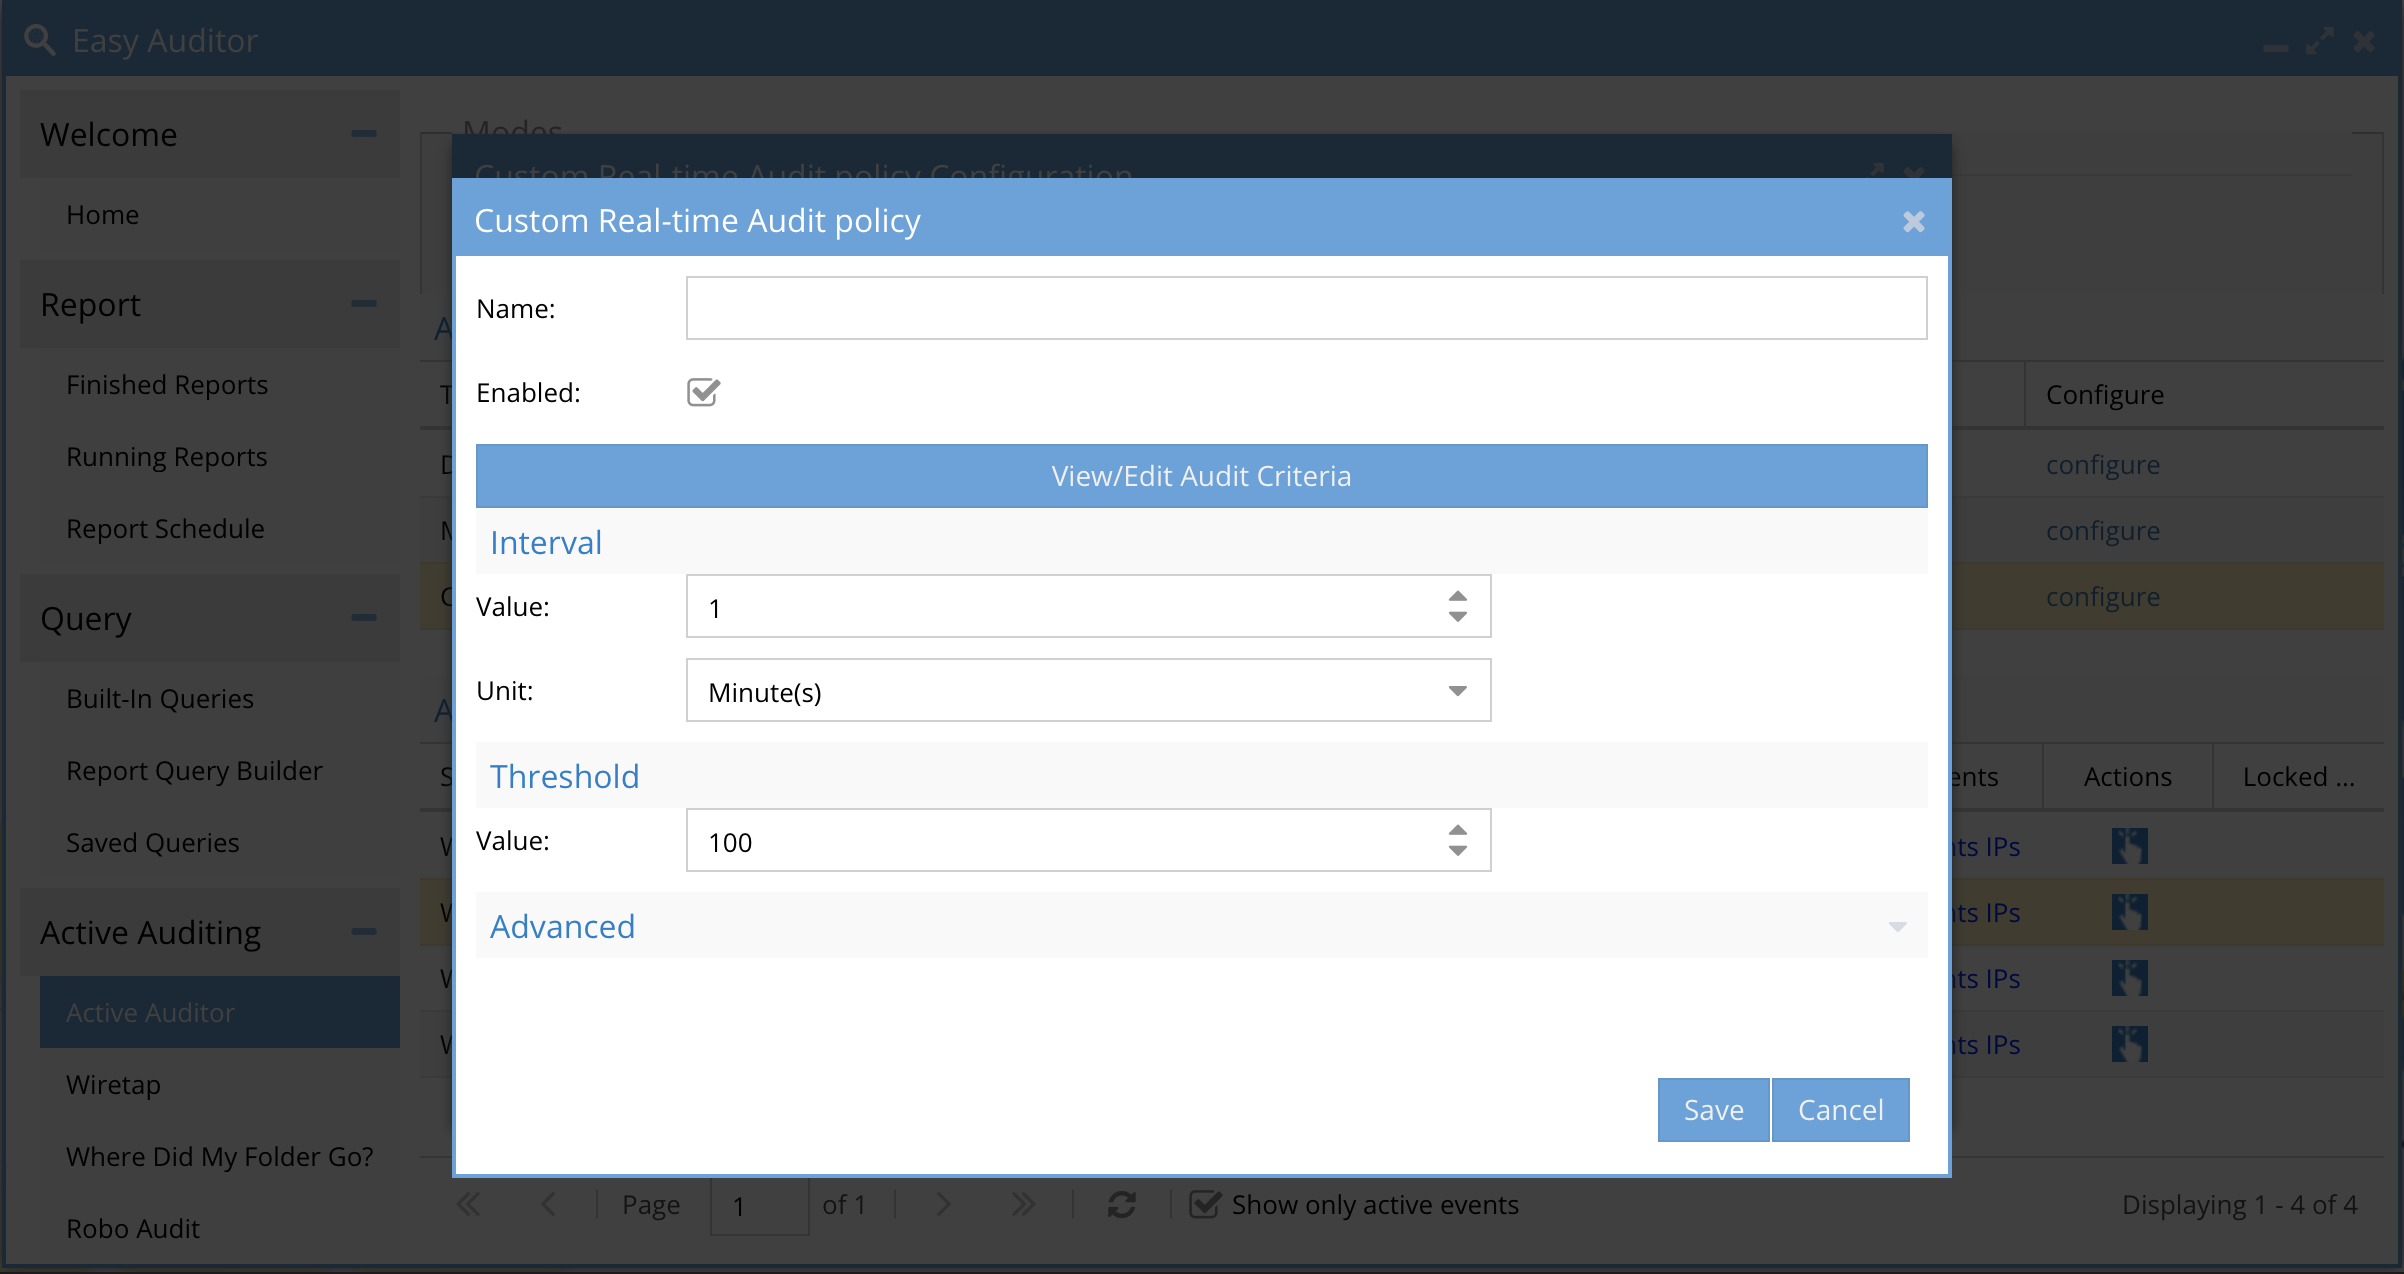
How to Configure real time audit policies
- Click Configure in the Custom Audit policies screen
- Click New Trigger Response button
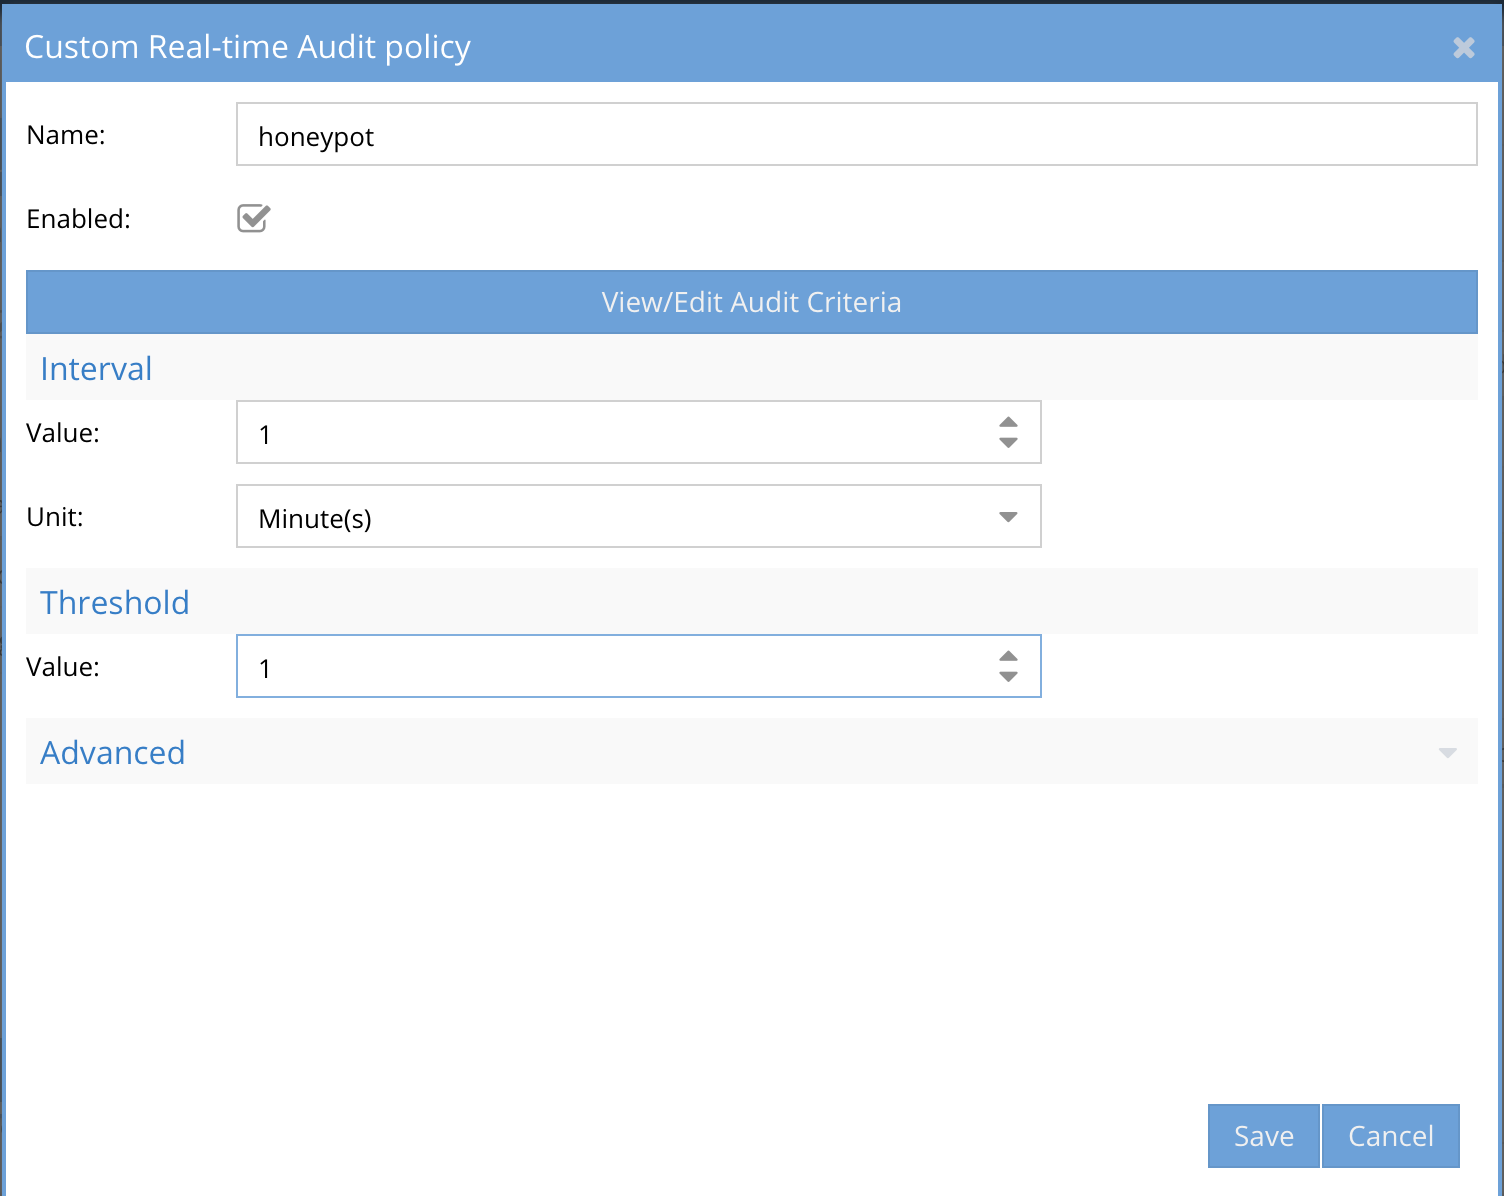
- Enter a unique policy name. Note: This name will be used in email alerts and syslog messages. NOTE: Only characters and numbers, no spaces or special characters in the name.
-
- The enable check is defaults to enabled. A trigger can be disabled temporarily if required.
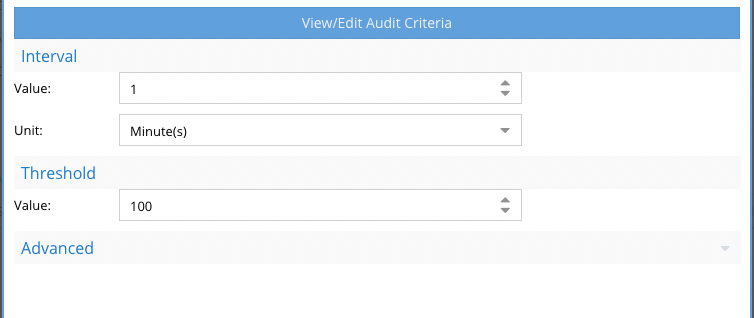
- The Unit section is the period of time that the policy definition will monitor events to determine if the condition defined was met. This is settable in minutes from 1 to 60 minutes.
- The Threshold section is the number of times the condition must be met within the Unit in minutes to trip the policy. Until this is true no alert will be sent. This setting can be tuned to ensure the policy does not trip to easily or change the Unit section to monitor over a longer period of time. Valid values is any number greater than 0.
- NOTE: This threshold will be managed by predictive rate monitoring feature that calculates rate of detection to determine if the policy will be true at the unit value set in minutes. This will provide more accurate triggers without needing to worry about a specific rate for detection. The active auditor trigger window will indicate if the detection was predicted or actual.
-
Optional - Advanced configuration of policy evaluation
-
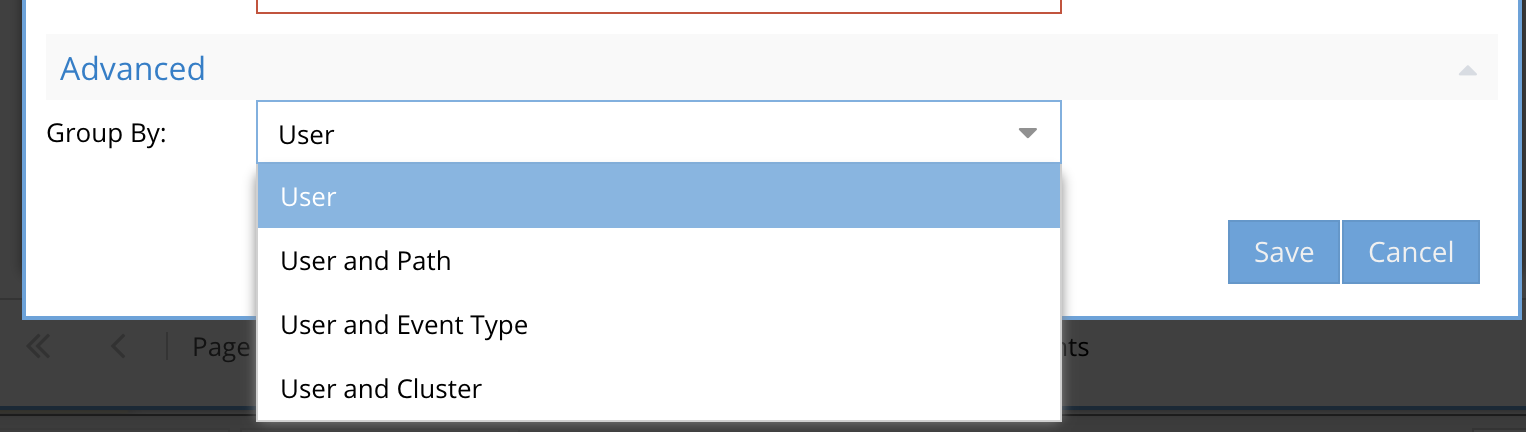
- The default is group by user which means the trigger processing evaluates the policy per user.
- The user and path option means the trigger processing evaluates the policy per user AND A path meaning a user and a single path must met the criteria configured in the policy.
- User and cluster would evaluate the trigger policy and trip only when the user and a cluster match the criteria, unlike the default setting where events for the user are evaluated from events from any cluster.
-
- Real time Policy query definition
- Click the button View/edit audit criteria
- Audit Event criteria Definitions
-
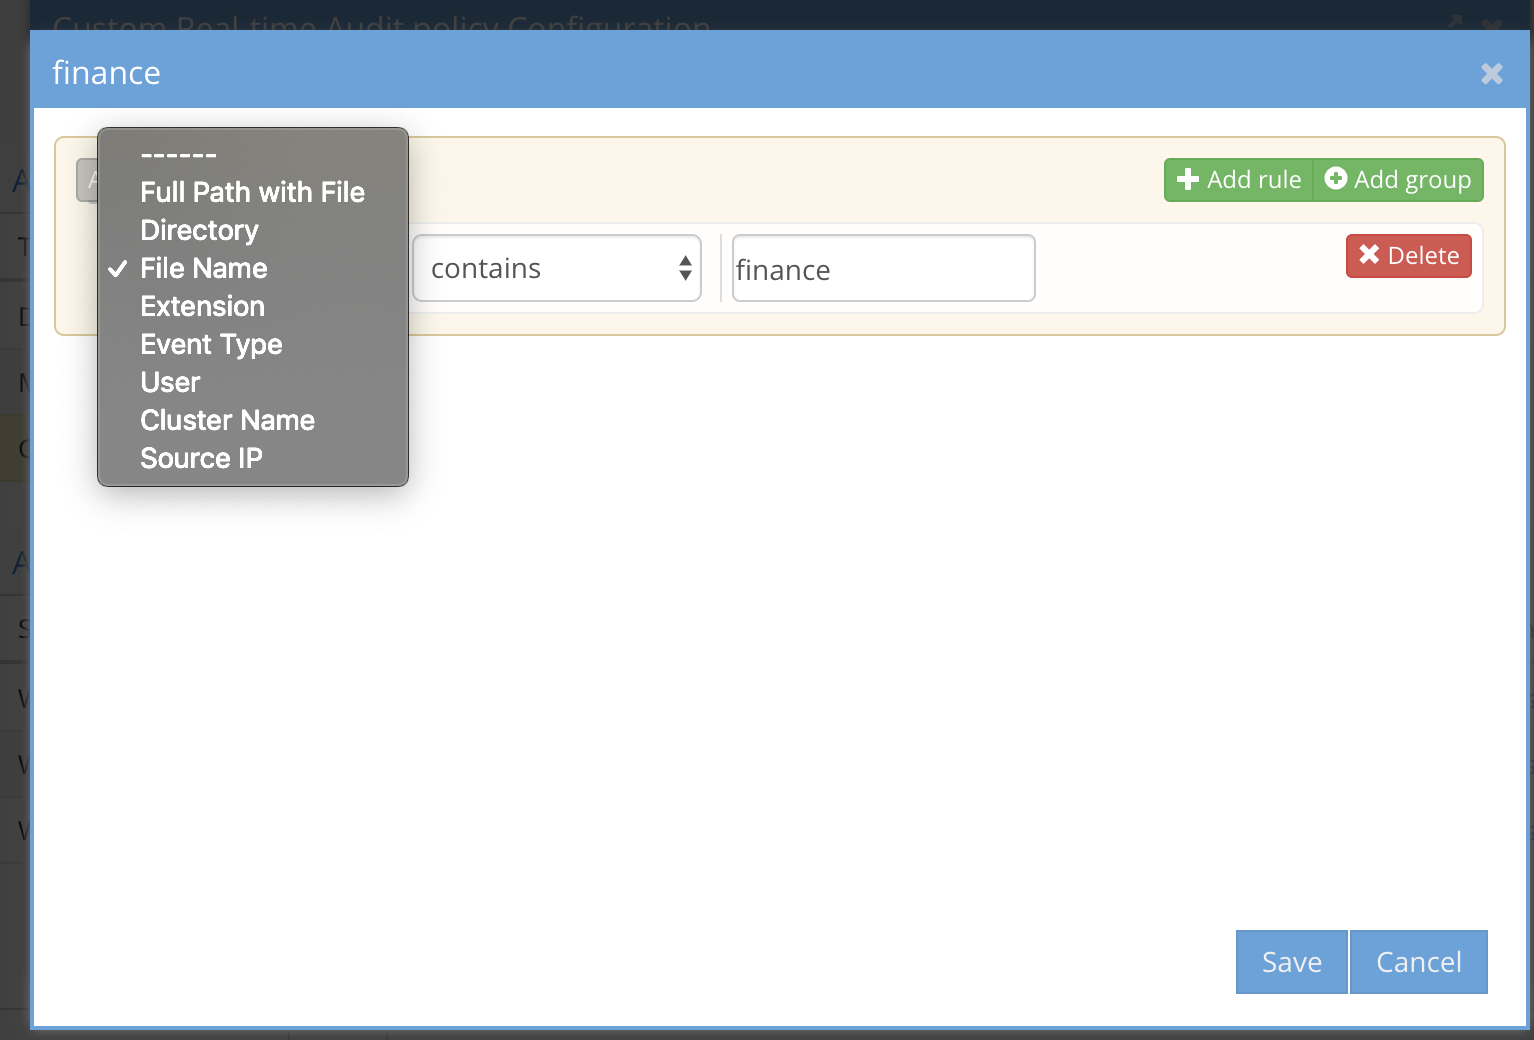
- Full path with file - enter a full path including the file name to monitor an exact file example /ifs/data/zone1/marketing/marketing-plan.docx (Supported comparison options equal, not equal, contains, doesn't contain, ends with, doesn't end with, begins with, doesn't begin with)
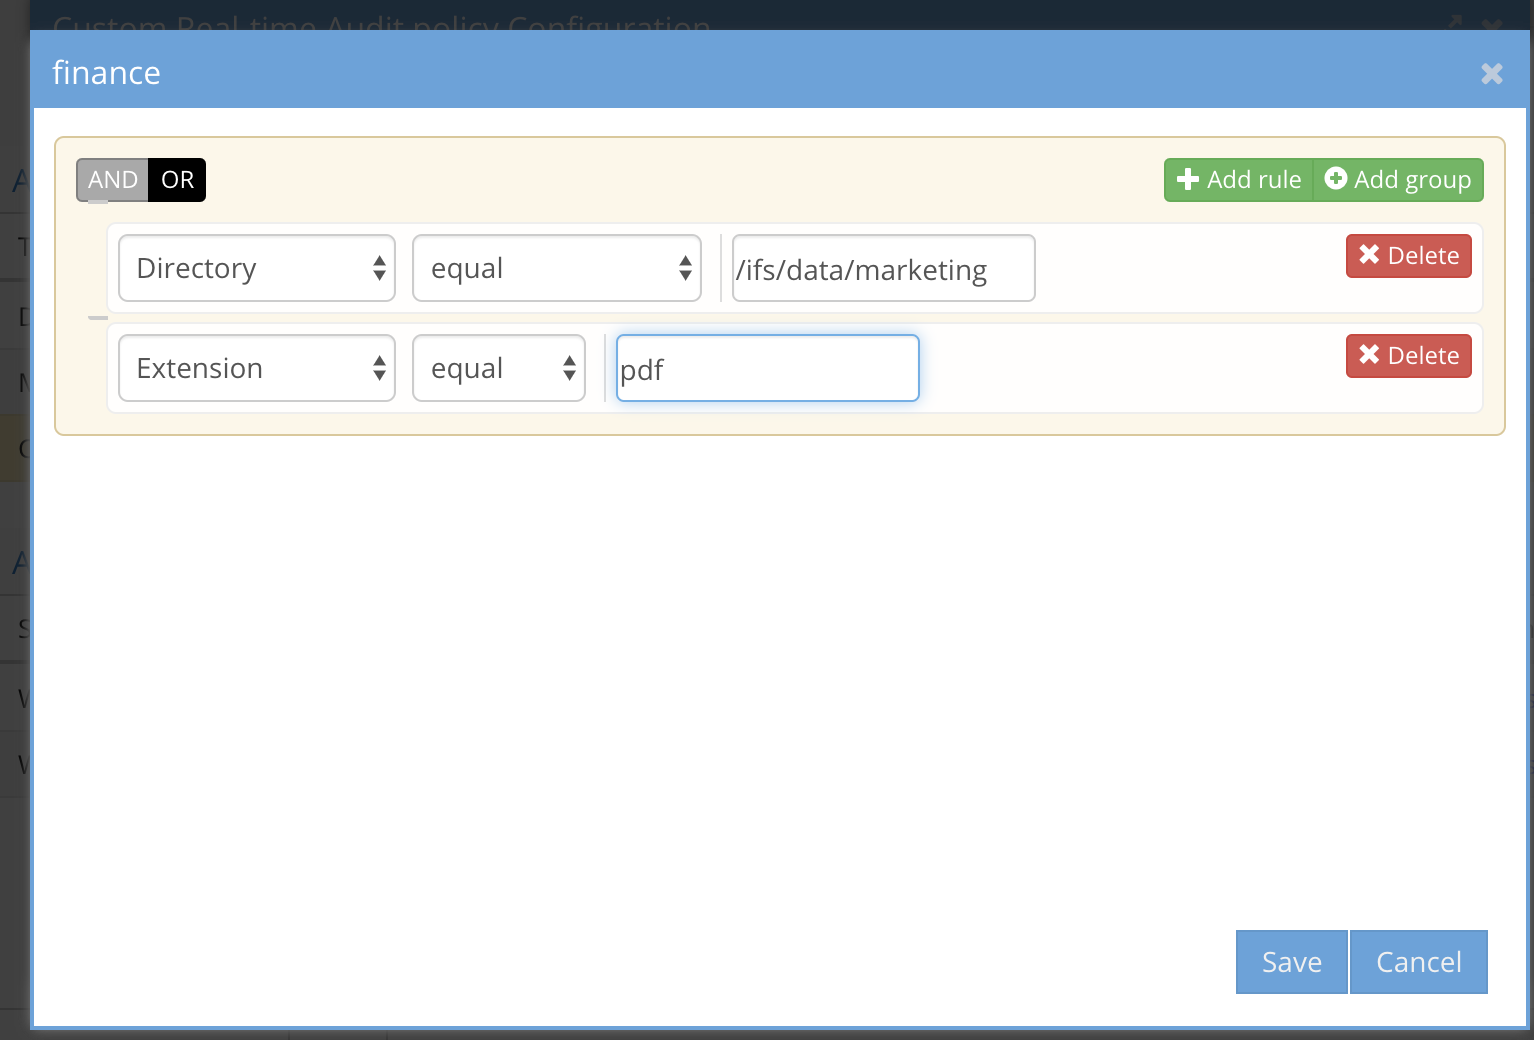
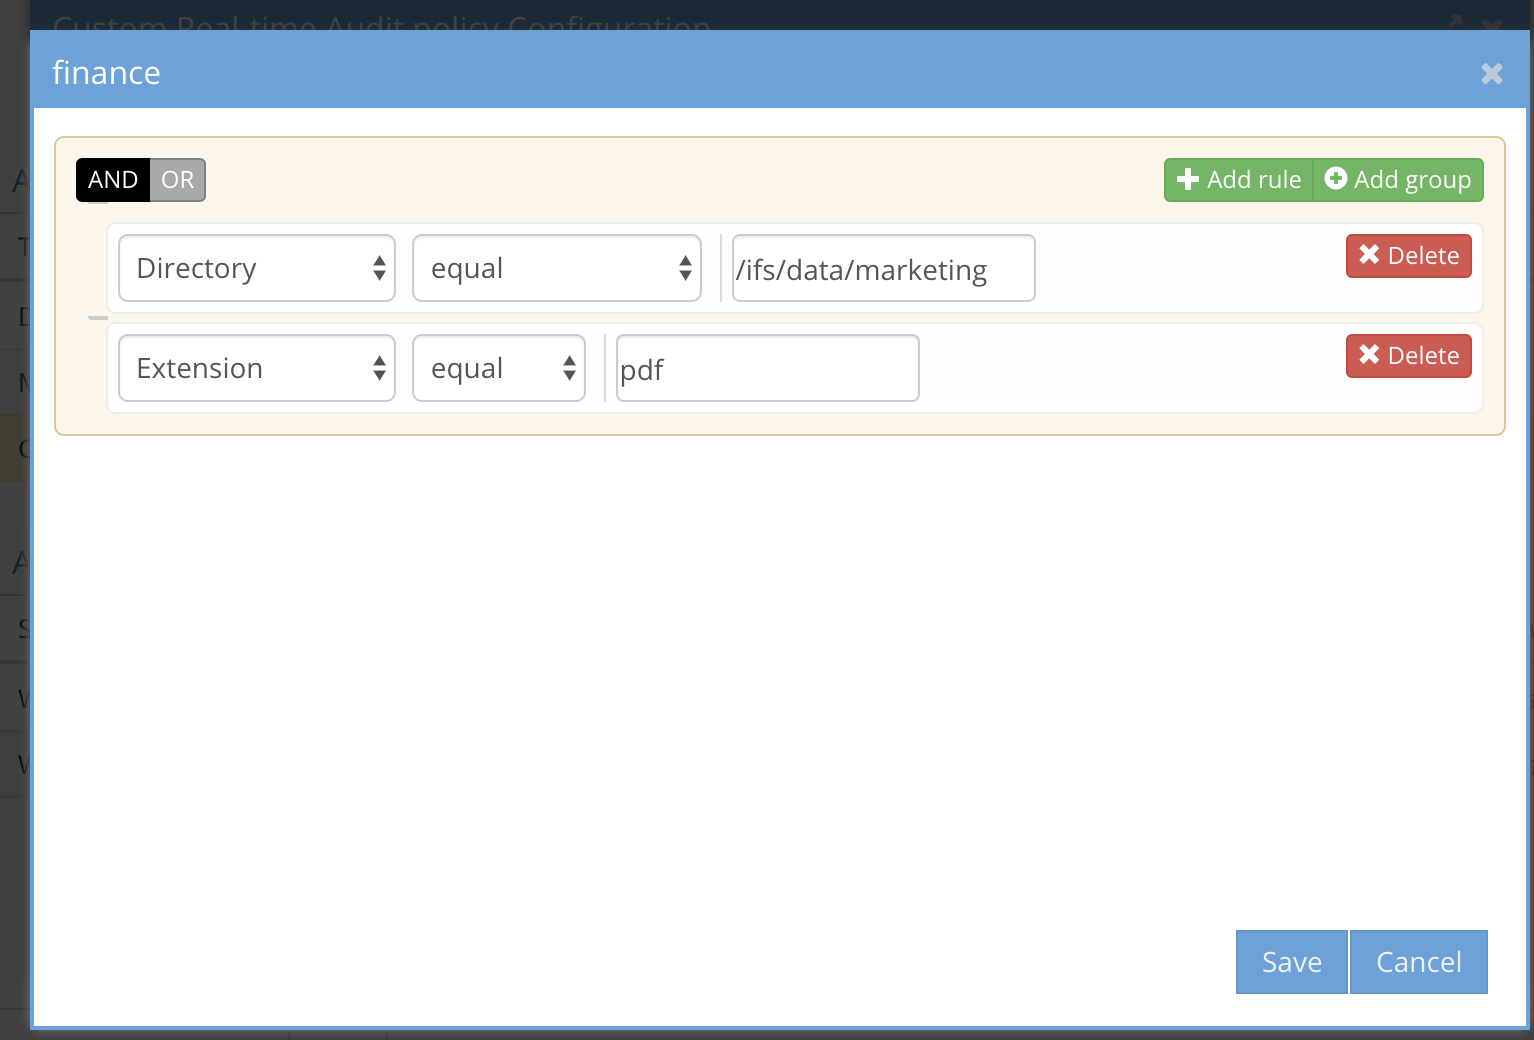
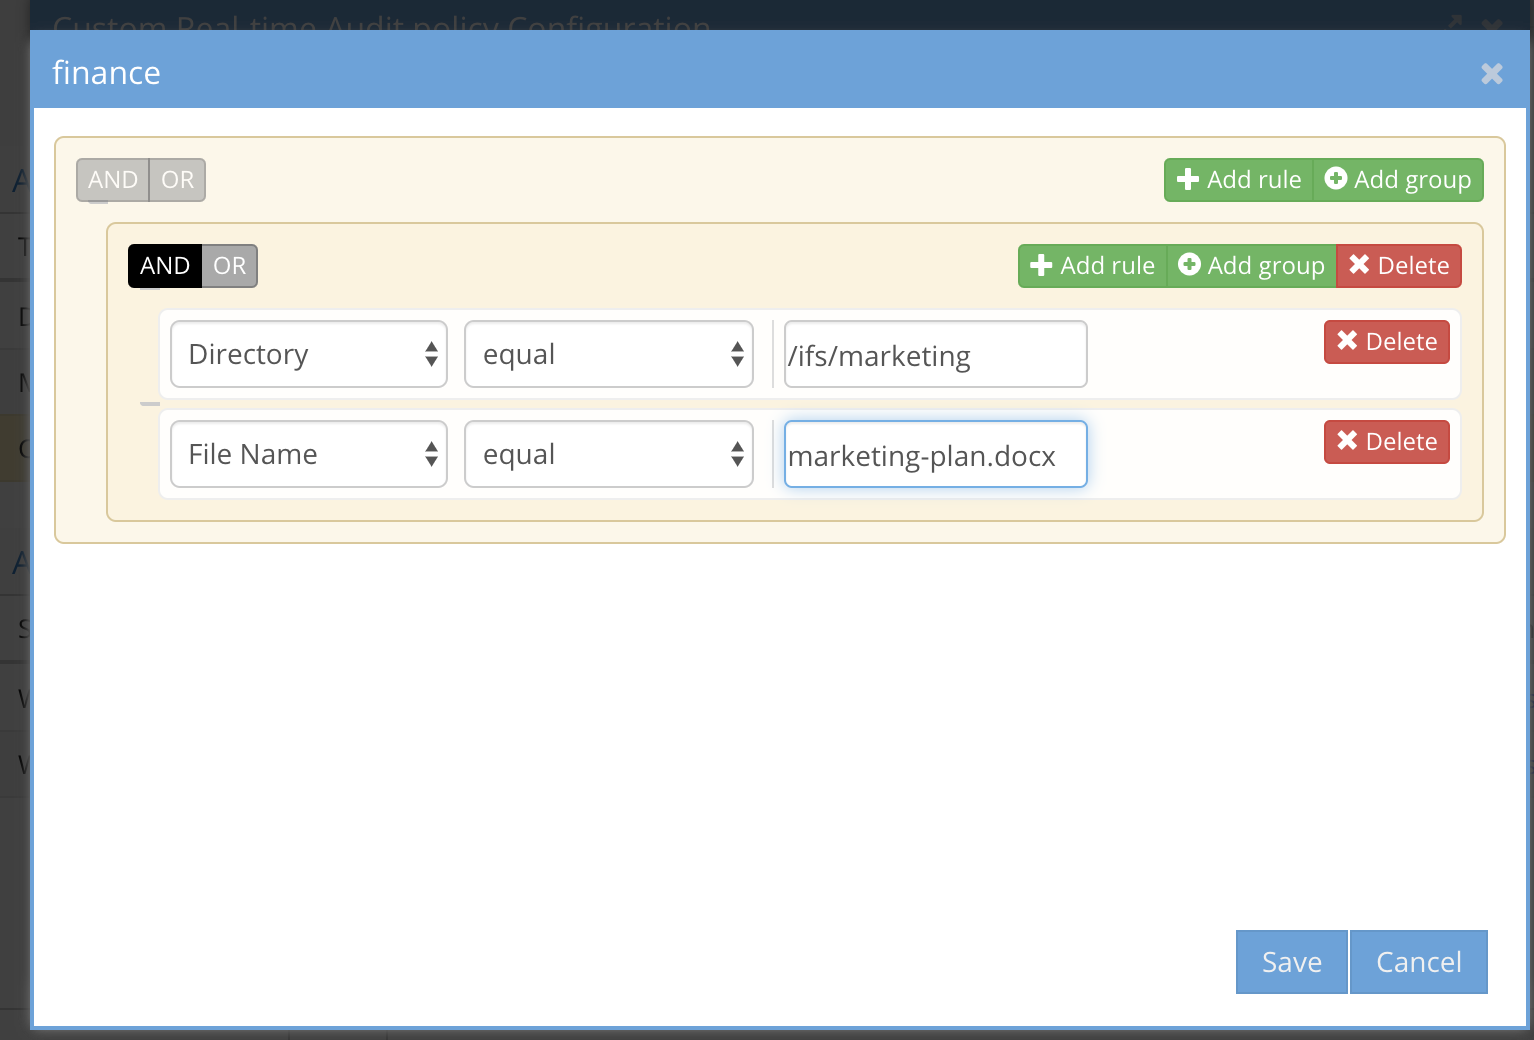
- Directory - the path where the event will occur example /ifs/data/zone1/marketing (Supported comparison options equal, not equal, contains, doesn't contain, ends with, doesn't end with, begins with, doesn't begin with)
- File name - the name of the file without regard for the path of the file example marketing-plan.docx (Supported comparison options equal, not equal, contains, doesn't contain, ends with, doesn't end with, begins with, doesn't begin with)
- Extension - just the extension of the file where the event will occur example pdf or docx (Supported comparision equals, does not equal)
-
Event Type - Create, Read, Write, Delete, Rename (Supported comparison equals)
- As of release 2.5.8.2 >. Directory delete, create, rename, login and ACL change are now supported
- User - the AD user (syntax MUST be DOMAIN\user upper case domain name) to monitor a single user (Supported comparision equals, does not equal)
- Cluster - the cluster name the event was generated from. This should only be used with multiple clusters that are managed by Easy Auditor (Supported comparison equals, does not equal)
- Source IP - The source ip or subnet range the event originated. example 192.168.1.80/32 for a single host or 192.168.1.0/24 to identify any host in the 255.255.255.0 subnet. (Supported comparison in, not in)
-
-
Using multiple conditions with AND and OR
- The simplest method to build criteria is using and or operands. For example, The file name AND user X, This directory OR user X
- Using the Grouping feature for policy criteria
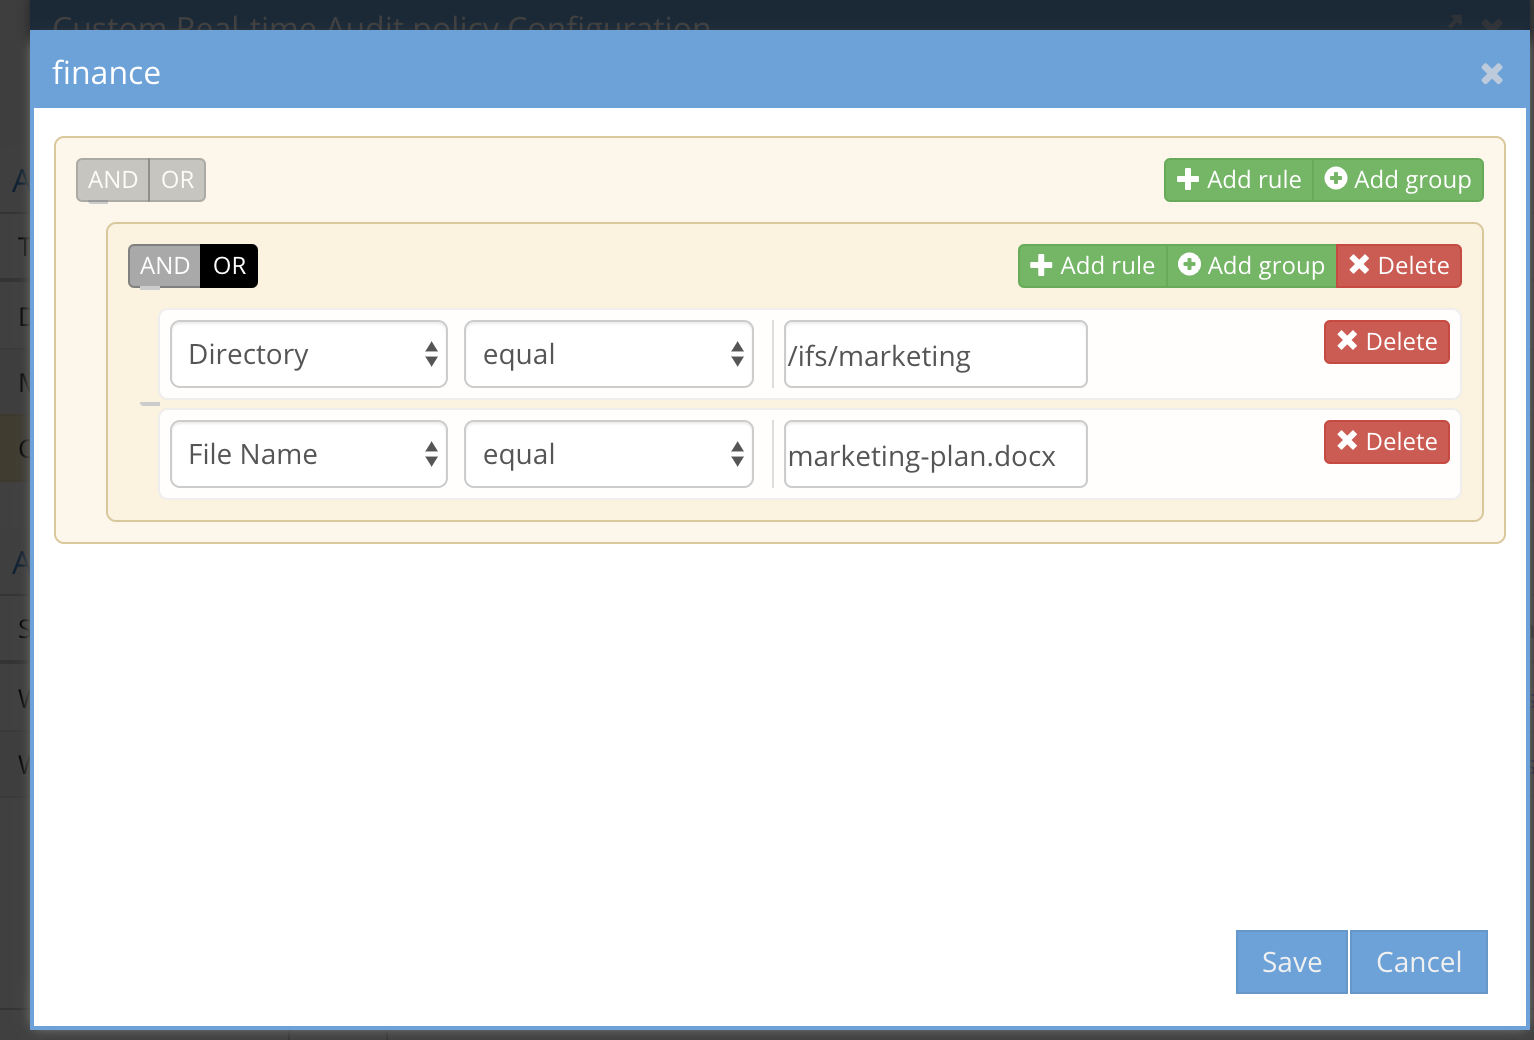
- This allows grouping several criteria together and selecting AND or OR for the group of criteria. example file name AND path MUST be seen during the unit value in minutes, OR means any of the criteria in the group need to have been seen within the Unit in minutes
- Complex combinations of individual criteria and groups. It is possible to combine a group plus individual criteria using the AND and OR operands within the group and between the group and individual criteria.
-
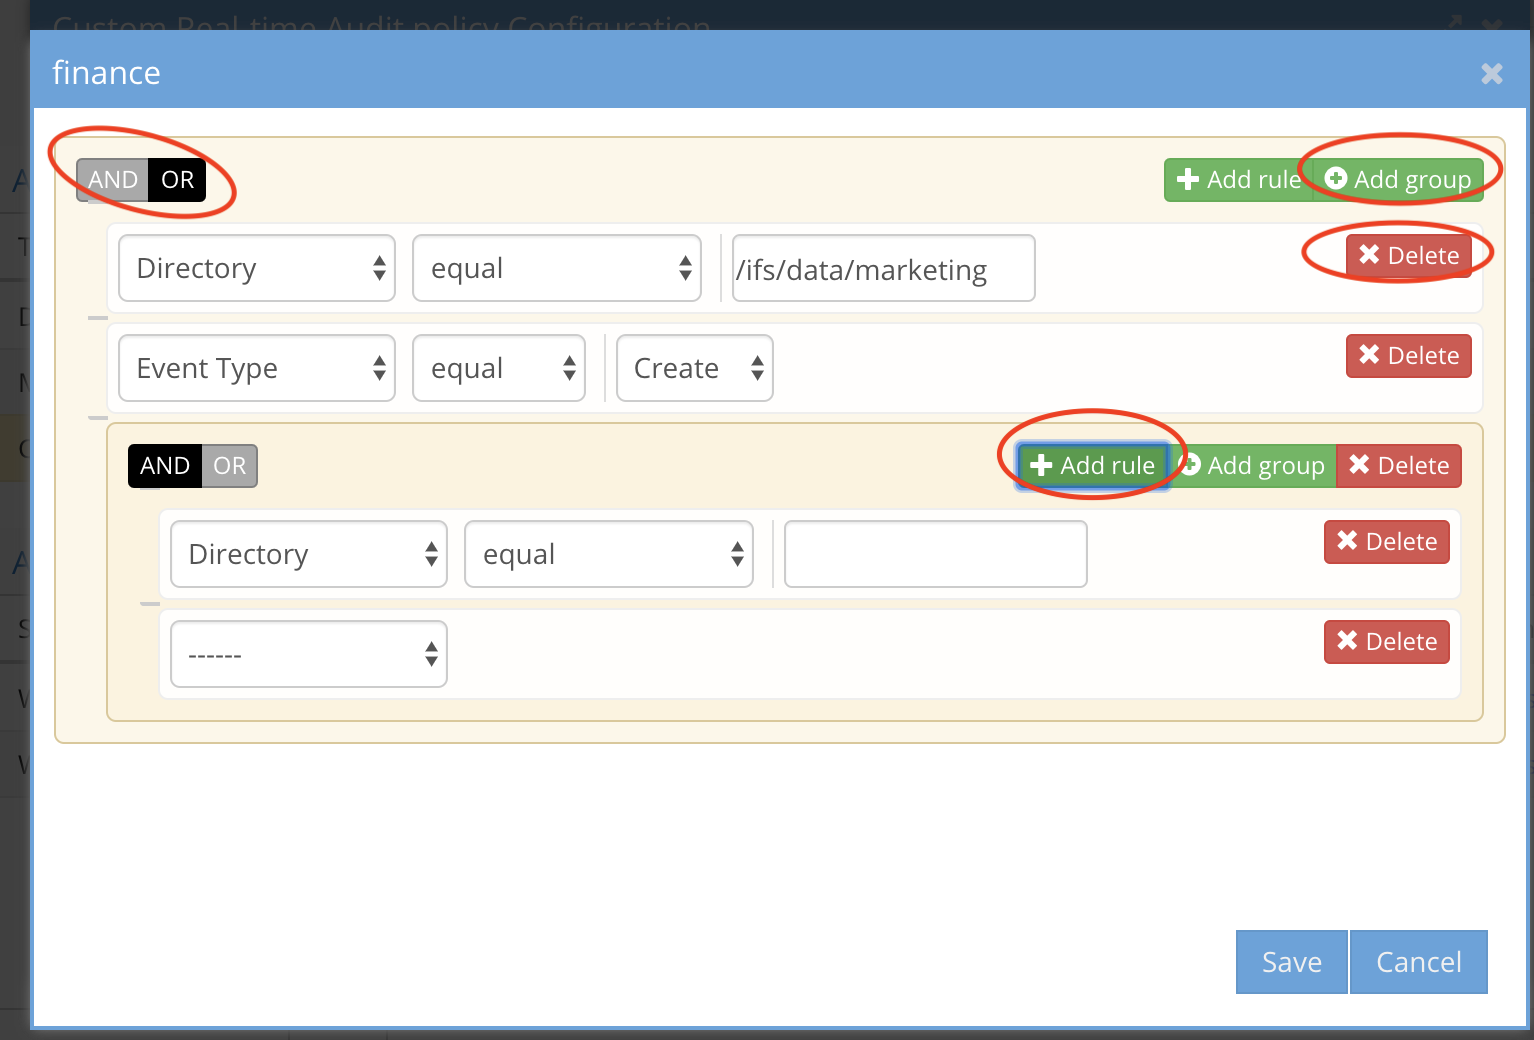
How the UI elements work for real-time audit policy rules
- The black selection indicates that AND or OR has been selected for rule criteria
- A Group has its own AND or OR operand selector for the group inside the group
- Delete a group or rule with the delete button next to the element you want to delete from the policy
- The gray bar on the left side of the UI indicates a separator between rules or groups and rules. This will indicate how the AND or OR will be evaluated .
- The + rule and + group icons are used to add a group or rule to the policy
-
UI Examples
-
-
Multiple individual rules using OR between rules
-
-
Multiple individual rules using AND between rules
-
-
A group of rules using AND between rules
-
-
A group of rules using OR between rules
-
-
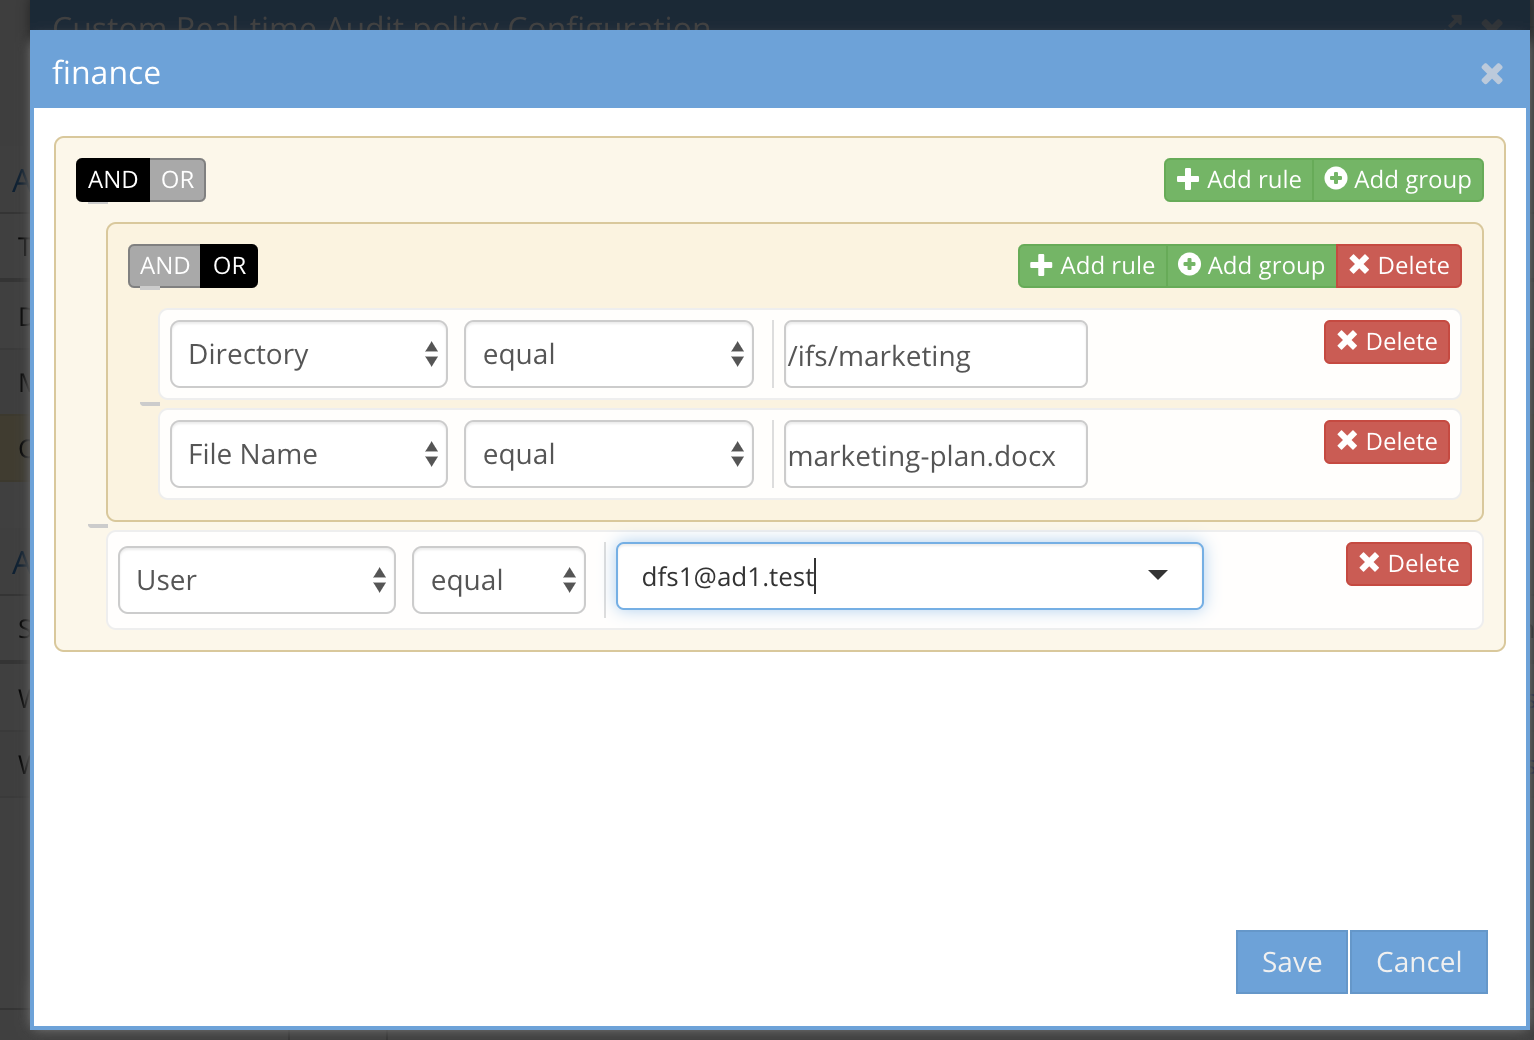
A group plus comparison to an individual rule using AND between the group rules and an AND between the group and single rule
-
-
- Save the definition of the policy to activate the rule. NOTE: the policy will be sent to the ECA immediately for processing events
Auditor Active Trigger Use Case Examples
This section covers how to use Active triggers to solve specific security monitoring use cases.
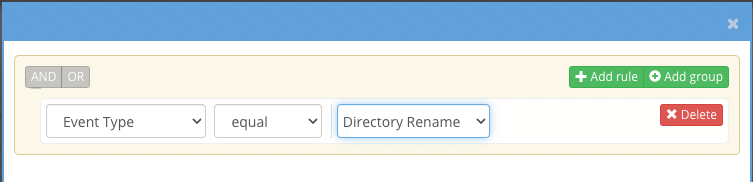
Directory Rename Realtime detection
- To monitor a path and all folders underneath for directory rename events to protect again an outage caused by users. Follow steps below
- Requirements: 2.5.8.2 or later
- Create a custom trigger and add event type with value set to directory renames
- Set the threshold value to 1 or more to see all rename triggers or increase the value to see a burst of changes within the time period.

- Save the name the event.
- Note the alert emails and syslog messages will contain the name of the trigger to be used by external tools
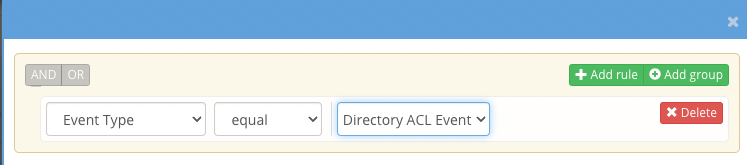
Directory or File ACL change Realtime Detection
- Users change ACL's and cause an outage, get notified in realtime. Follow steps below
- Requirements: 2.5.8.2 or later
- Create a custom trigger and add event type with value set to ACL (file or directory). Directory ACL is recommended.
- Set the threshold value to 1 or more to see all ACL triggers or increase the value to see a burst of changes within the time period.

- Save the name the event.
- Note the alert emails and syslog messages will contain the name of the trigger to be used by external tools
Login Realtime Detection
- Monitor a user login behaviour with real time notifications. Follow steps below
- Requirements: 2.5.8.2 or later
- Create a custom trigger and add event type with value set to login
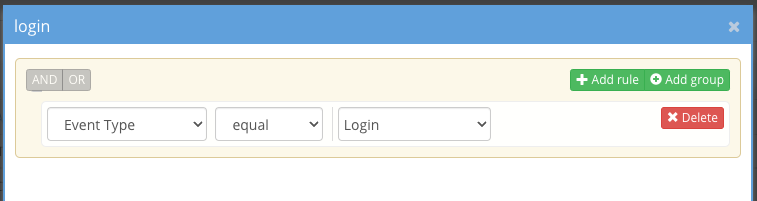 .
. - Set the threshold value to 1 or more to see all login triggers or increase the value to see a burst of logins within the time period.
- Save the name the event.
- Note the alert emails and syslog messages will contain the name of the trigger to be used by external tools
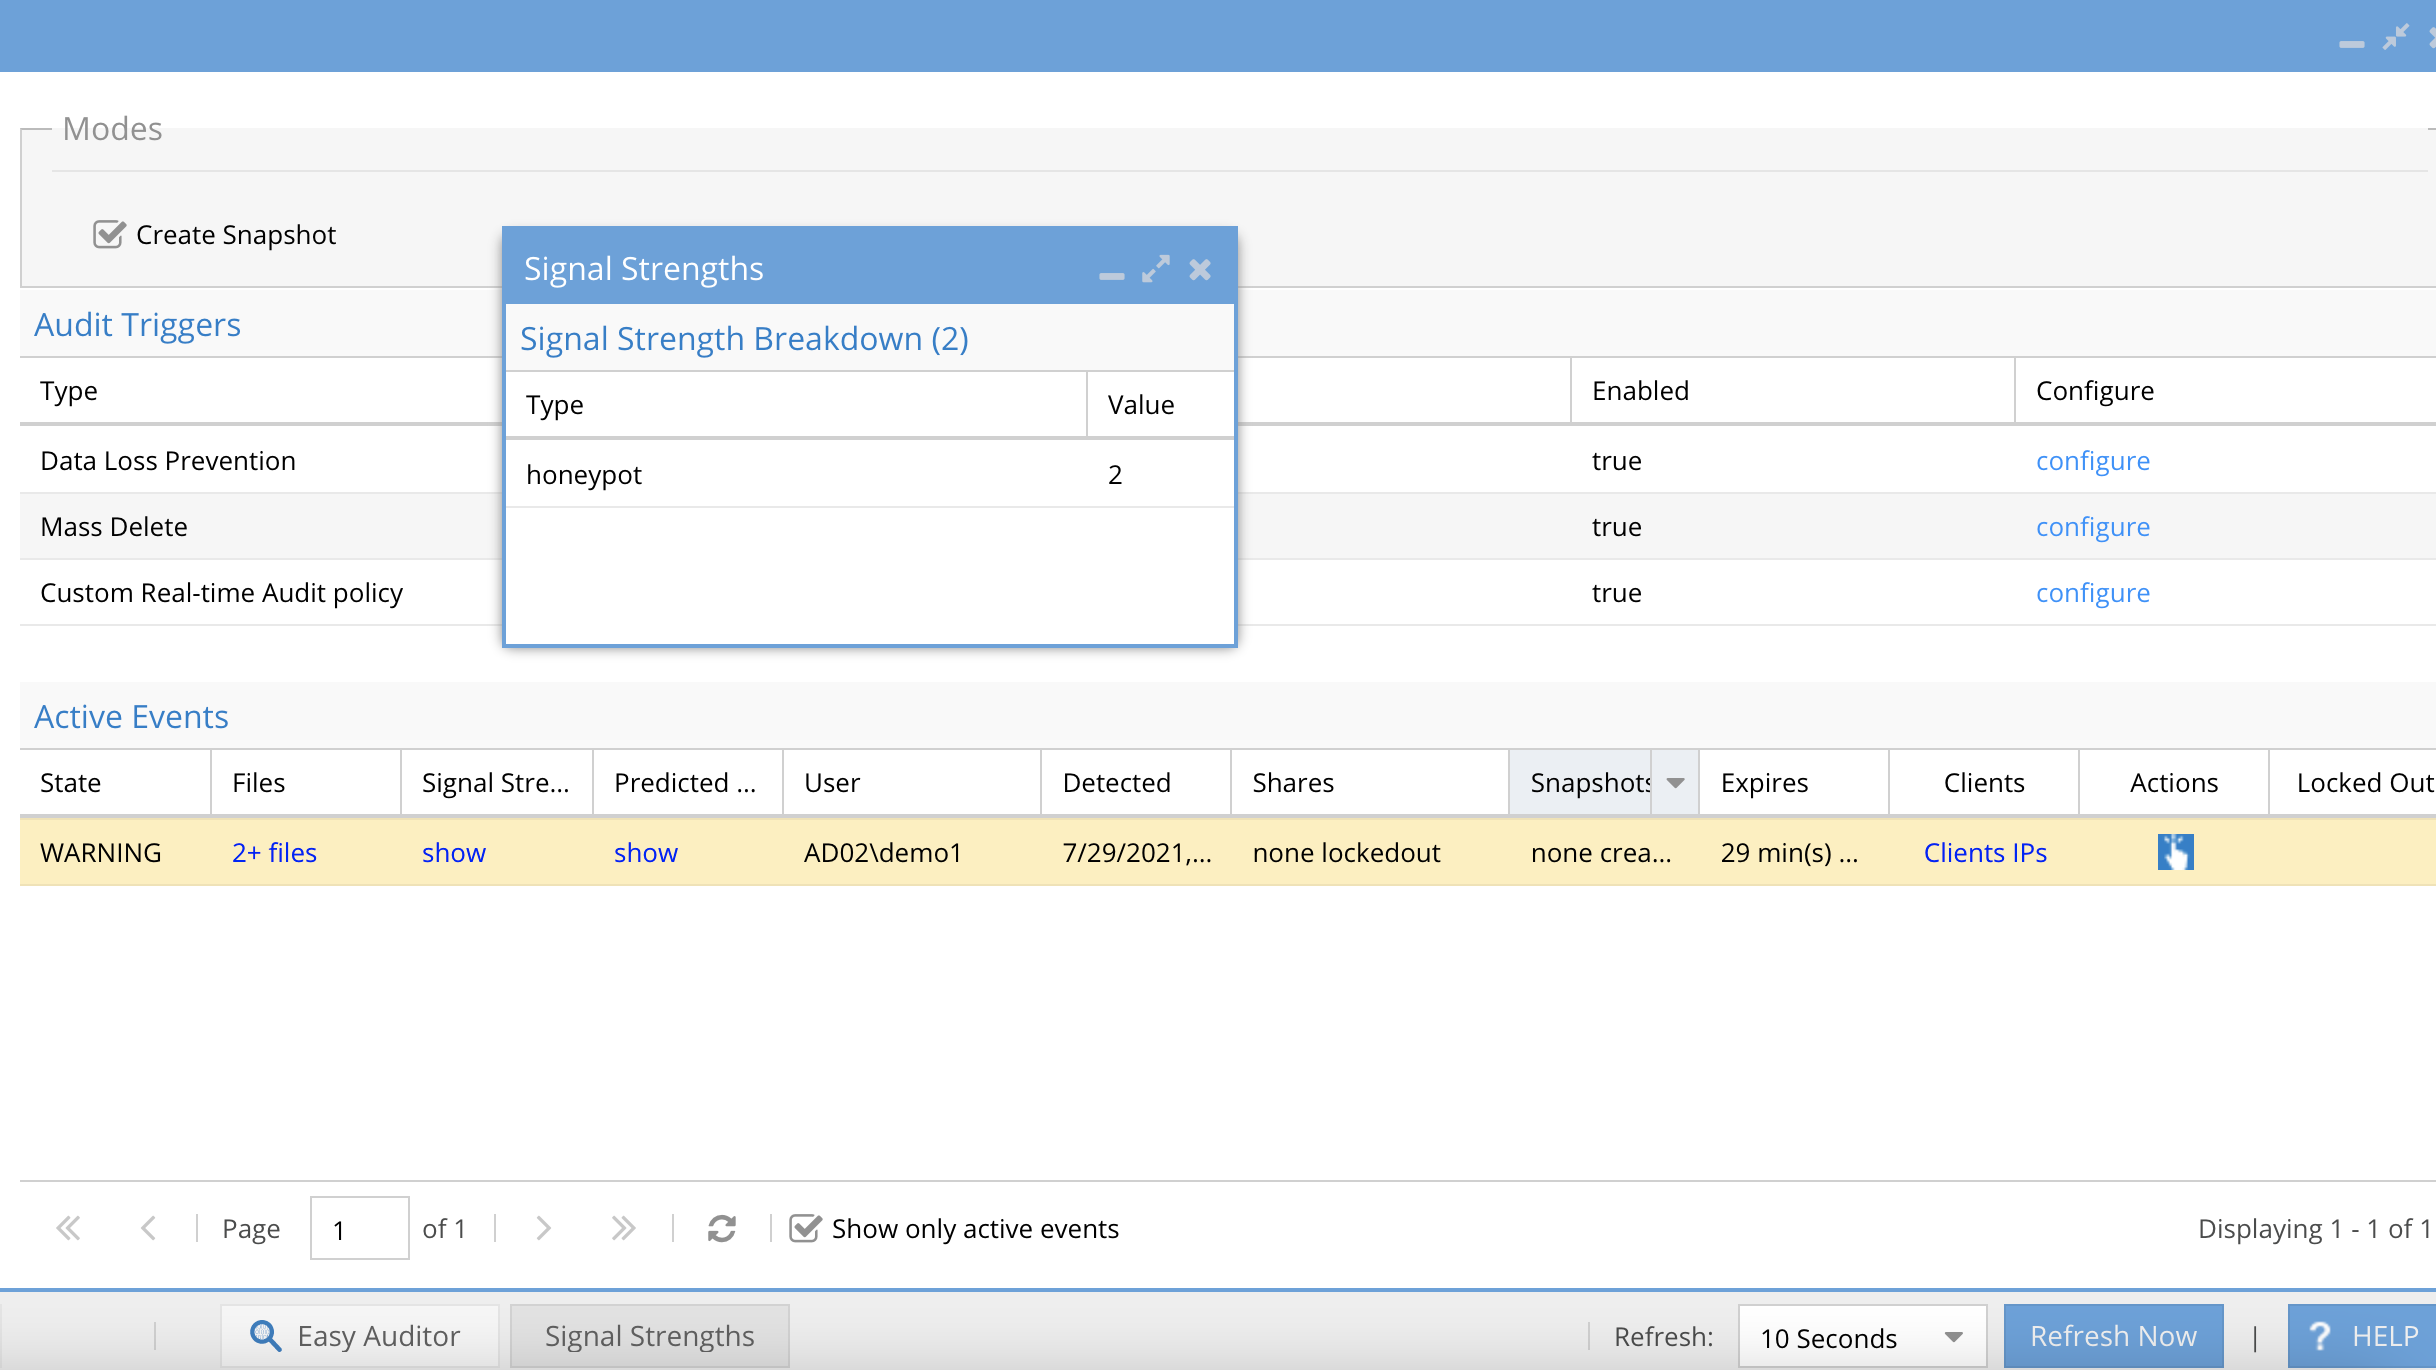
HoneyPot Detection
- This provides a method to create a honeypot SMB share to detect an insider threat looking for open shares to read data.
- Create an SMB share with everyone full control with a name that may attract someone looking around the network for open sharers. Add fake file names that look like sensitive data.
- example SMB share named - finance on path /ifs/data/honeypot/finance
- Open Easy Auditor Active Triggers section and add a custom trigger as per screenshot. Then click the view edit button.
- Use the rule editor to add the path to the trigger in this example /ifs/data/honeypot/finance and click save.
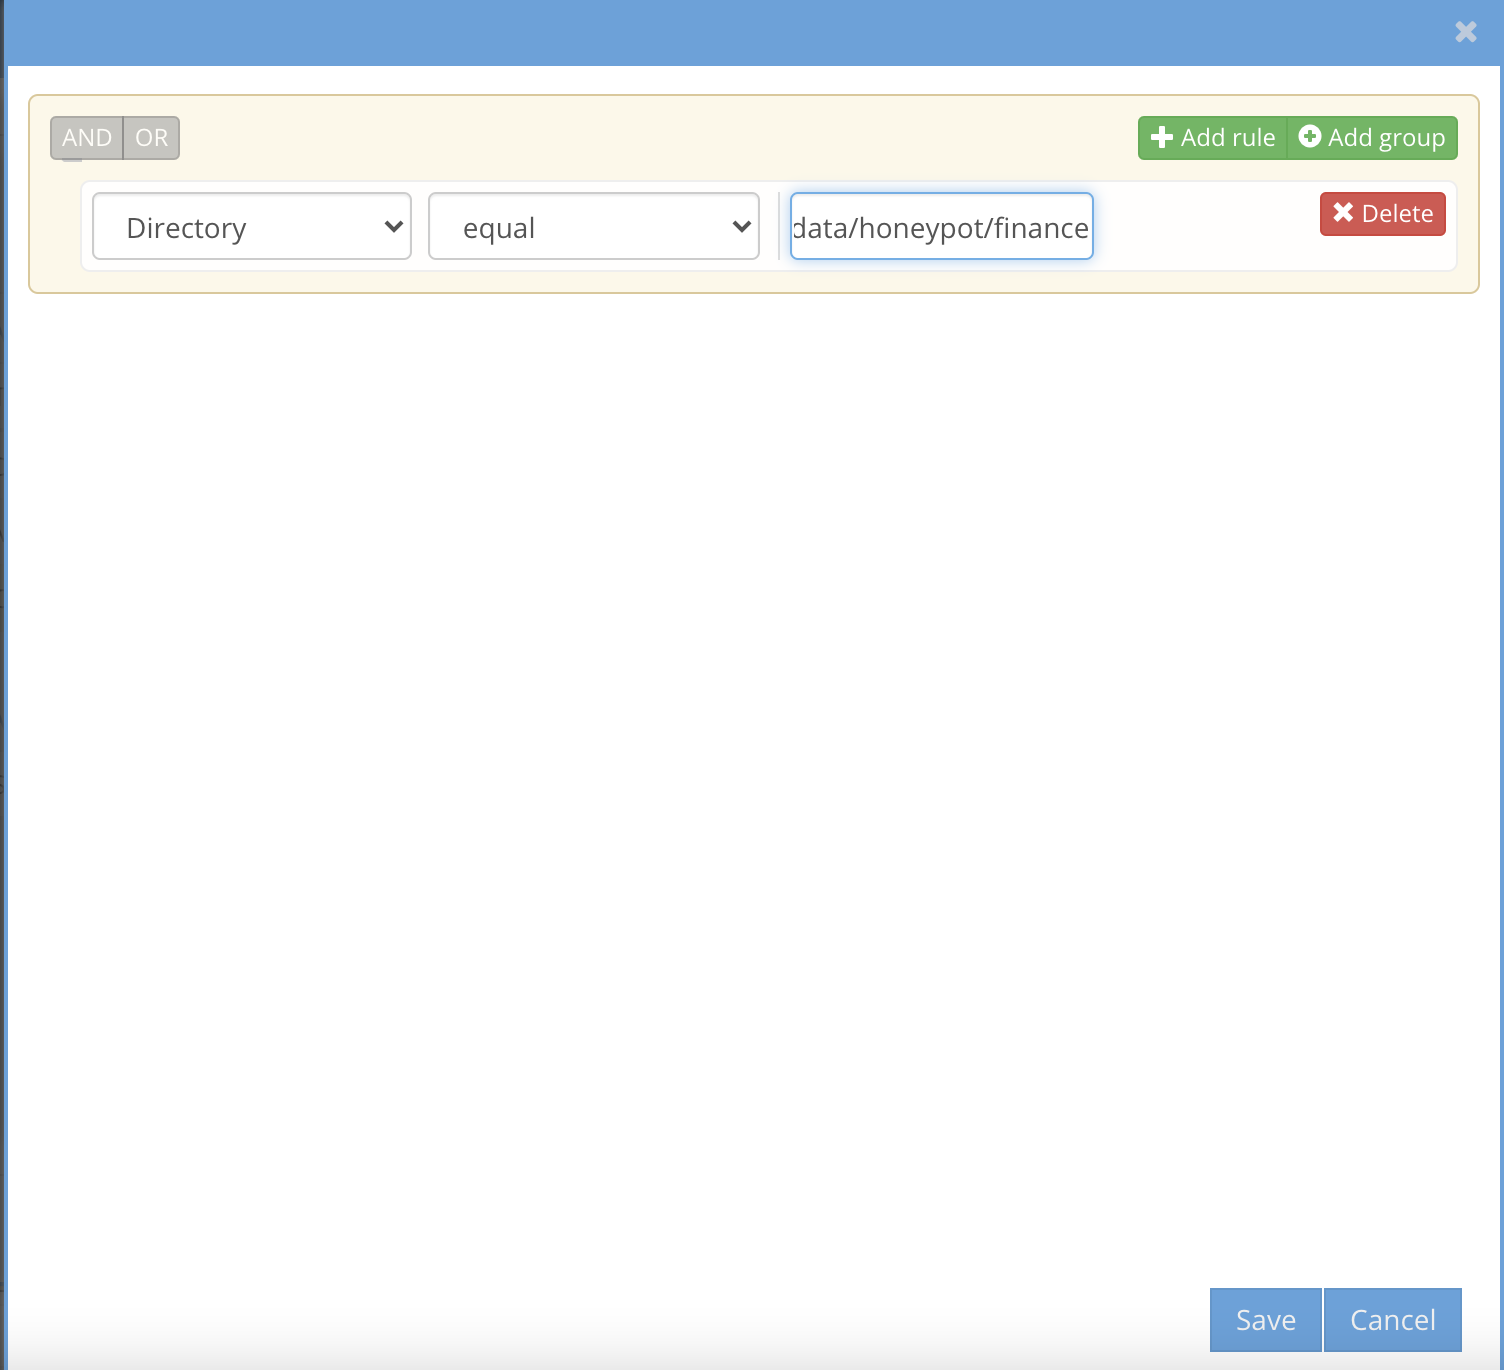
- Now click Save to save the trigger definition.
- Test the trigger by accessing files on the share. A detection will look like below.
How to configure Mass Delete protection
Overview:
Monitors users deleting files on any share or export up to administrator defined threshold over administrator defined time period. The feature counts deletes by user using the ECA cluster real-time detectors and raises an alert when the policy is violated. The protection option to snapshot SMB shares will create snapshots assuming this user may be destroying data. The snapshot option can be disabled providing alerting only through email or syslog forwarding.
- Provide visibility into delete actions on the file system before user cases are opened regarding deleted files.
- Simplifies recovery of accidental deletes from auto applied snapshots
- Provides security monitoring of deleted fails in real-time
- Auto detects all SMB shares of the trigger user and creates snapshots on all SMB shares the user has access.
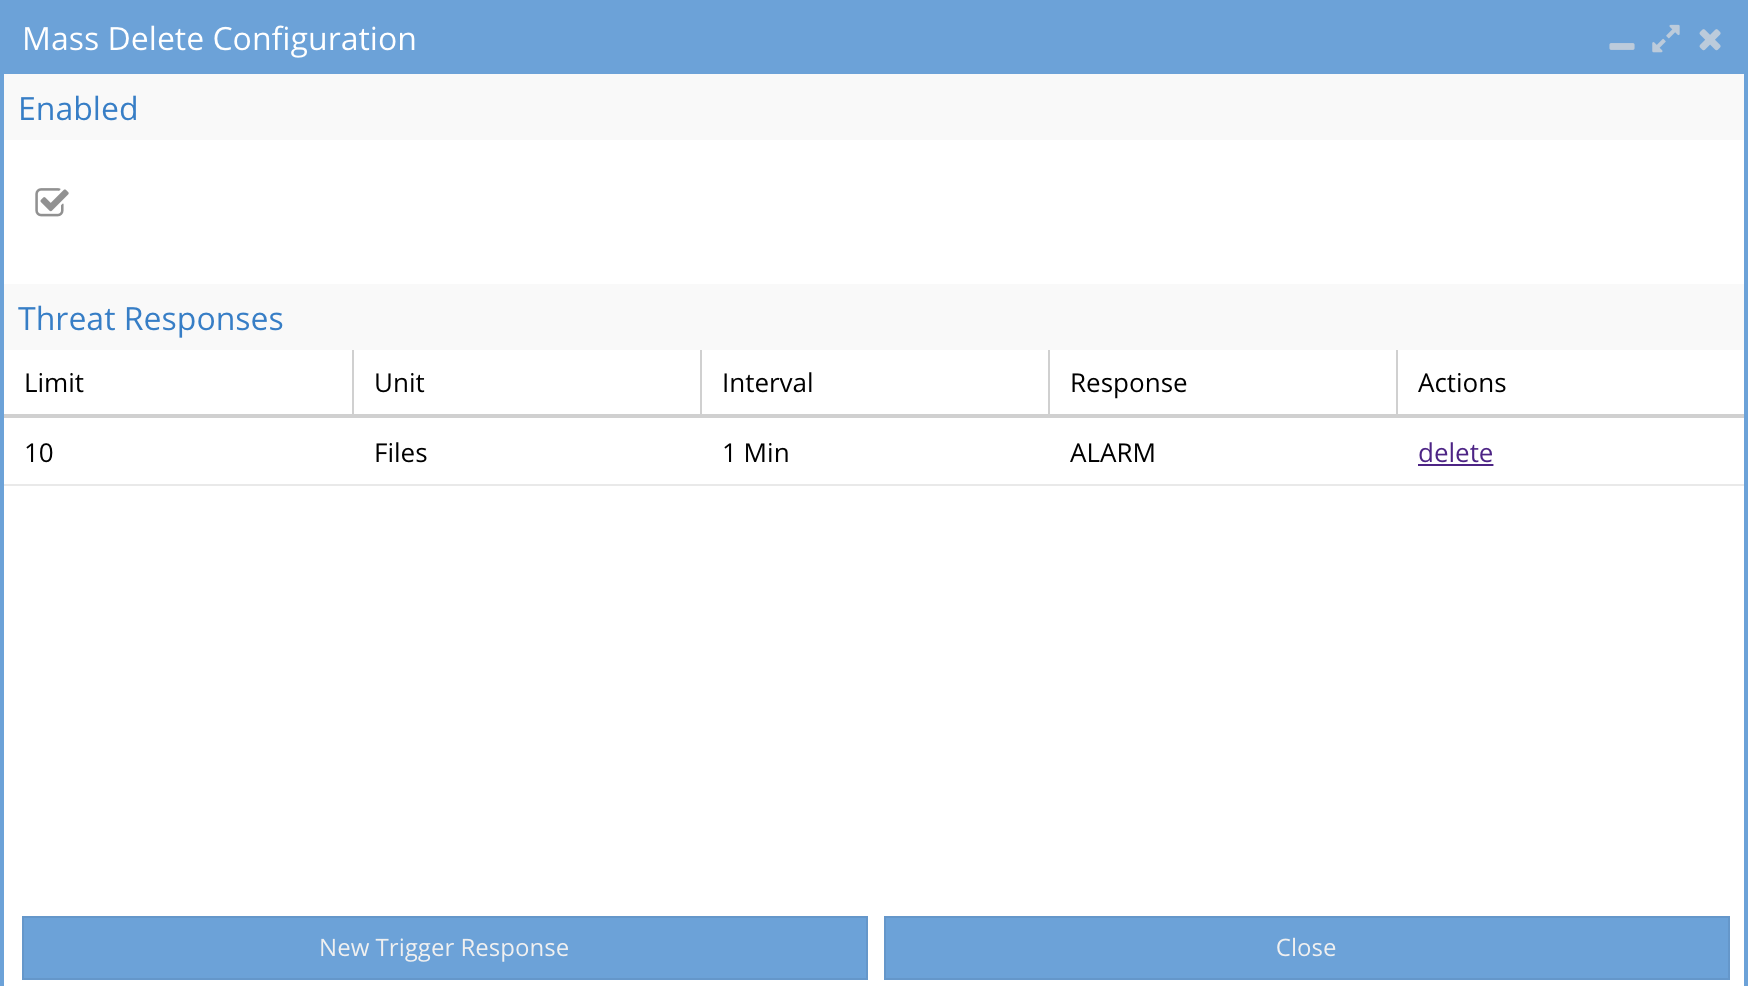
- Click Configure
- Enable the audit feature
- Click New Response to create policy to set one or more responses to crossing a file delete threshold per user.
-
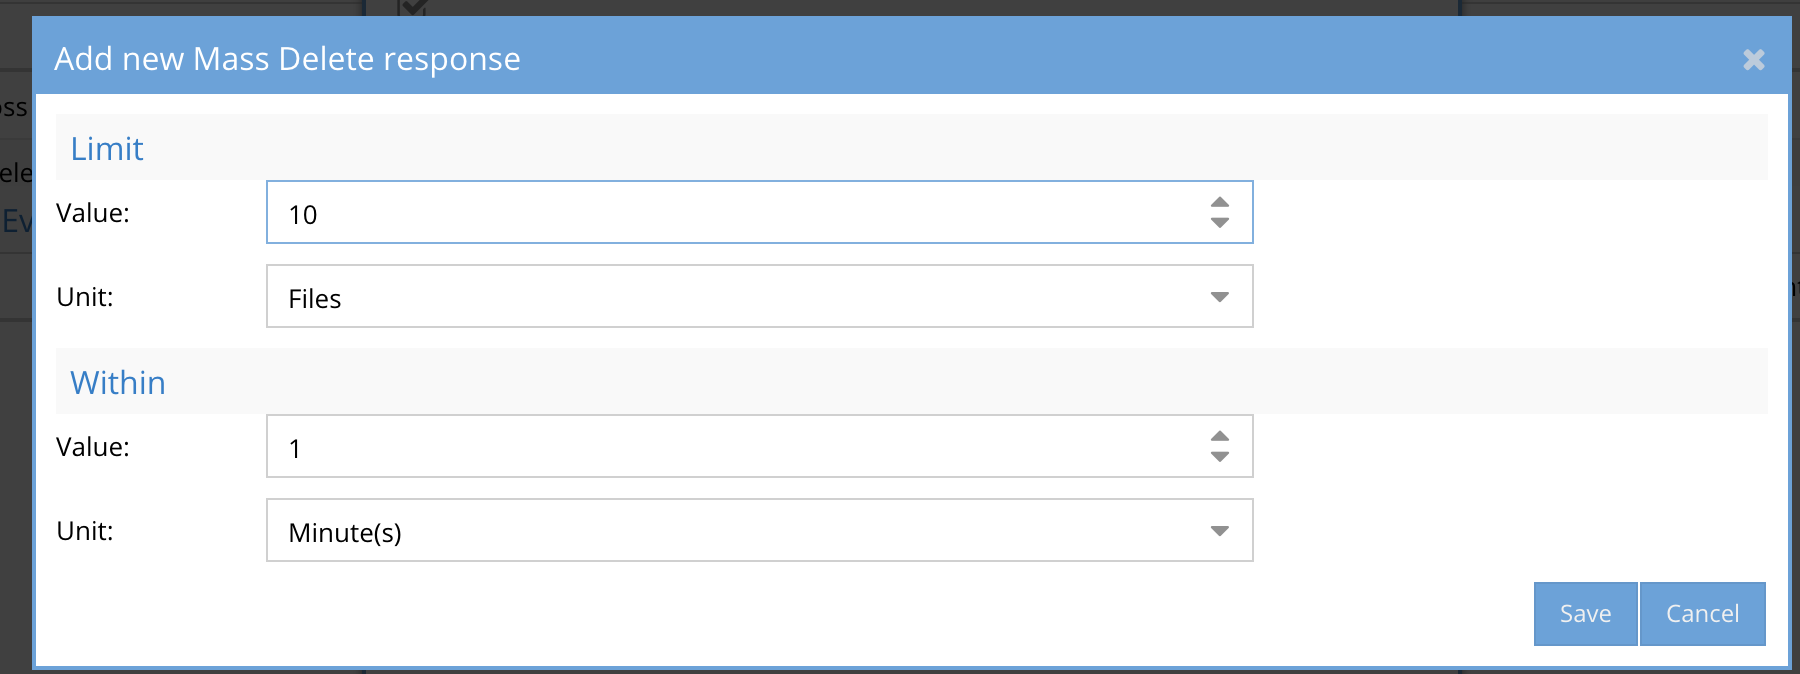
- Threshold for number of files to be deleted. NOTE minimum value is 1000 within 1 minute, the time period cannot be changed in this release
- Best Practice: 1000 files to start and adjust higher if too many notifications are sent.
- Time period of which the deletes should occur within.
- Best Practice: The rate at which deletes occur does not change the severity of the delete. The goal is to set at a rate that detects many deletes in a short period of time. This value can be adjusted up or down depending on the number of notifications that are sent.
- Possible Automated Responses Actions:
- Email alert - Sends an alert of the user, path and crossing of the policy criteria
- Snapshot the path(s) being deleted to provide a restore point. The snapshot has a time to live of 48 hours be default and will be applied to all SMB share paths the user has access to based on SMB share level permissions.
-
Possible Actions on an Active event
- User Lockout If selected the user that trips this trigger will have SMB access denied on the first share above the path being monitored.
- Best Practice: Enable both email alert and snapshot response for mass delete.
- Click close
How to configure Data Loss Prevention
Overview:
Monitors users copying files on any secure share or path. This assists with real-time monitoring of secured data from bulk copy operations that are not authorized or indication of potential data loss scenario. The feature will monitor the capacity of the file system path, using an auto applied accounting quota and allows administrator to set % of the data any user can read from the path before the audit trigger is detected.
- Automatically monitors secure data access by users
- Alerts administrators of access by user with date, time, ip address of the access
- Protects against bulk copy of secure data
- Provides visibility into user data access
- Proactive security measure to simply auditing of secure data.
- Secures sensitive data from insider threats
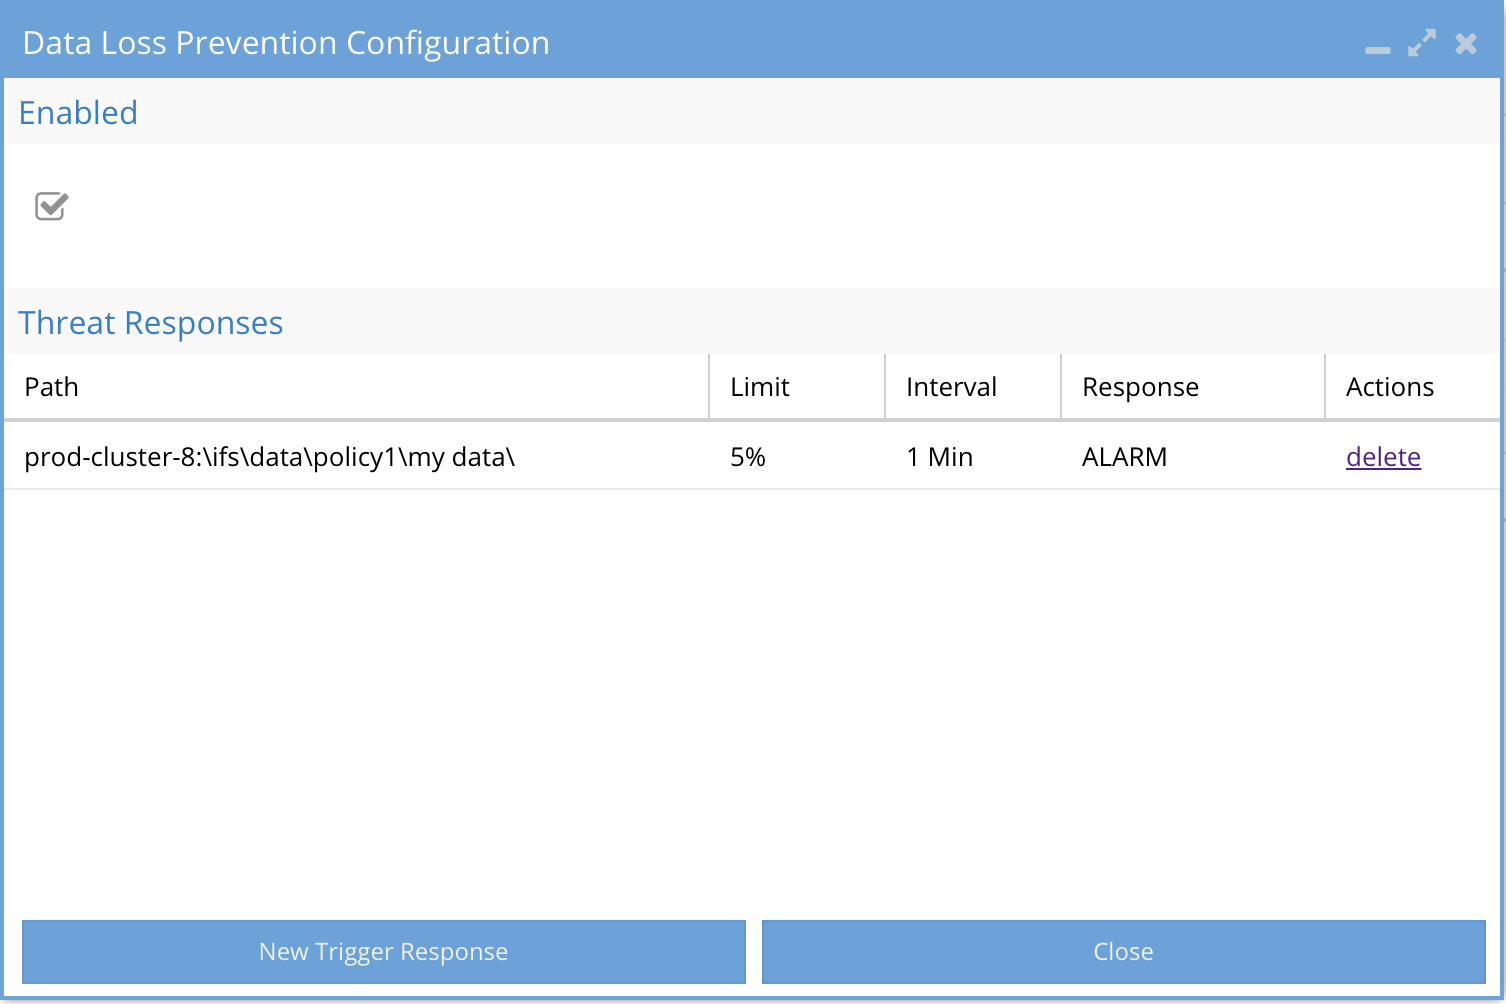
- Click Configure button on main active auditor screen
- Enable the audit feature
- Click New Response to Create policy to set per user response actions when crossing data copy % threshold of the total data on the file system path.
-
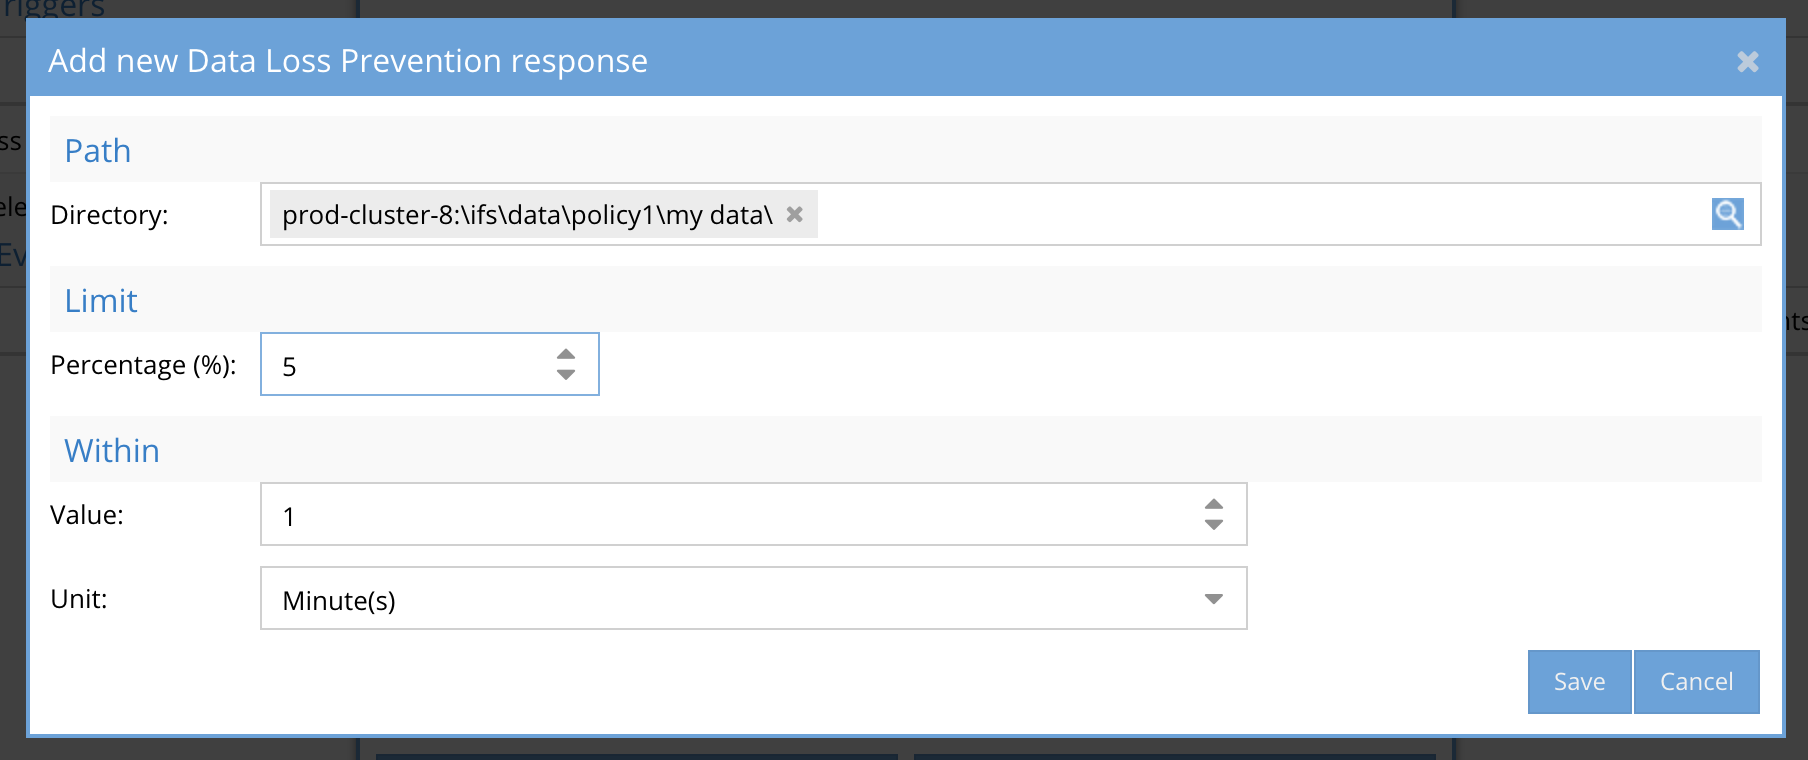
- Enter the path in the file system to monitor. Best Practise: Enter a path equal to a share path being monitored.
- Threshold % -user the slider bar to select
- Best Practice: 10% is a good starting point to catch copy actions by users. NOTE: in this release minutes is not selectable and defaults to 1 minute
- Time period over which the copy will cross the threshold.
- Best Practice: The rate at which copying occurs can affect the trigger detection. The goal is to set at a time period low enough to ensure the threshold is crossed. This value can be adjusted up or down depending on results of trigger testing.
-
Possible Response Actions:
- Email alert - Sends an alert of the user, path and crossing of the policy criteria
- User Lockout If selected the user that trips this trigger will have SMB access denied on the first share above the path being monitored.
- Best Practice: Enable both email alert and snapshot response for mass delete.
- Click close
How to manage Active Auditor Events
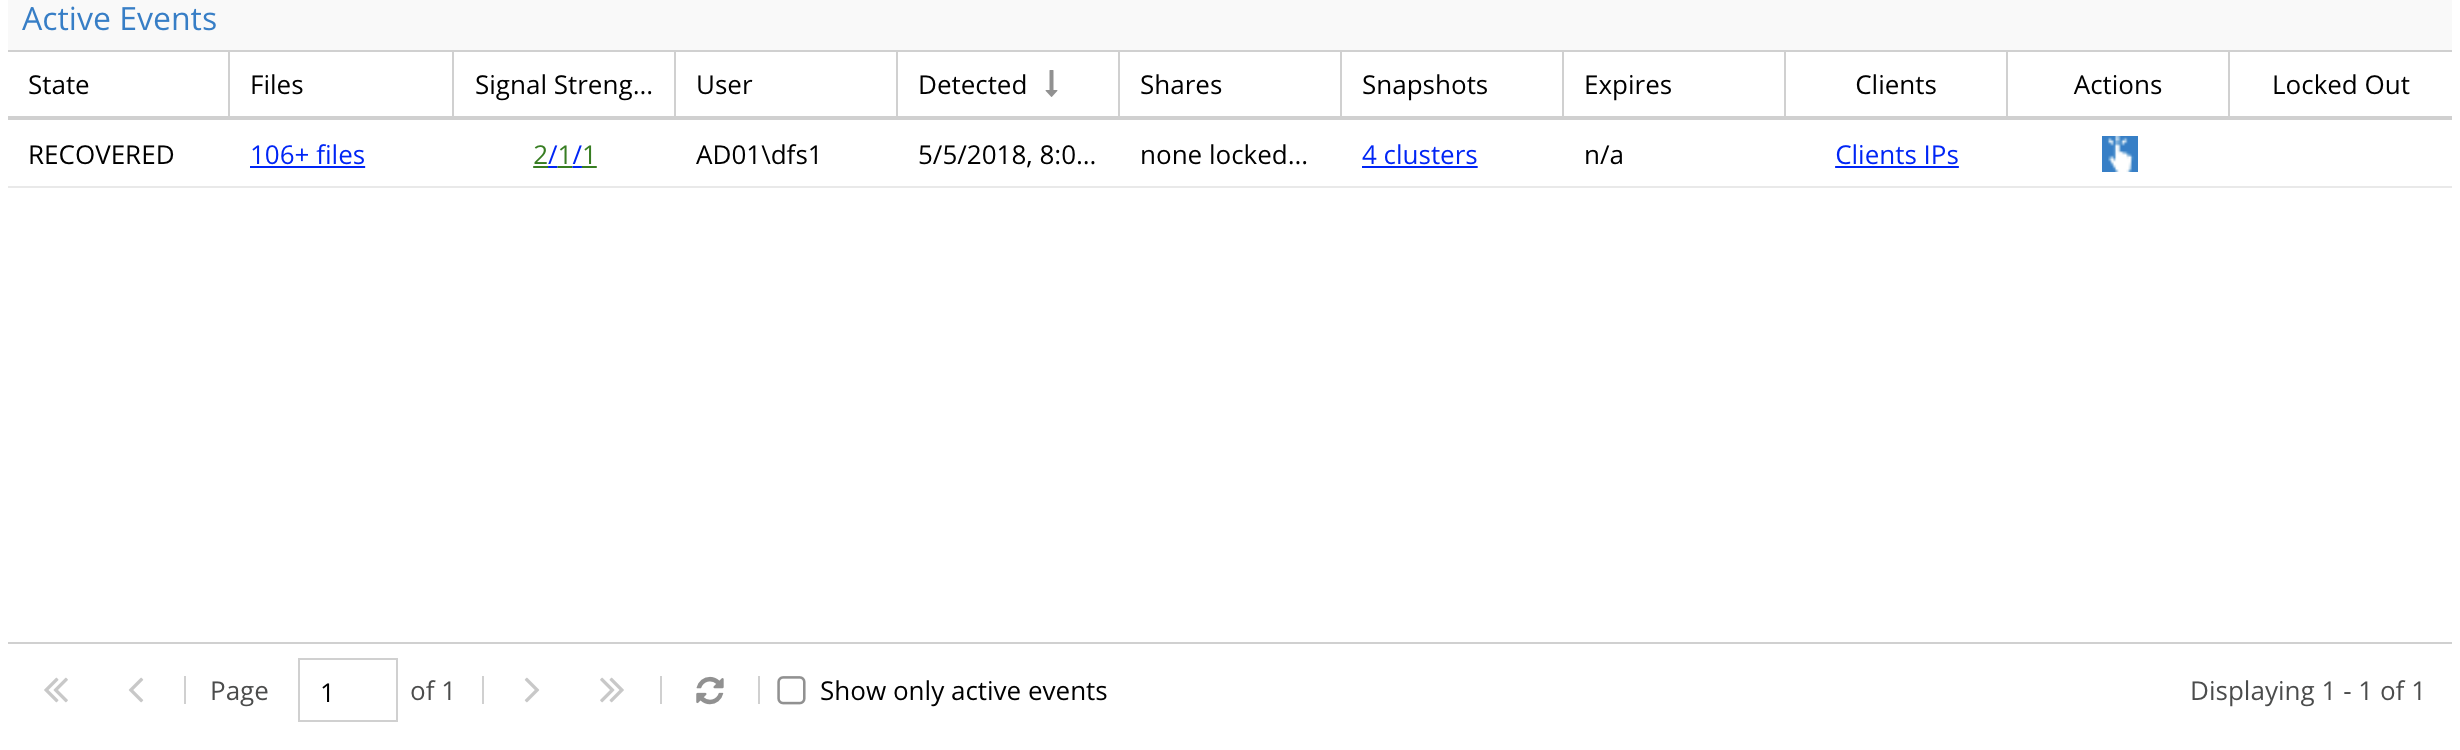
When Mass delete or Data Loss prevention events are detected the following options are available per incident. When a user has an entry in the active events any triggered event will be added to the same active event. An active event will stay active until acknowledge (action menu) and can be mark as recovered status (action menu).
An active event has the following information:

- State of the security event
- List of files that tripped the detector
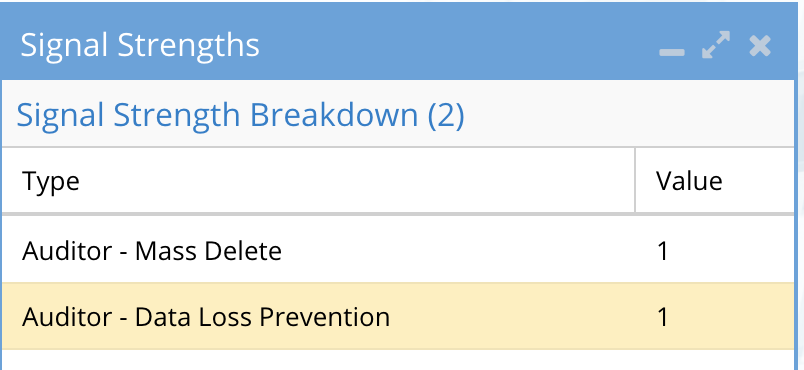
- Signal Strength lists the active audit detectors that have been detected for this user ID. In this example both detectors have been tripped for this user.
-
- User id column is the AD user name
- Detection date and time
- Share lockout list (if action menu is used to lockout, the list of shares will be listed here)
- Snapshot names (if snapshot check box is enabled, Mass Delete and Data loss Prevention triggers will automatically snapshot shares the user has access to based on AD group membership
- Expiry minutes - How long before the timer on a detection will trigger secondary actions. No secondary actions are defined in this release.
- Client ip address - This is the source ip of the machine the user was logged into.
- Action Menu provides a list of actions for this security event.
- Lockout column indicates if the user account has had lockout applied. that will deny the user access to all shares the have access to.
- If the action menu lockout action is applied to the user id. The event is updated. See sample image showing lockout date and time along with a list of shares that have had the lockout applied.
-
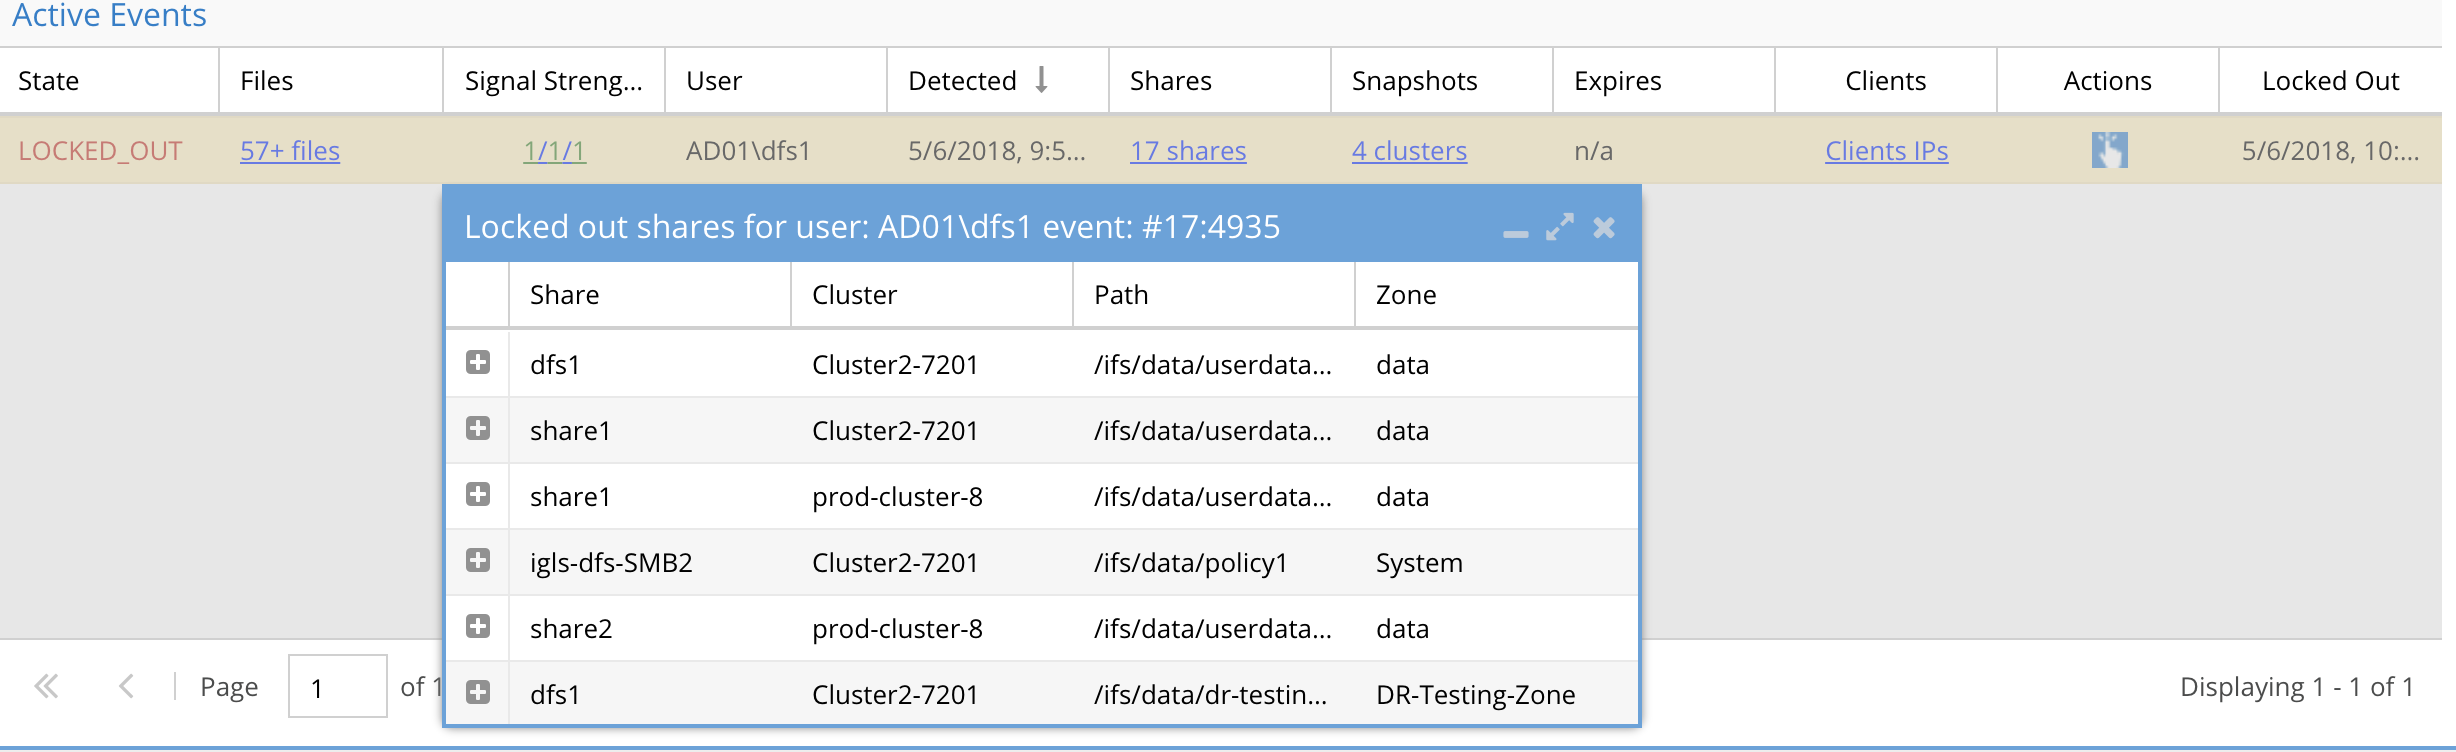
- The state of the event is changed to Locked Out
- To remove the lockout use the action menu. "Restore User Access"
-

Actions available to Manage Active Auditor Events
An event has several possible actions that can be applied, lockout user, create snapshot, acknowledge, comment and flag as false positive
- Click the action button for an active event.
-
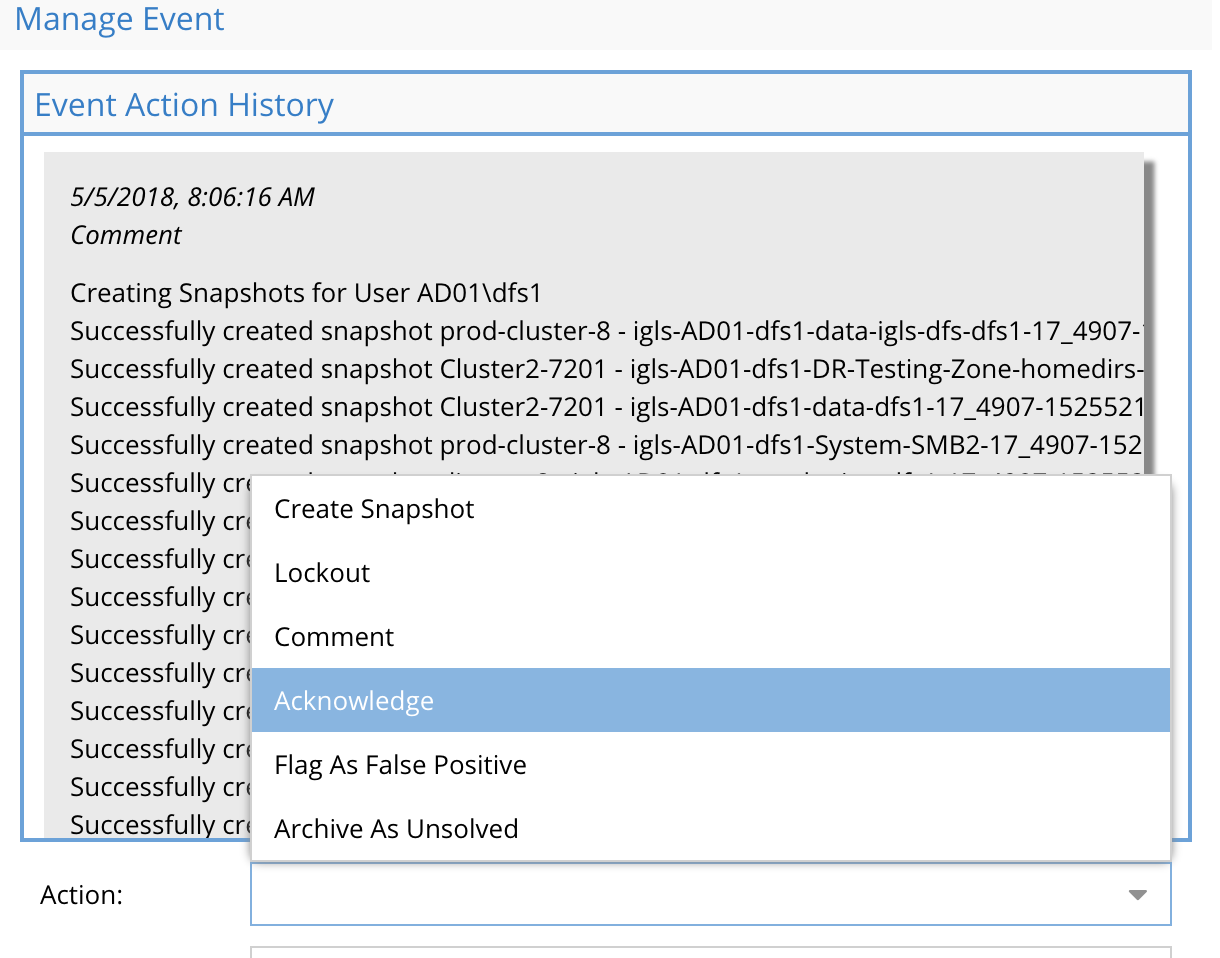
- Comment - add comment to the event for other administrators to see and store with the event when archived
- Create Snapshot - only required if auto snapshot is disabled
- Lockout - apply deny read to All shares the use has access to mount
- Acknowledge - set status to show the event has been reviewed. Other administrators will know this event has been looked at.
- Archive as unsolved - No follow up or issue was caused by the event after reviewing the details of the event. The event can be archived using this option
- Flag as false positive - In cases where the default trigger settings detect an event with too low a threshold , this option sets an override for the specific user id to not trip detection and sets a custom threshold for this single user. Consider changing the detector settings if too many false positives.
-
How to Archive an active auditor event
To archive an event after all follow up has been completed follow these steps.
- Determine if any action is required and apply as required. See above action options described above.
- To clear an event from the active list and move to the historical list.
- Use the action menu and apply the acknowledge event action.
- Or use the action menu and apply the Archive As Unsolved. (this would be used if no follow up is done on the event and you want to archive without any investigation)
- Then apply the Action Mark as Recovered
- The event will disappear from the active list. See below how to see historical events.
How to Display active auditor historical events
- Click the active auditor tab
- Uncheck the "Show active events"
-
- Done
WireTap
This feature is a tool to allow security admins and auditors to easily look at a sequence of events by one or more user actions in the file system to build a complete picture of what happened.
|
|
NOTE: Due to event rates and system load only 2 Wiretap filters can be created at a time. If a 3rd wiretap is required one of the existing Wiretaps must be deleted first. NOTE: Wiretap will only output 25 events per second even if the path or user event rate is higher. The sampled events should provide enough to view the file actions without overloading the UI at rate that cannot be viewed in real time. This also means that some events will be dropped to meet the event rate, this is expected behavior to allow visualization of events as they happen. NOTE: If the event rate is high on the monitored path the browser requires sufficient RAM and cpu to process the audit data stream. If the browser seems slow or unresponsive you do not have a fast enough pc. You should filter the events to display fewer events. |
The feature relies on the real-time processing of audit events managed by the ECA cluster to decode and stream audit data to Eyeglass wiretap UI.
- The feature allows wiretapping a path in the file system to monitor multiple users accessing data in a specific path in the file system or monitor a user anywhere on the file system.
- A folder can be monitored or all sub folders, file or directory events can be added to a filter to reduce information shown in the UI. Adding a user name will filter all data by user or leave it blank for any user IO on the path.
- NOTE: For high rate paths the data is rate limited to 25 events per second and some events maybe dropped. The browser cannot receive data at higher rates and the scroll rate is also too fast to see the events.
- NOTE: defining a wiretap session the ECA cluster is monitoring for events that match the wiretap. The events are only forwarded to Eyeglass when the wiretap watch window is open.
How to Configure Wiretap
-
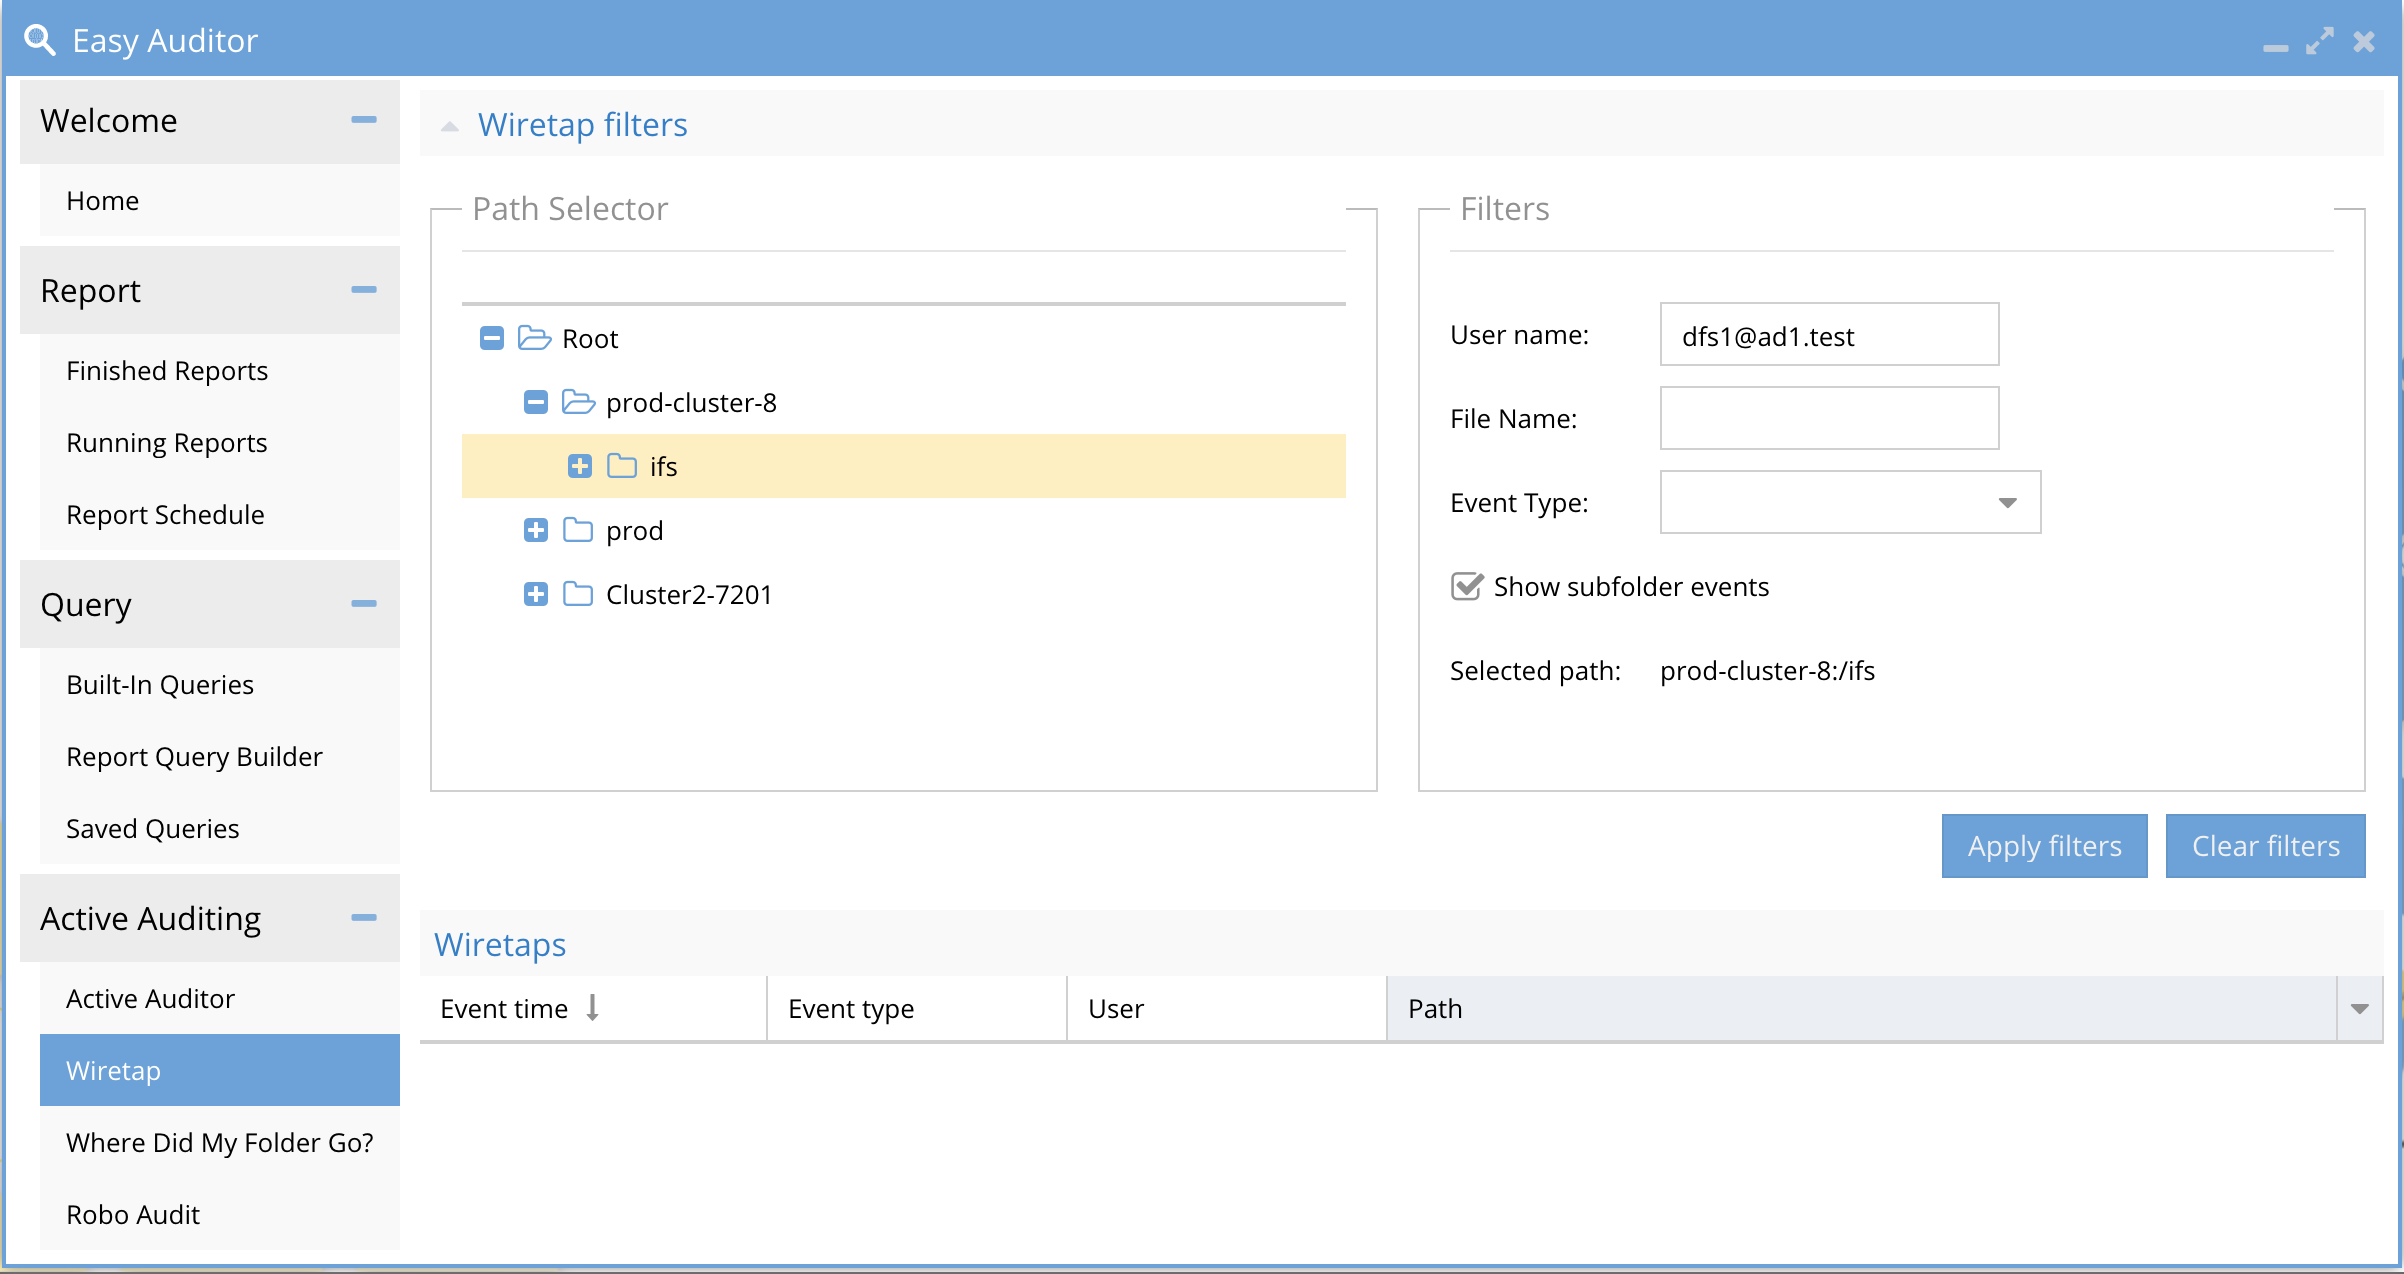
- Browse the cluster paths to select a path
- Click sub folders events or disable this to reduce the event rate
- Enter a user id or leave blank to see events from all users
- Enter a file name to filter IO on a specific file in the folder
- Click Apply Filters. This will trigger a message to the ECA to filter events for Wiretap. It may take several seconds for events to appear in the UI.
- Click clear Filters to remove all settings from the ECA.
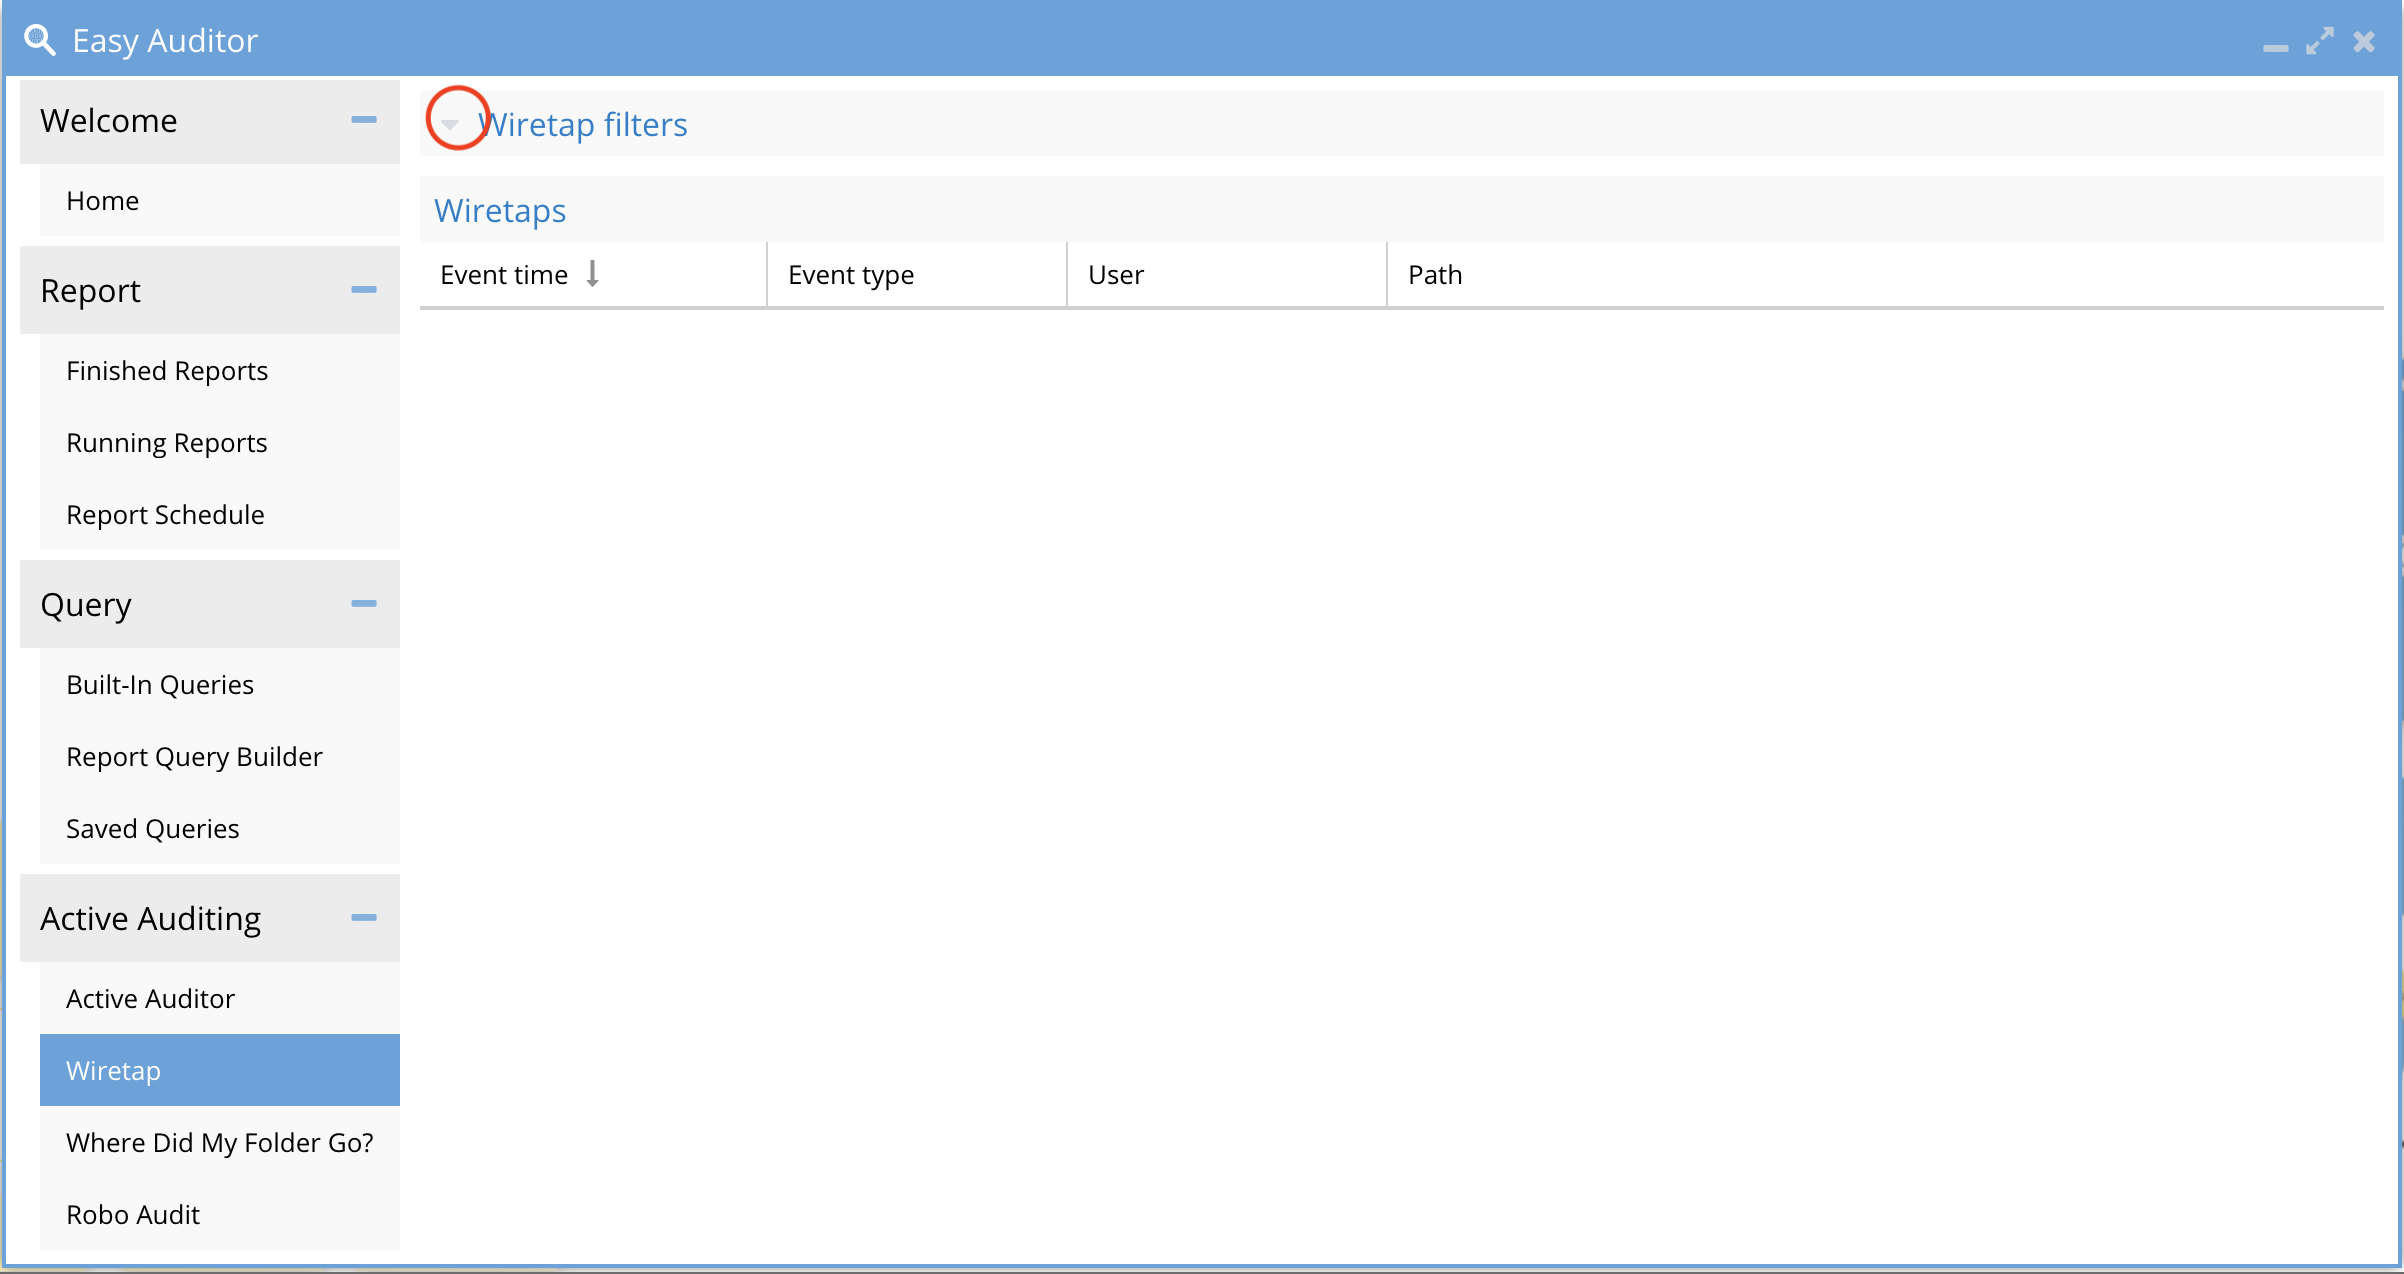
- To Hide the filter UI and get more screen space to see events click the upper arrow to hide or show the filter UI.
-
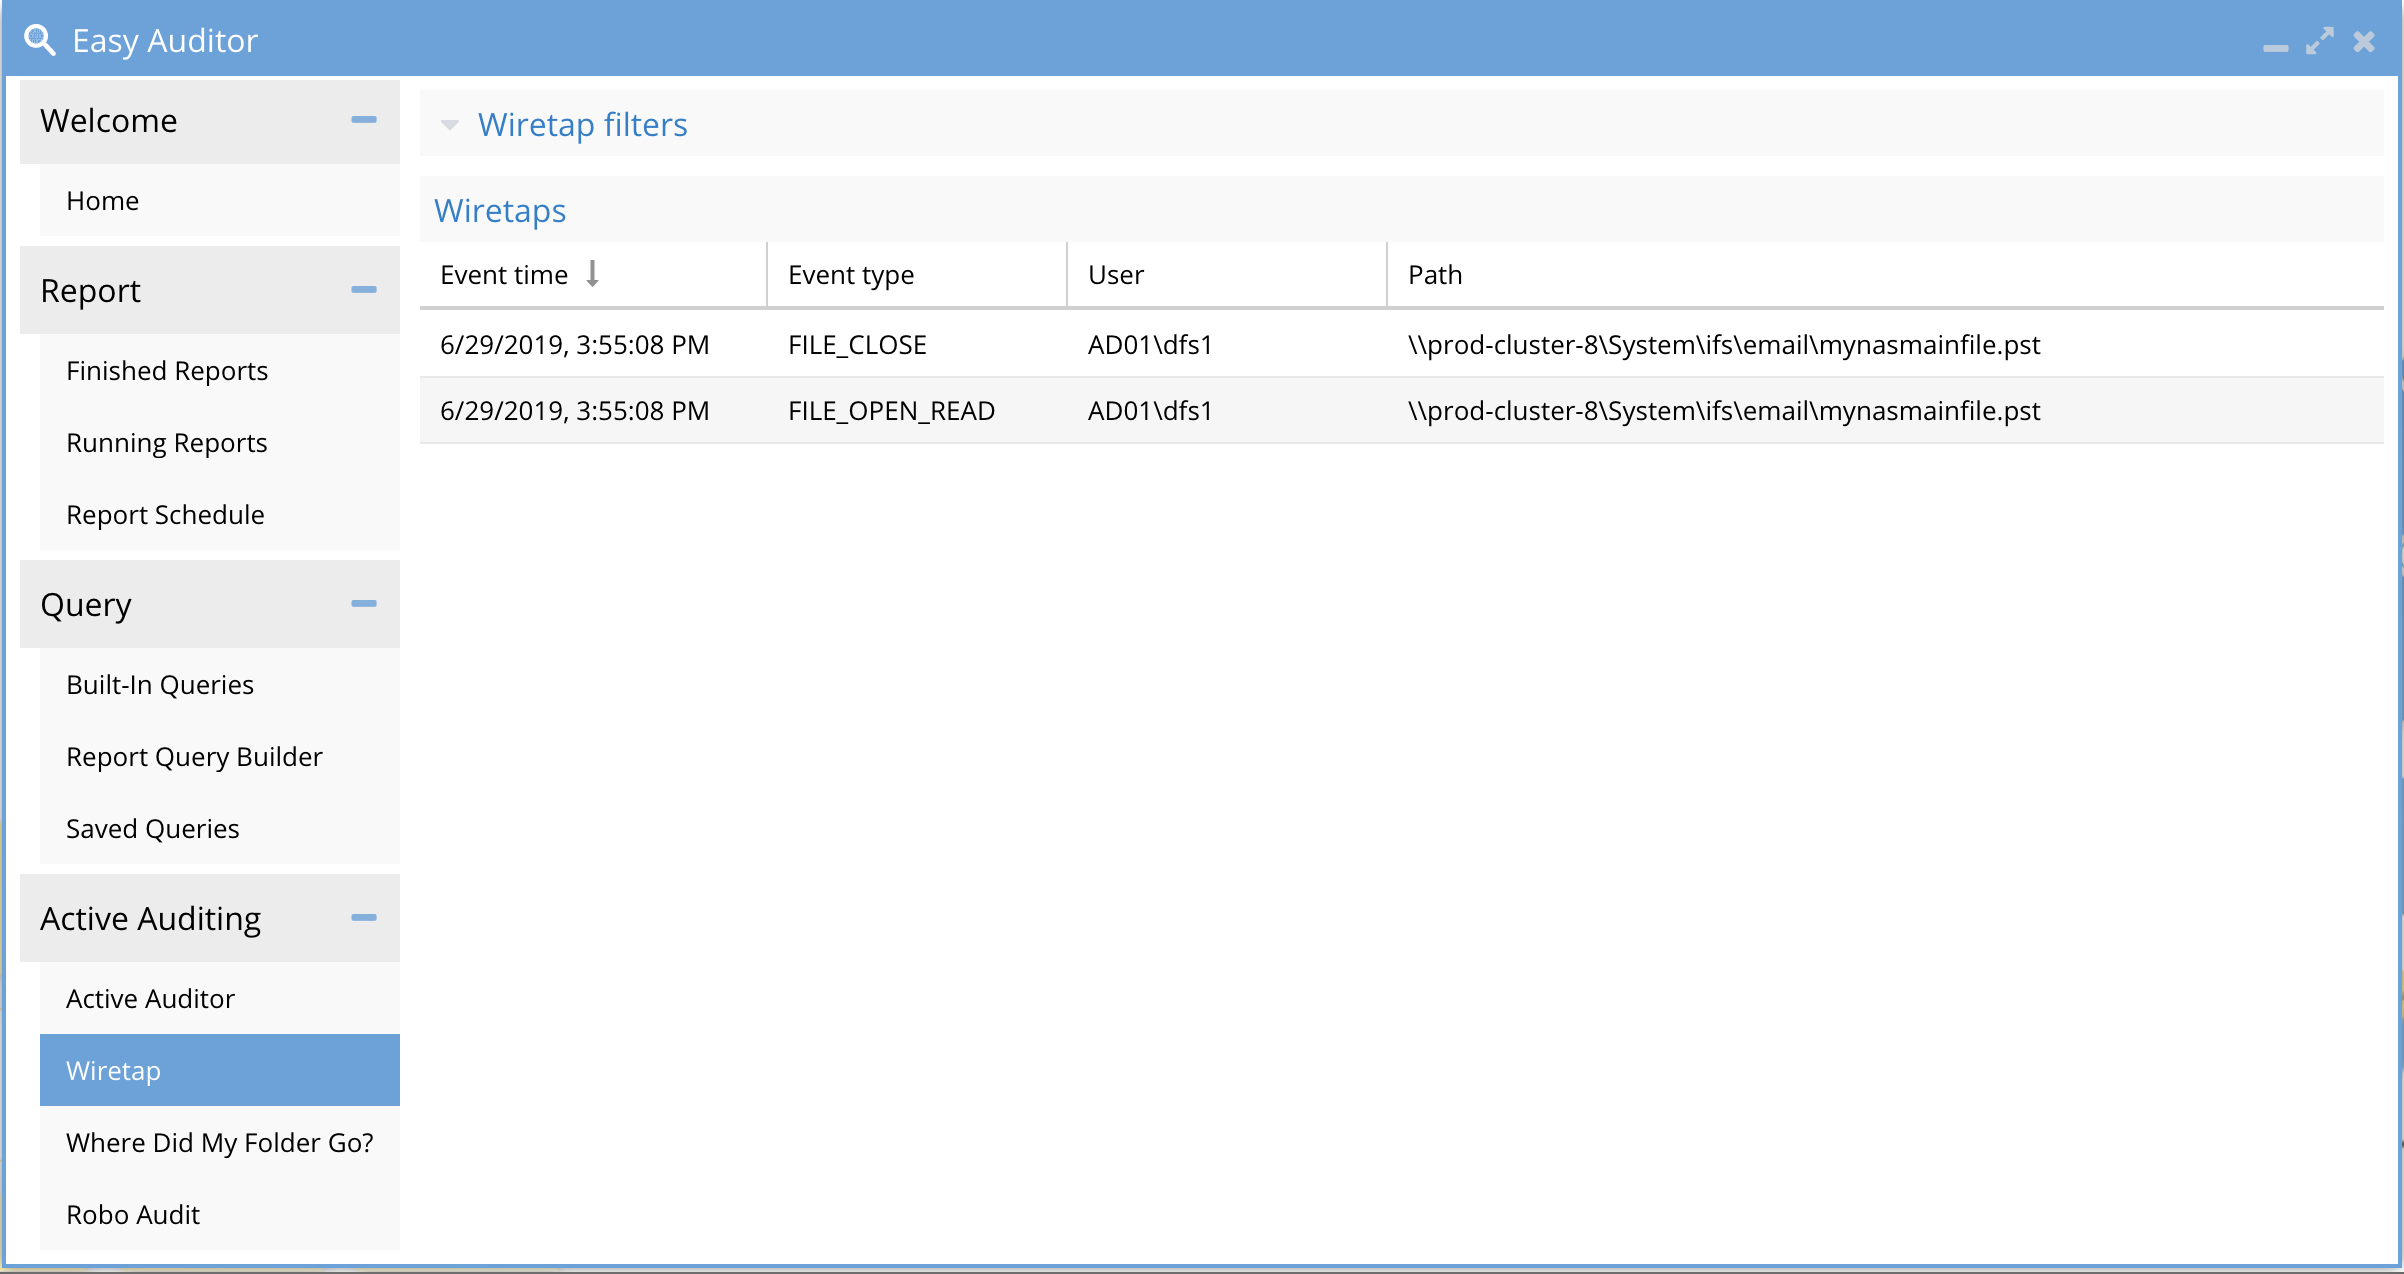
- WireTap UI with events example
-
Where Did My Folder go? Tab
Overview
This feature assists with a common issue with folders moved from user drag and drop actions on NAS shares, often resulting in the user and/or other users unable to locate the files. This turns into a help desk case to locate “missing data”, consuming support staff time and effort to locate the missing files. New in 2.5.5 directory deletes will be reported as well. New in 2.5.6 patch build adds File delete support which is a common use case when single files are deleted.
This solution accelerates and simplifies addressing missing data requests. The Role based access feature in Eyeglass has a read only role that can be assigned to the help desk to lookup user folder names to assist with locating data.
Limitations
- 2.5.6 builds after 84 will only return 5000 entries by default and a CLI command will allow increasing this number of results returned. This limit accelerates the search performance.
- NOTE: If the search results indicate Results 5000 (Limit 5000) in the GUI (see example below), you MUST increase the limit and run the search again.
- ssh to Eyeglass vm as admin user and run this command
- igls easyauditor folderquerylimit set --limit=10000
- NOTE: If the search results indicate Results 5000 (Limit 5000) in the GUI (see example below), you MUST increase the limit and run the search again.
- Copy to clipboard is tested to 5000 entries. The copy to clipboard may not copy all rows when greater than 5000 responses are returned. The solution is too narrow the time period searched or be more specific with the path to be searched.

Use Case
- A user drags and drops a folder on a share
- A user directory rename
- A file is deleted (2.5.6 after build 84))
- A file is renamed (2.5.6 after build 84)
- A user directory delete (2.5.5 >)
- NOTE: Does not capture drag and drop between SMB shares, since this is a copy event
- NOTE: Does not capture cut and paste of a direction on an SMB share or between SMB Shares since this operation triggers a create and delete operation. This type of action can found using queries and reports to look for file create and delete events.
How to Use Where did my folder go?
Overview
This feature helps locate drag and drop folders in the file system. It does not detect renamed files. New in 2.5.5, Directory deletes will be tracked in a fast cache lookup in addition to directory renames. A UI selector will allow filter results to show both Directory or file renames and deletes. A quick an easy copy to clipboard button allows pasting into Excel to sort the user or folder you are looking for more easily. New in 2.5.6 patch build is Deleted or renamed file support with more controls on the time range to search.
- Use the directory selector to pick the cluster and the path (mandatory). Path must begin with \ifs\ or select a path location closer to the suspected path to reduce the results returned and locate the event faster.
- Select the files or folders option to search one or the other. NOTE: 2.5.6 builds after 84 build will store directory and file deletes and renames by default.
- NOTE: Searching for folders or files will return renames and deletes at the same time. The check box hides deleted folders or files and does not execute a new search. If the results do not show you the file or folder you should expand the time range or select a path closer to where the delete or rename occurred.
- Select a day for the search (mandatory). NOTE: This feature requires search day by day or hour by hour range to ensure fast search results when there is a lot of data to search.
- In 2.5.6 build after 84 you can now select search previous 1, 2, 4, 6 or 24 hours to narrow down the amount of data returned from a search using the drop down selector. To specify the start time of your search you can use new time control to change the start time of the search. When selecting a previous day, the search will automatically start from the current time on your pc.
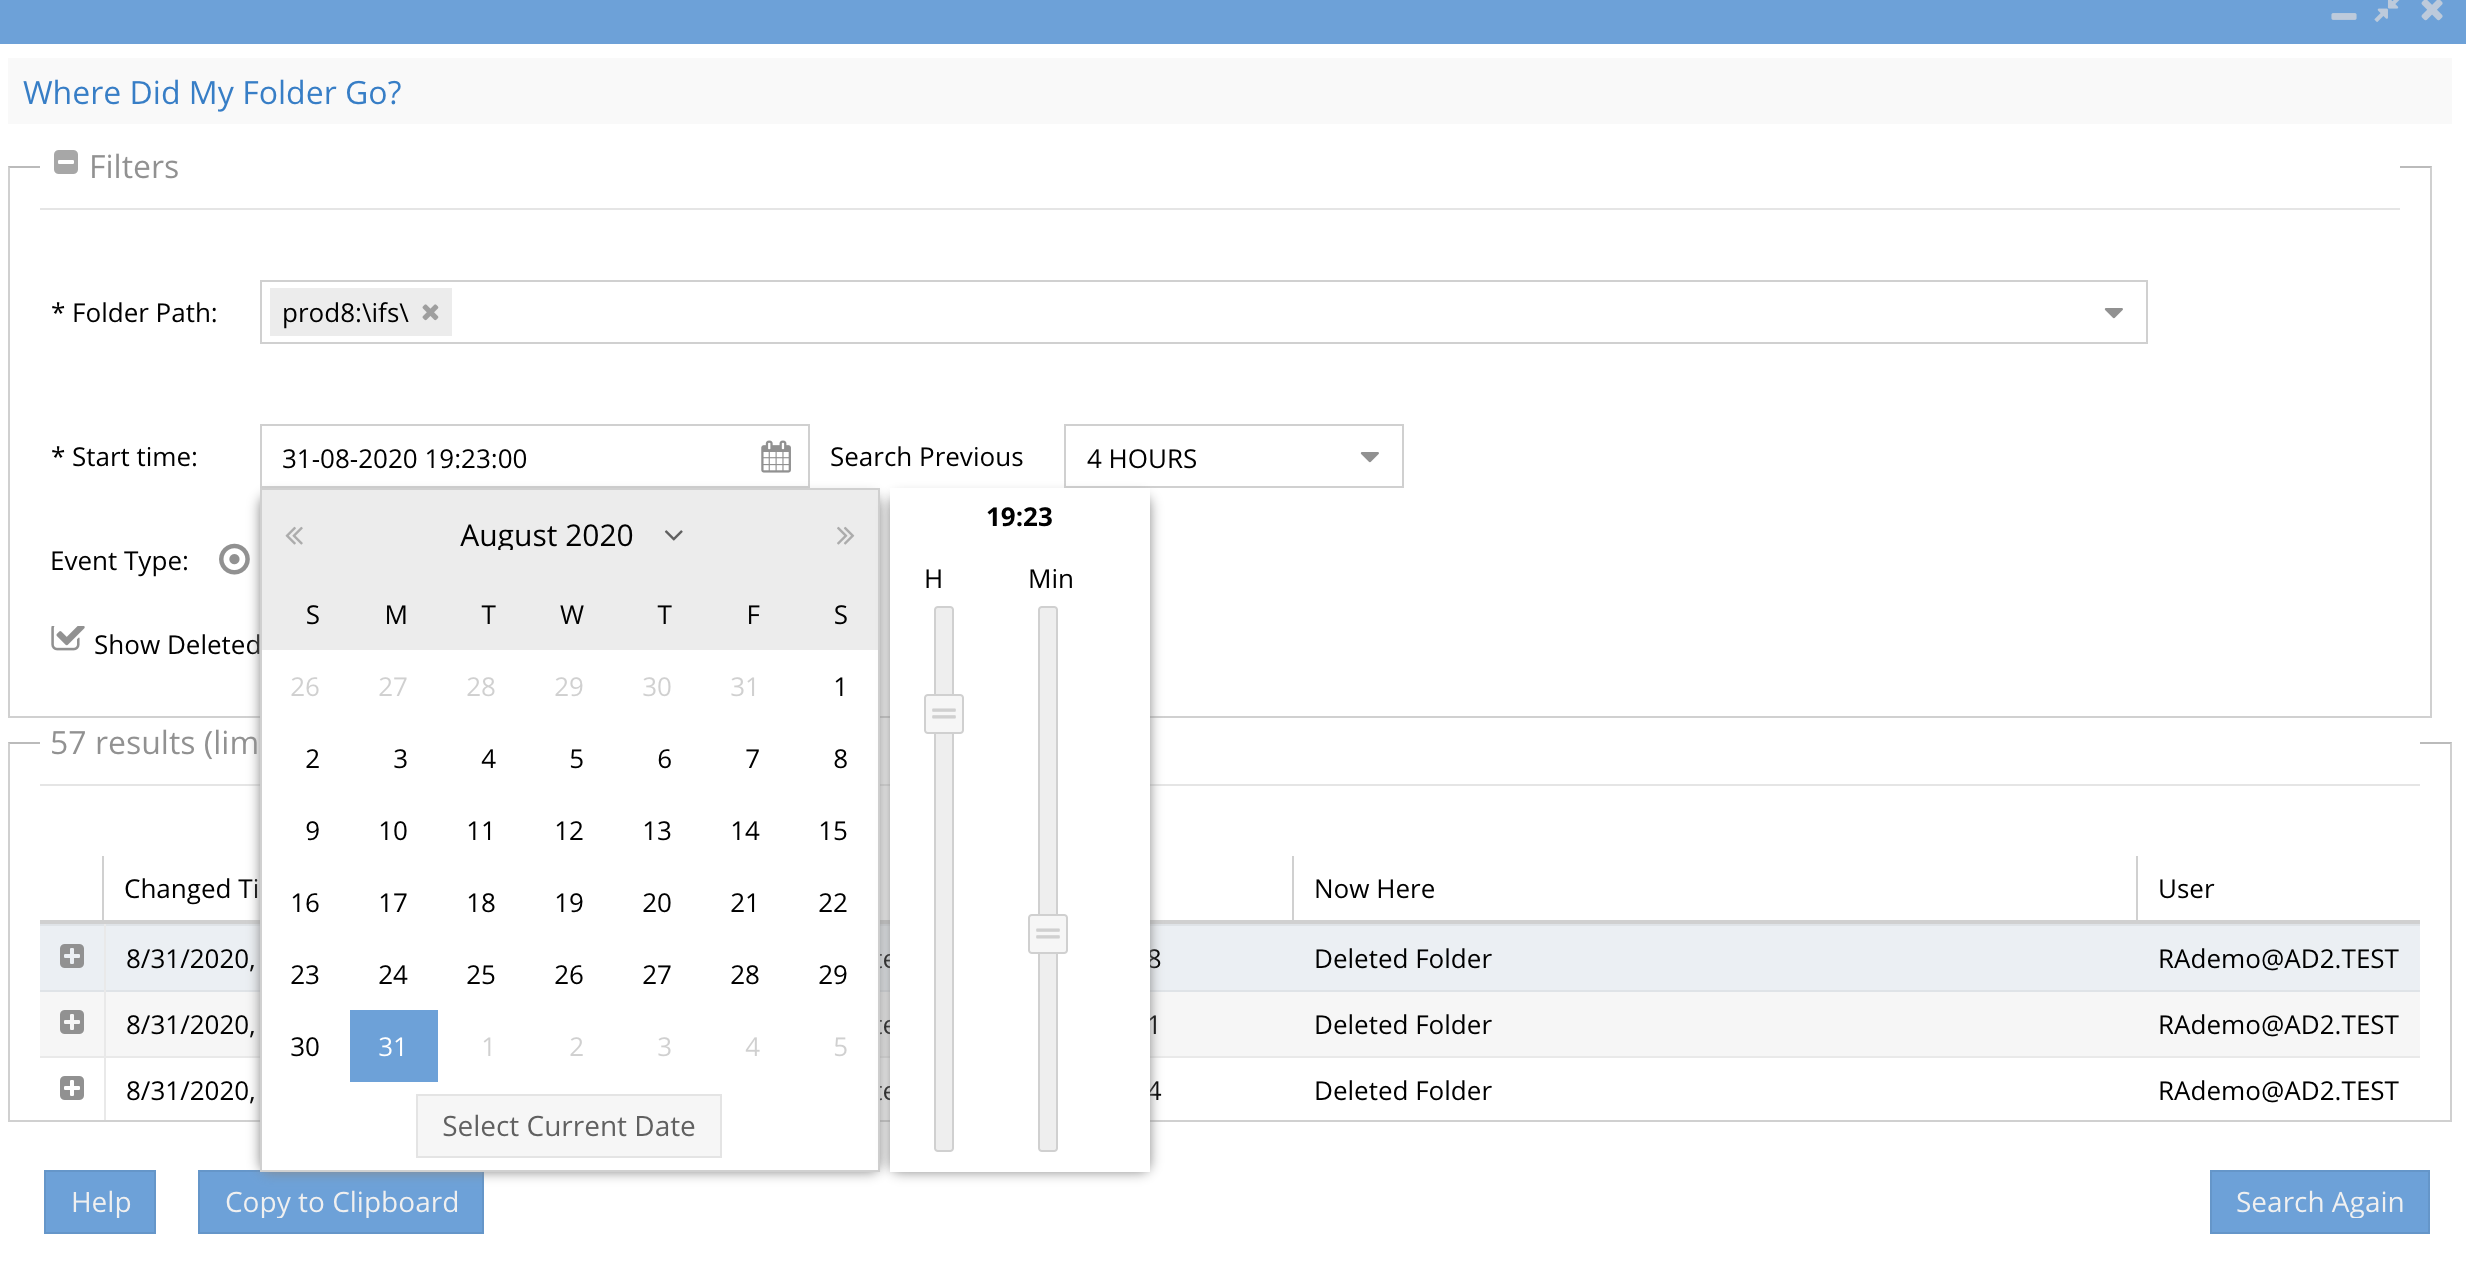
- Check the Show Deleted objects to filter to show Directory and file Deletes in addition to Renames. The default will display only rename events for files and folders.
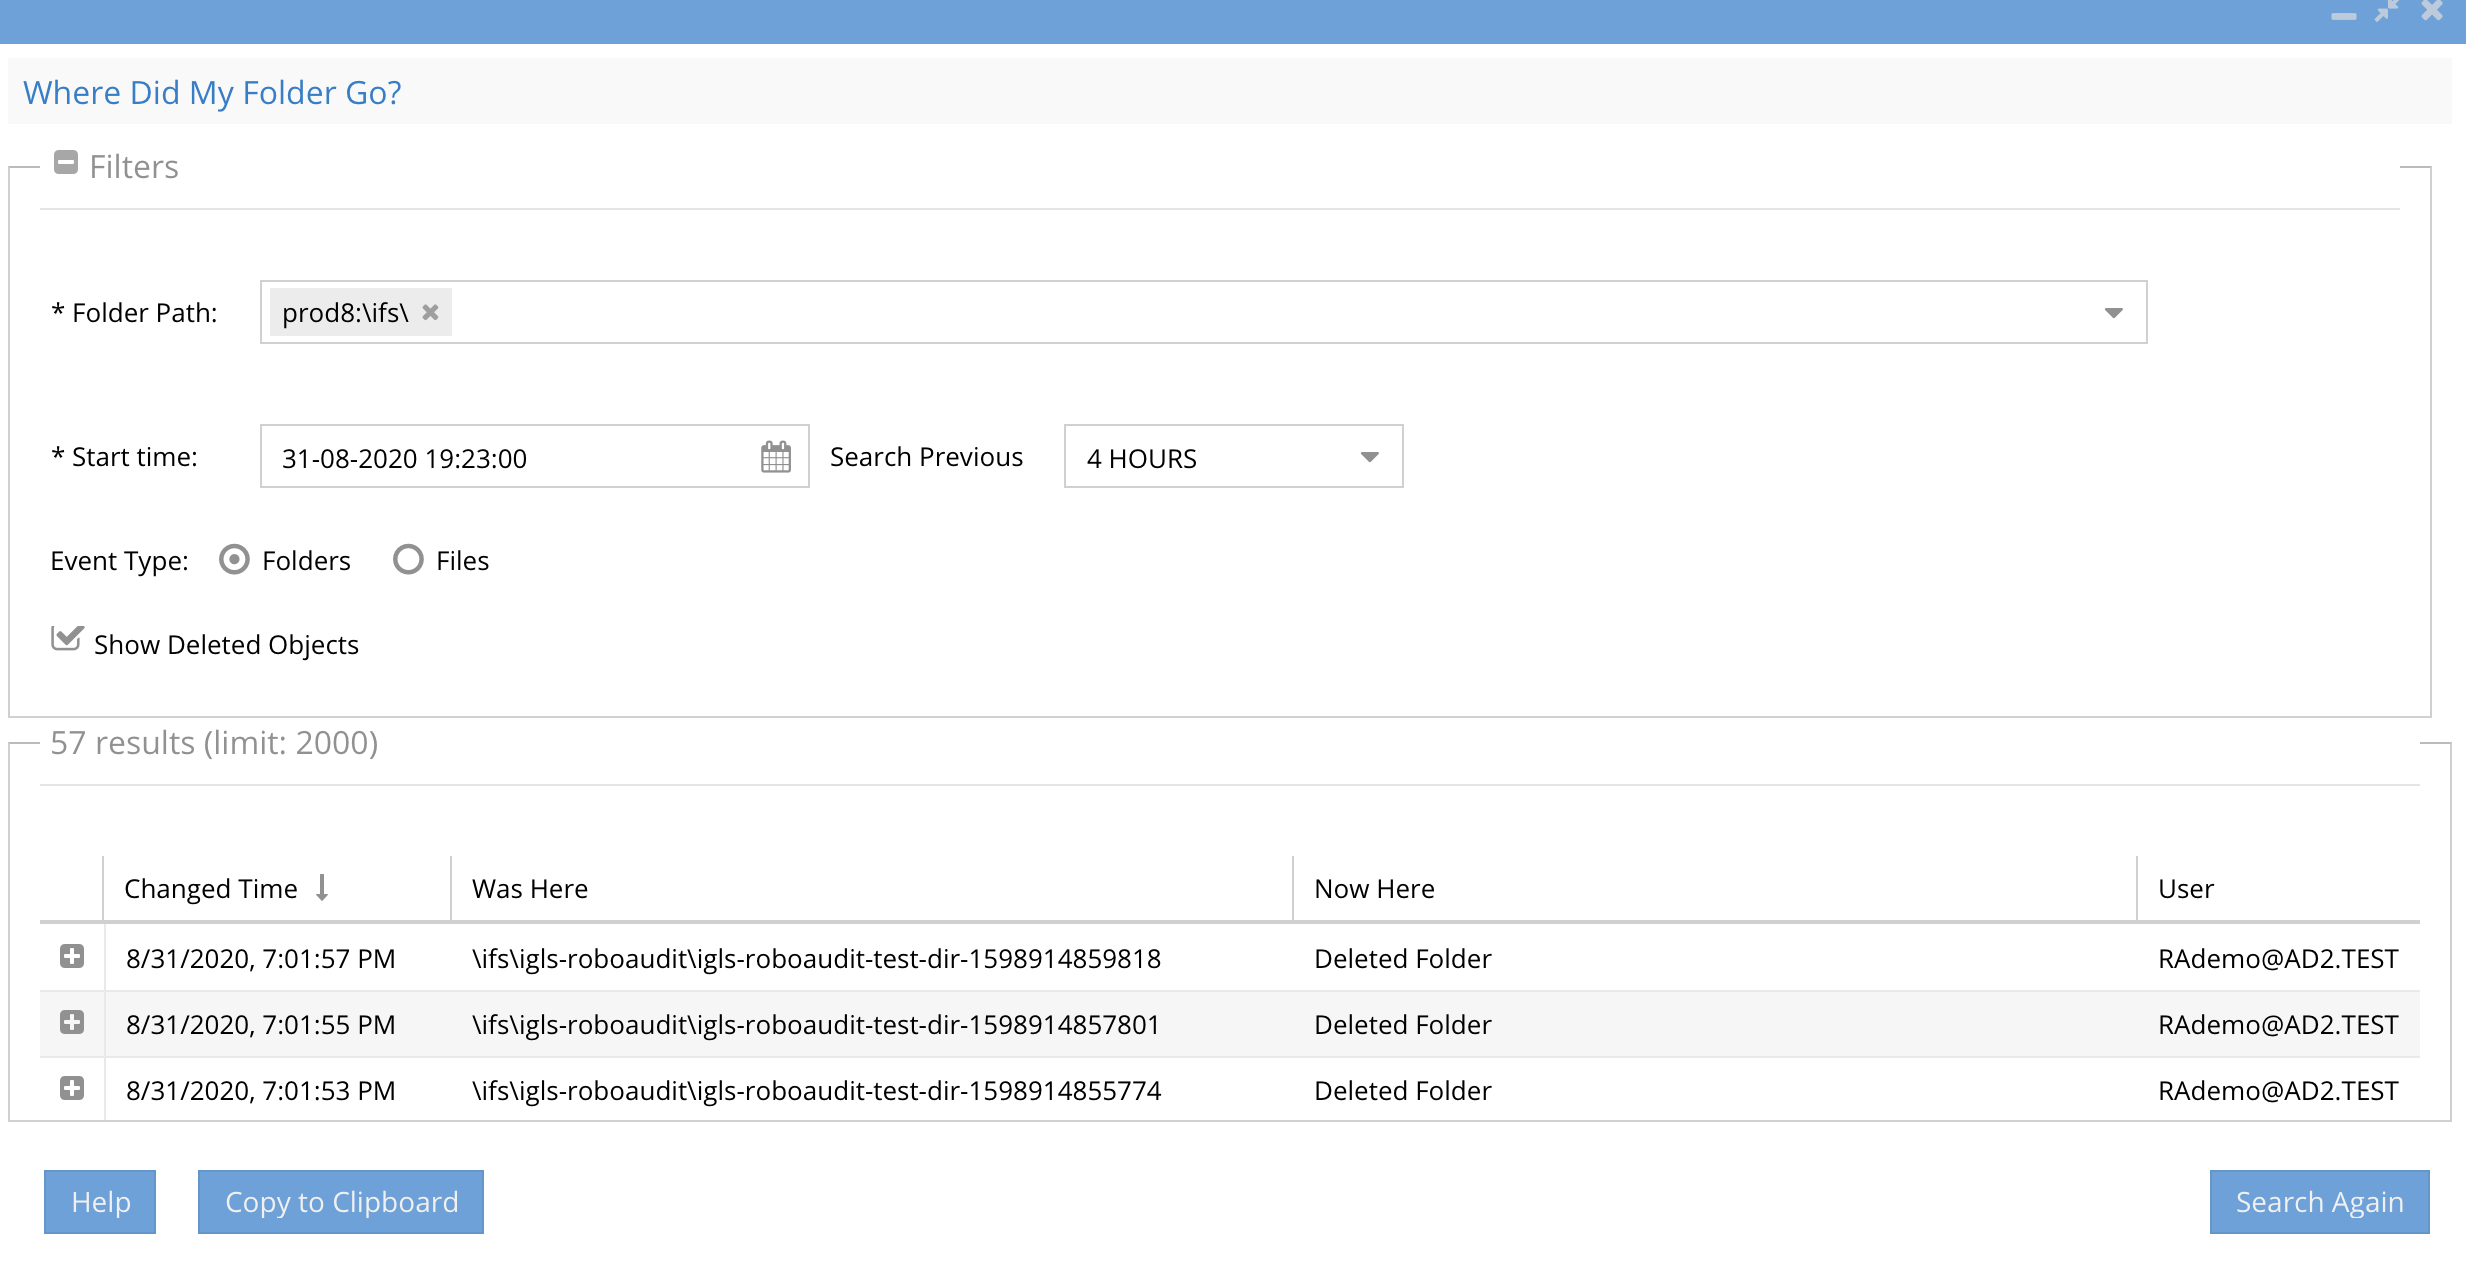
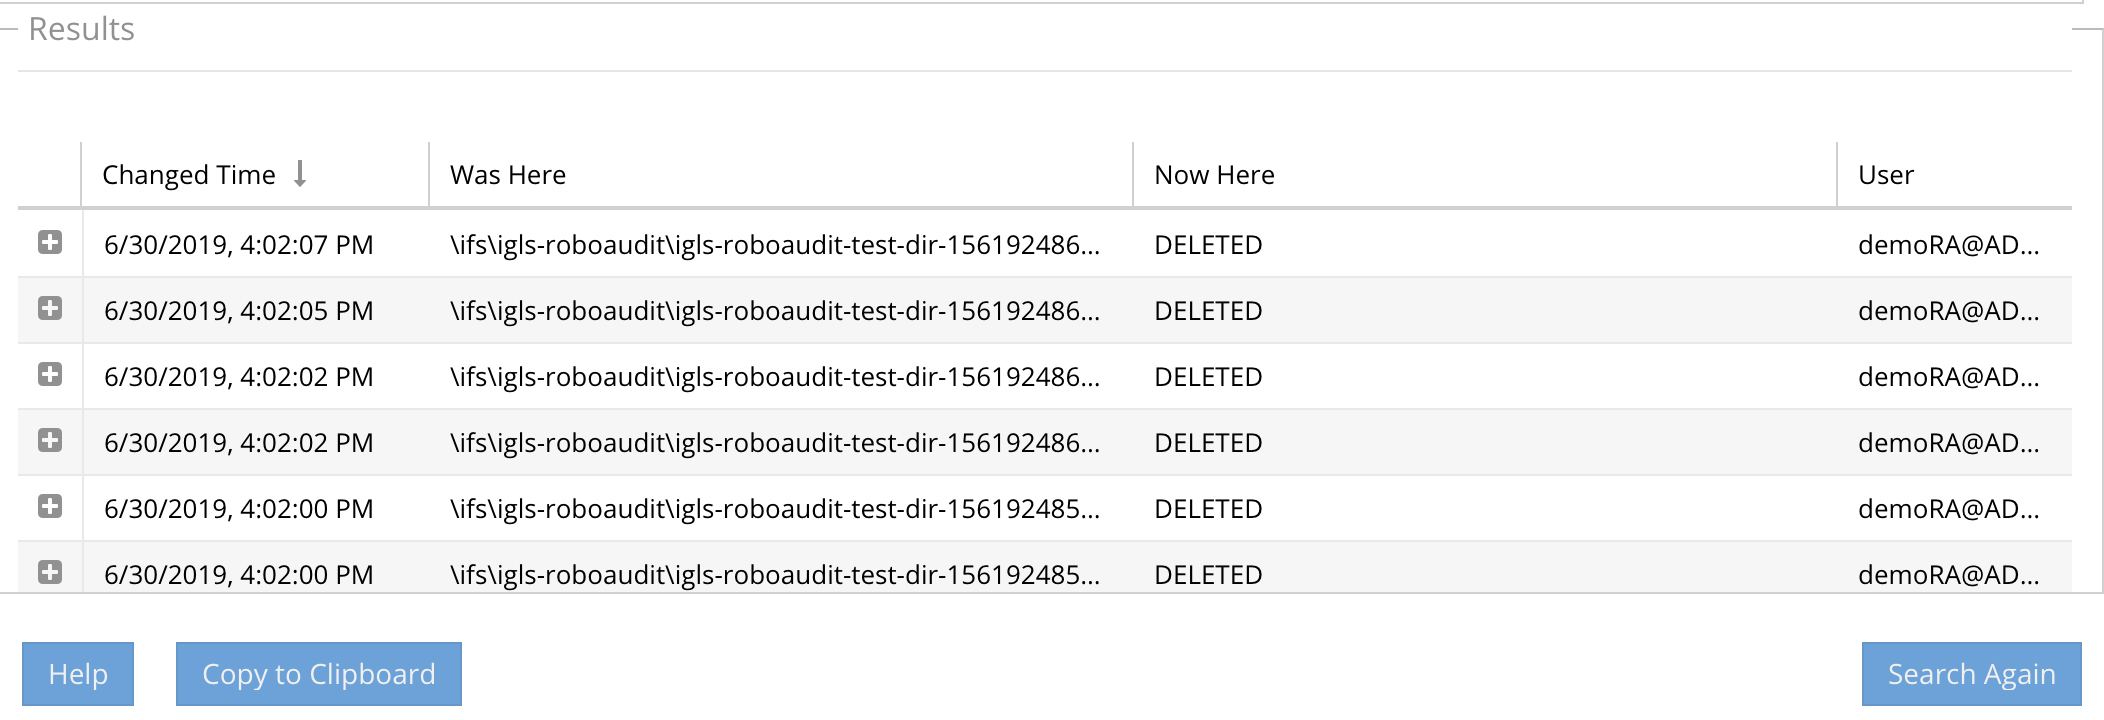
- The results display
- The time of when the directory was moved
- The user id that executed the move or delete operation
- The original folder path before the move
- The new location of the folder path after the move (this will be blank and show a delete for a directory delete)
- The column Now Here will display Deleted folder or Deleted File or the path of a moved folder
- See new results counter showing how many results were returned and the current limit default of 5000 results. In order to increase the number of results returned per search see the Eyeglass CLI guide here.
- Using the search results identify the path and user that executed the folder move operation to move the data back to the previous location
- See screenshot below and the new option in > than 2.5.5 or later to copy results to the clipboard and paste into Excel.
- Done
RoboAudit
This feature performs continuous auditing by creating user events as an SMB connected user. The events are created , ingested and stored in the database. The Robot audit process runs reports and counts file and directory events and logs success or failure. This offers the highest level of confidence that audit data is being processed and stored. The audit lag is the time from when an event is created to when the data is searchable.
How Use RobotAudit
- Prerequisites
- NOTE: Security Guard service account must be unique and MUST NOT be shared with Robo Audit service account used in Easy Auditor
- NOTE: Security Guard service account must be unique and MUST NOT be shared with Robo Audit service account used in Easy Auditor
- Open Easy Auditor Icon
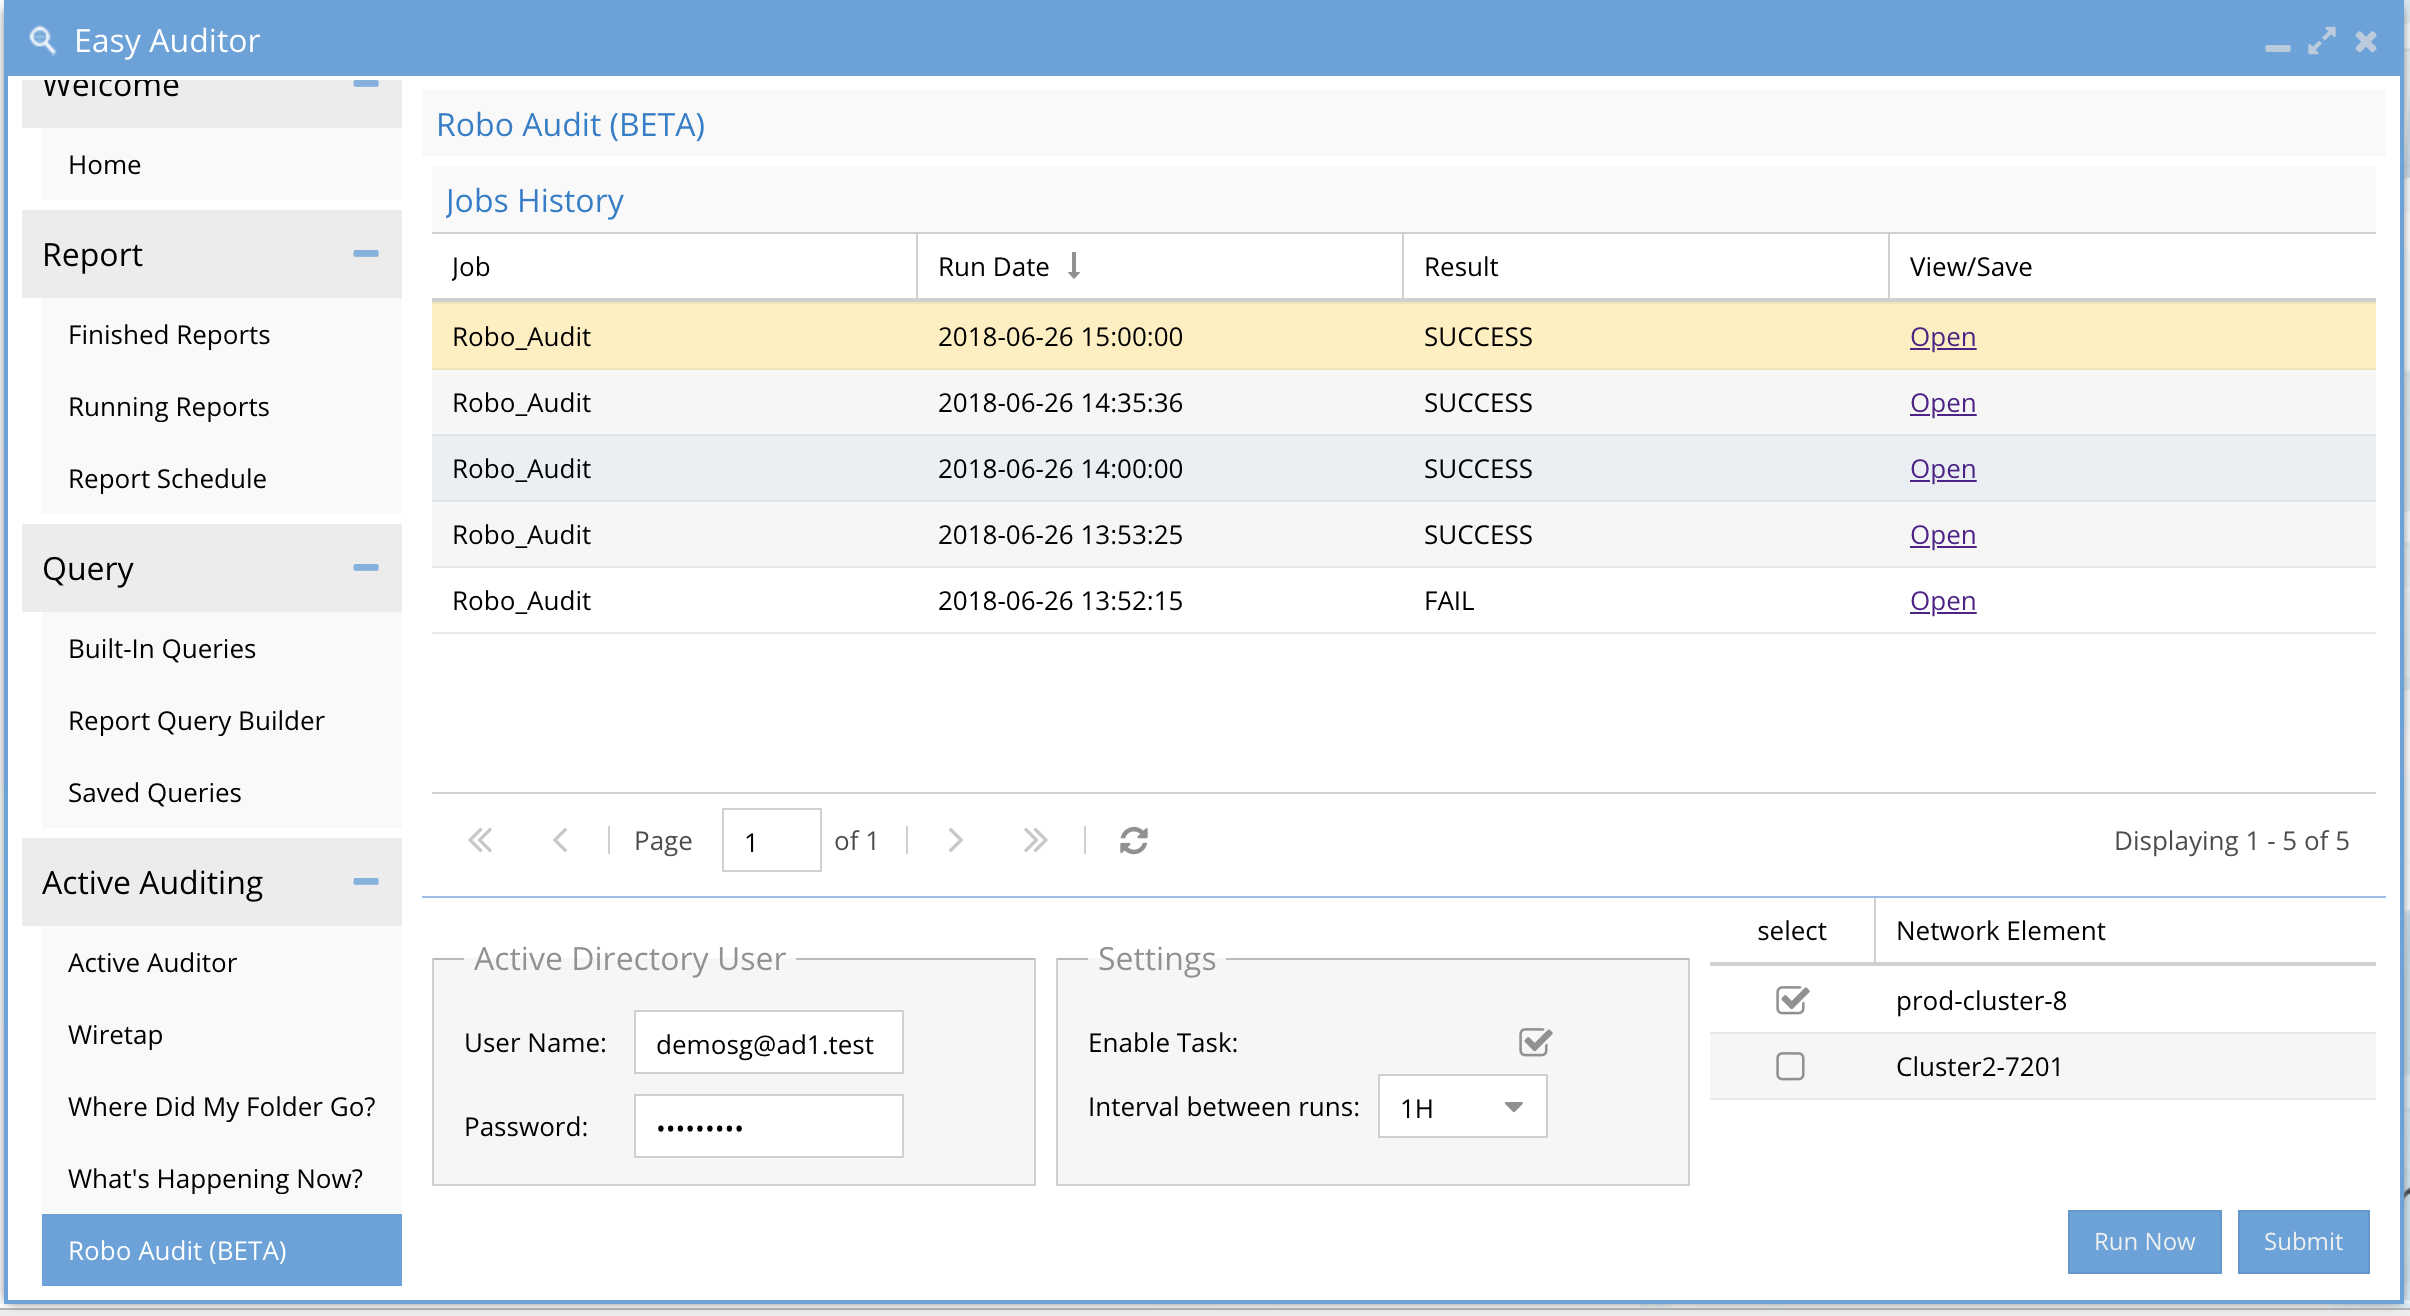
- Click the RoboAudit tab in the active auditor menu
-
-
- User Service Account Create an a local PowerScale user in the system zone local authentication provider OR create an AD service account. This account should be a normal AD user and should not be the same as the Ransomware Defender Security guard user.
-
For local PowerScale user account enter user@clustername OR for Active Directory user enter the user id user@domain or domain\user syntax with password. NOTE: if running Ransomware defender user a different service account user to avoid a lockout on the RobotAudit service account user.
-
Enable the task check box and select an interval default is 1D or once per day. The default should be used unless you need to debug something and can increase to once per hour.
-
Select the check box next to each cluster to test audit message flow.
-
click submit button to save settings. NOTE: The userid and password authentication will be tested at this point and an error returned if it fails.
-
Now click Run Now button to start the first execution.
How to Monitor RobotAudit jobs
Open the Jobs Icon
Click running jobs
Select the RobotAudit job and expand to see the steps that are being executed.
-
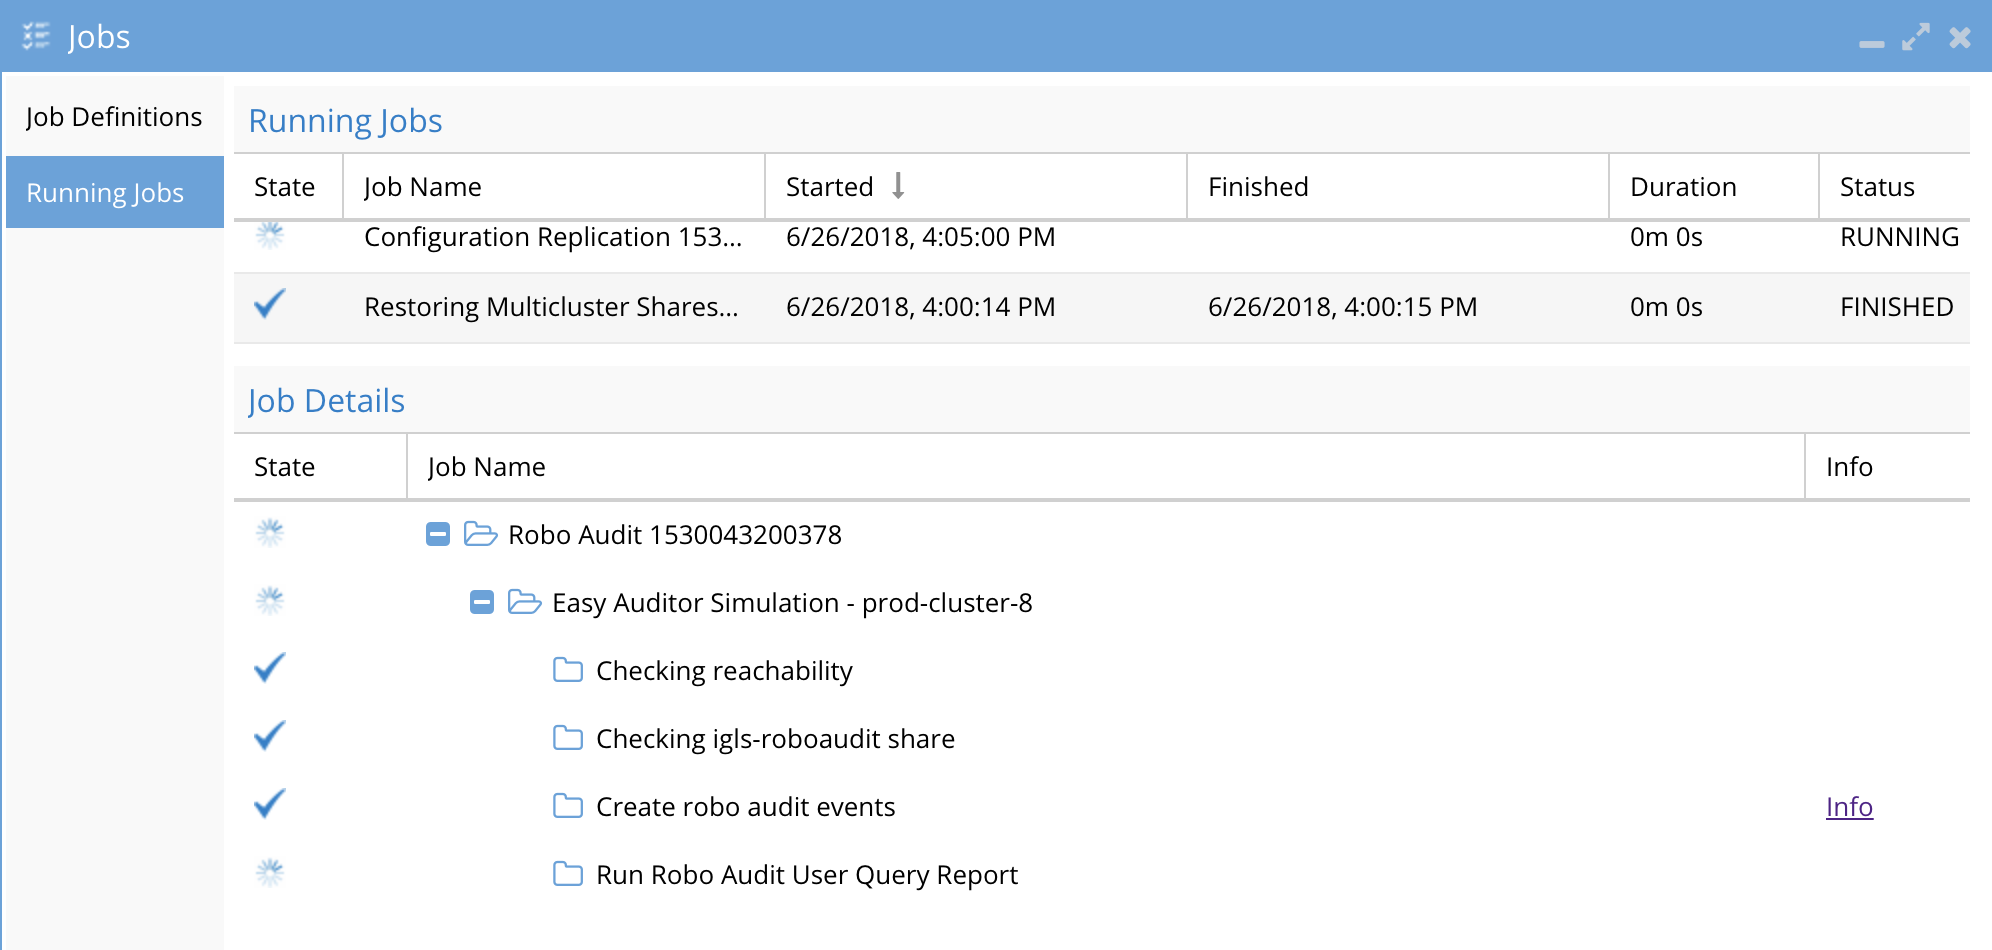
-
done
-
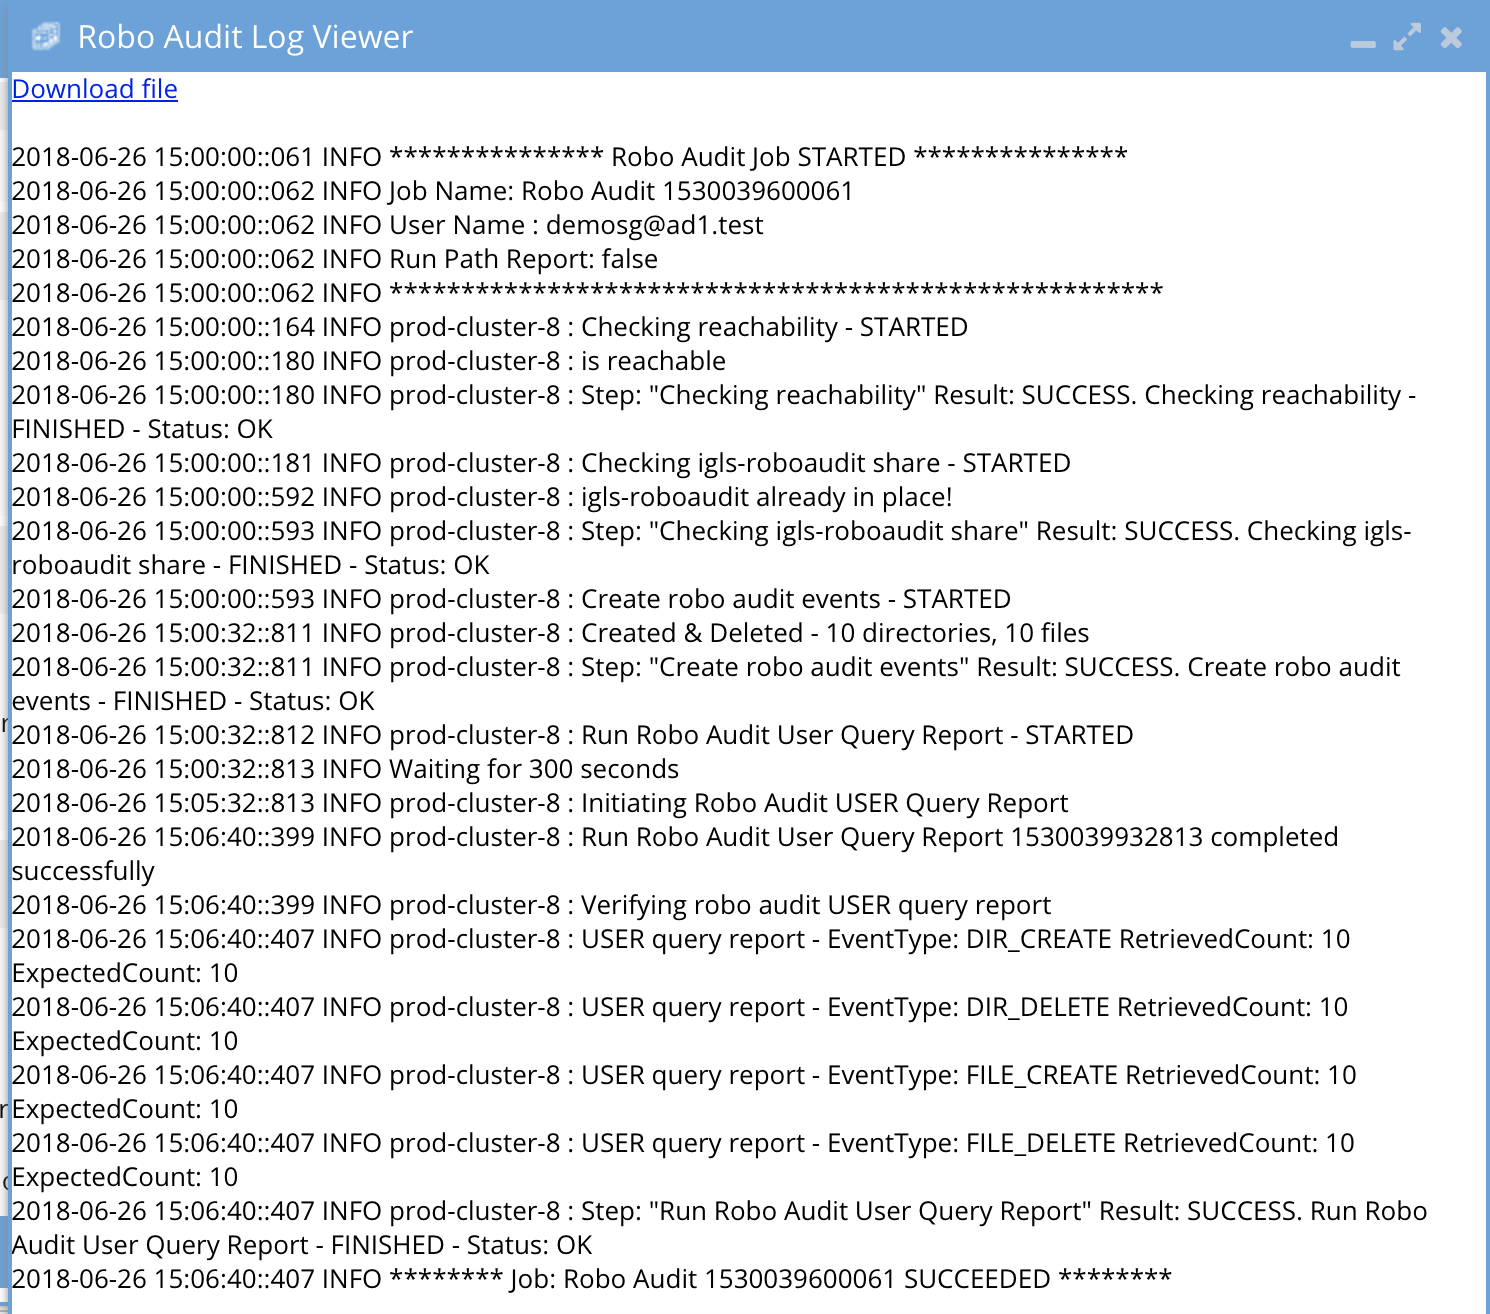
How to verify RobotAudit test Results
- Click on the RobotAudit tab in Easy Auditor Icon
- Click open link to view the log file and all steps completed or any errors
- Example succesfull log
-
- Example failed log where the SMB share did not exist to create test files
-
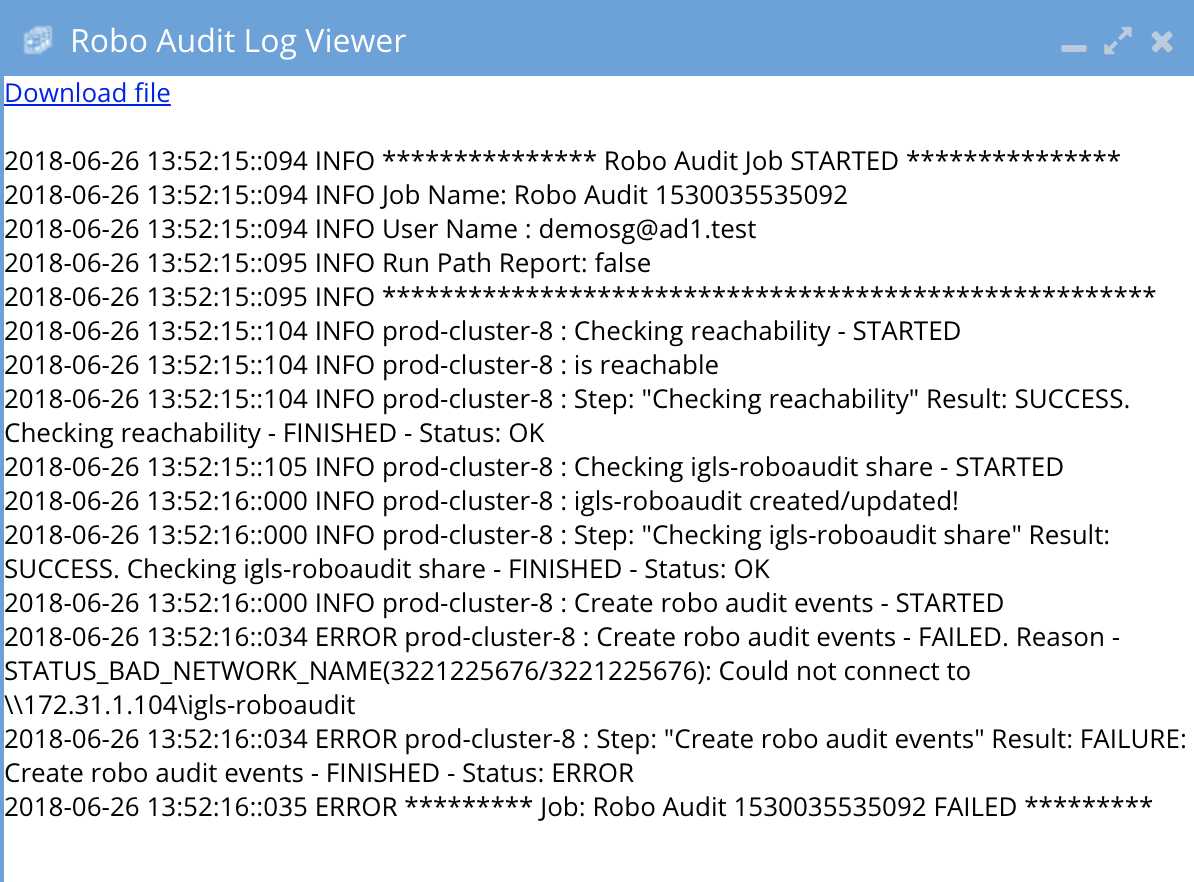
-
If RoboAudit indicates failure a case support should be opened with support.
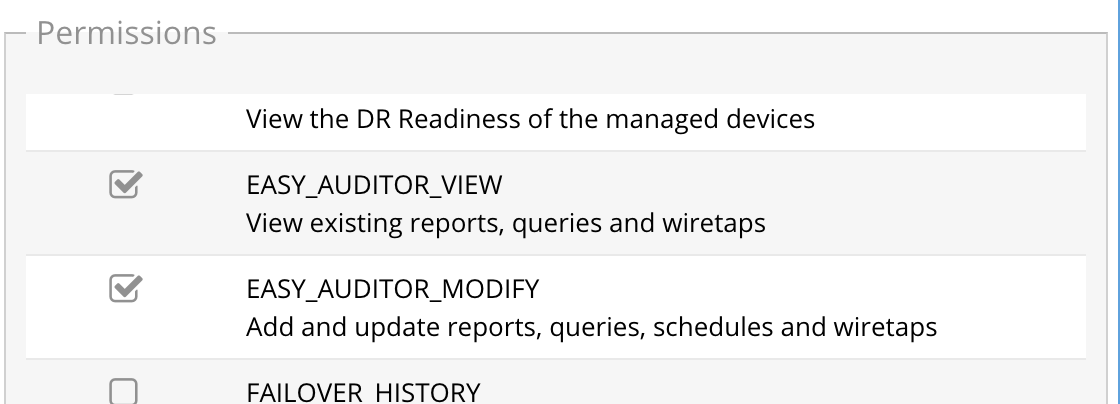
Auditor Role Based Access
Easy auditor has 2 permissions the user roles icon that are automatically assigned to the auditor user. See below.
To create additional access to read only or read/write permissions consult the RBAC guide and use the permissions below.
How to Centralize CSV saved reports on a NAS Export
Use this option to mount an NFS epxort on PowerScale to auto store reports centrally as a second copy.
- Create a mount to an PowerScale and secure to all ECA node ip addresses with write access
- Create a mount point on the Eyeglass appliance and create a mount point to the PowerScale export path.
- eyeglasss-61:/opt/superna/sca/data # mkdir EA_reportseyeglasss-61:/opt/superna/sca/data # chown sca:users EA_reportseyeglasss-61:/opt/superna/sca/data # chmod 755 EA_reports
eyeglasss-61:~ # igls admin eaCsvArchivePath set --value=/opt/superna/sca/data/EA_reports{"success": true}
eyeglasss-61:~ # igls admin eaCsvArchivePath
/opt/superna/sca/data/EA_reports
- In this example the mount point path is /opt/superna/sca/data/EA_reports
- sudo -s (enter admin password)
- type 'yast'
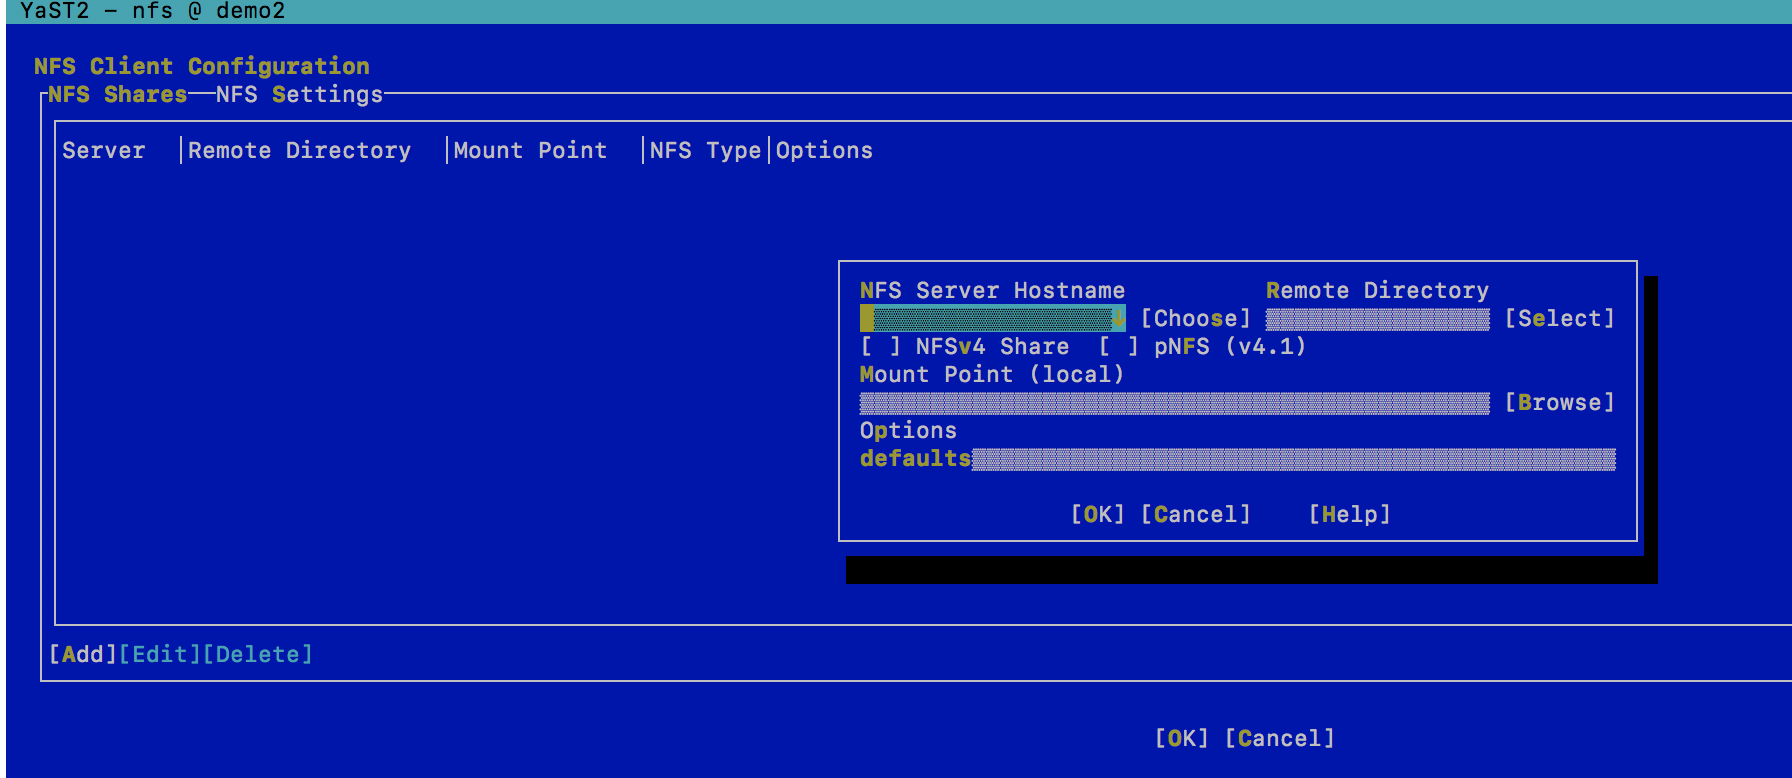
- From the menu select Network Services --> then NFS client
- Using Tab button select to add option
- Complete inputs with FQDN to remote host, local path created in the step above
-
- done.
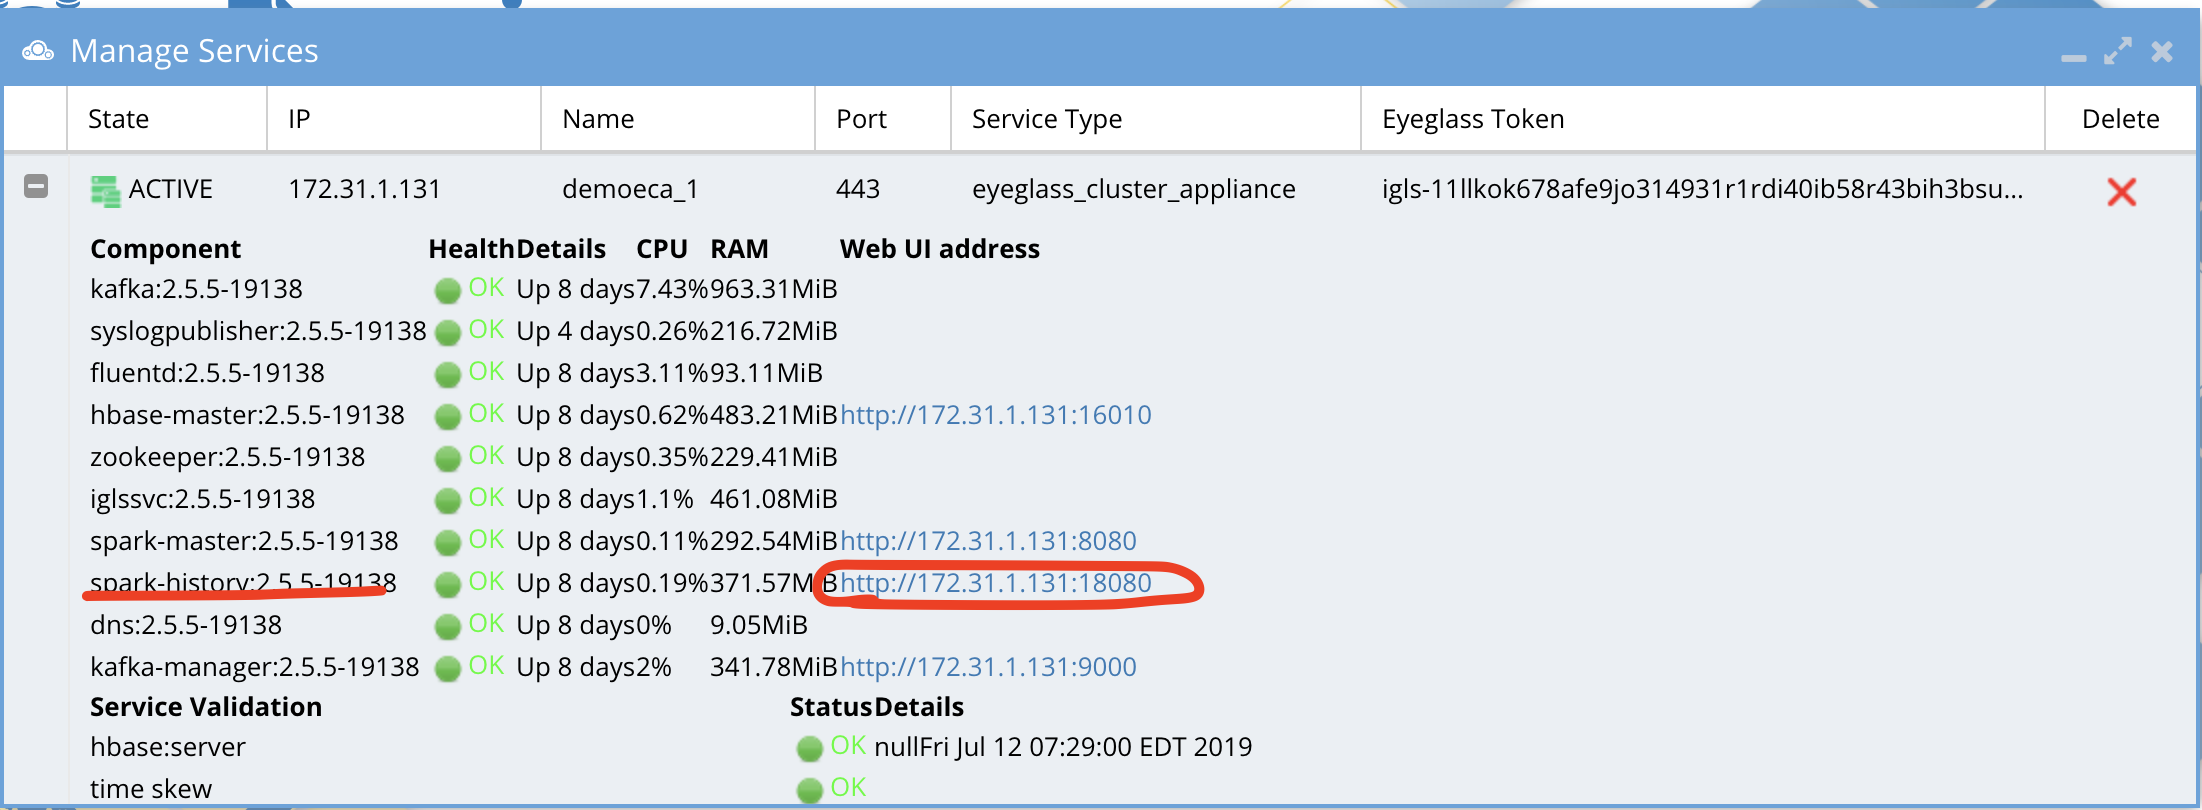
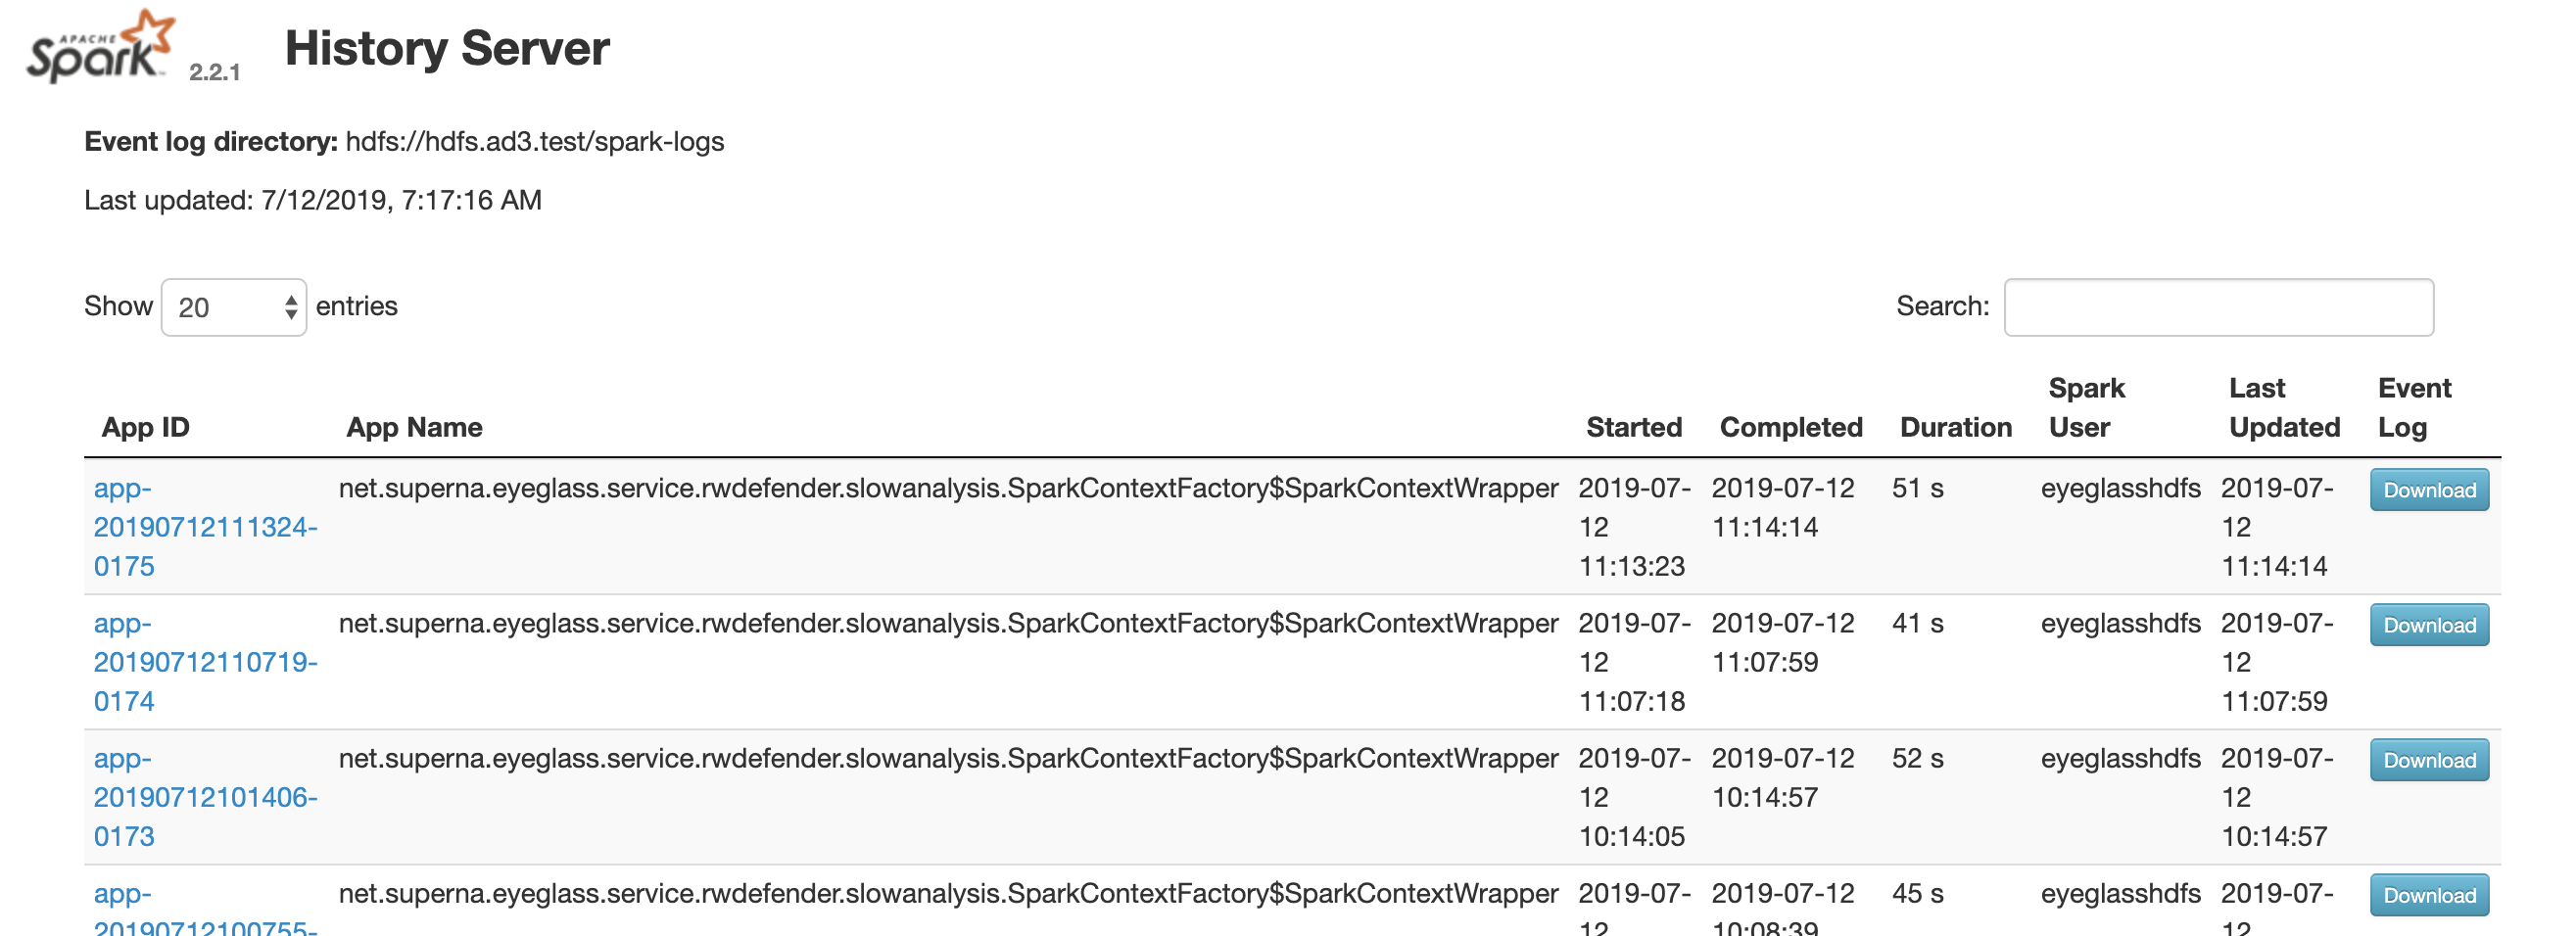
How to view debug logs for Searches
- Login to eyeglass desktop
- open managed services
- expand node 1 and find spark history url to access the logs