Splunk Enterprise Security Integration with Incident Management
- Overview
- Support Statement
- Limitations
- Solution Overview
- What is Splunk Enterprise Security?
- Solution Configuration in Splunk Enterprise and Defender Zero Trust
- Prerequisites
- Configuration in Splunk Enterprise Security
- How to View Incidents in Splunk ES and map to investigations
Overview
Customers using Splunk Enterprise Security can leverage this integration to send real time zero trust alerts using Content Library correlation searches to populate incidents in Splunk Enterprise Security dashboard. These incidients can then be added to investigations and leverage the Zero trust specific data that Superna Security Edition.
Support Statement
-
NOTE: This documentation is provided "as is" without support for 3rd party software. The level of support for this integration guide is best effort without any SLA on response time. No 3rd party product support can be provided by Superna directly. 3rd party components require support contracts
Limitations
Solution Overview
Superna Security Edition Zero Trust API is the cornerstone technology used to integrate with SIEM, SOAR and XDR platforms. Automation begins with data that summarizes the threat and places that information into a security tools to be acted on by Secops and run playbooks to protect corporate IT assets from vulnerabilities and insider or external attackers. The Splunk platform can dynamically search fields on a continuous basis and expose Security Edition alerts as incidents as a data source for Investigations within Splunk ES.
What is Splunk Enterprise Security?
Splunk Enterprise Security (ES) is a data-centric, modern security information and event management (SIEM) solution that delivers data-driven insights for full-breadth visibility into your security posture so you can protect your business and mitigate risk at scale.
Solution Configuration in Splunk Enterprise and Defender Zero Trust
Prerequisites
- Installed Security Edition
- Installed Splunk Enterprise Security
- Integration configured with Superna Zero trust. See the integration guide here.
- Eyeglass OS appliance version 15.5
- cat /etc/os-release
Configuration in Splunk Enterprise Security
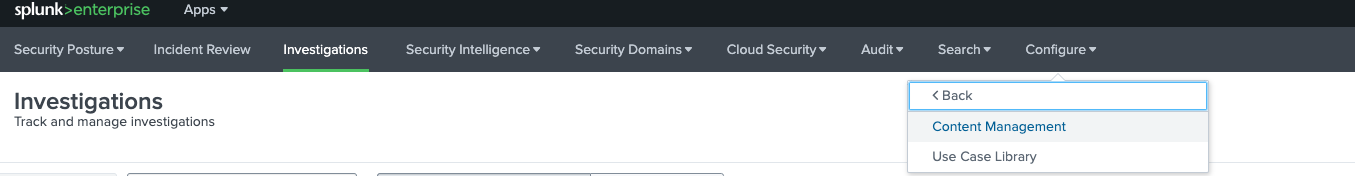
- Login to Splunk ES application as administrator
- Open the Content Management under the Configure menu
- Click to create a new Content --> Correlation Search
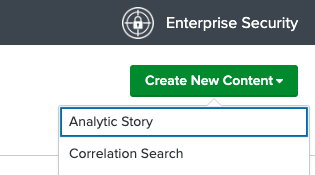
- Provide a search name that will show up on incidents. REcommended Search parameters are below.


- Click to create an action to run on a match and select Notable
- Notable Event configuration below.
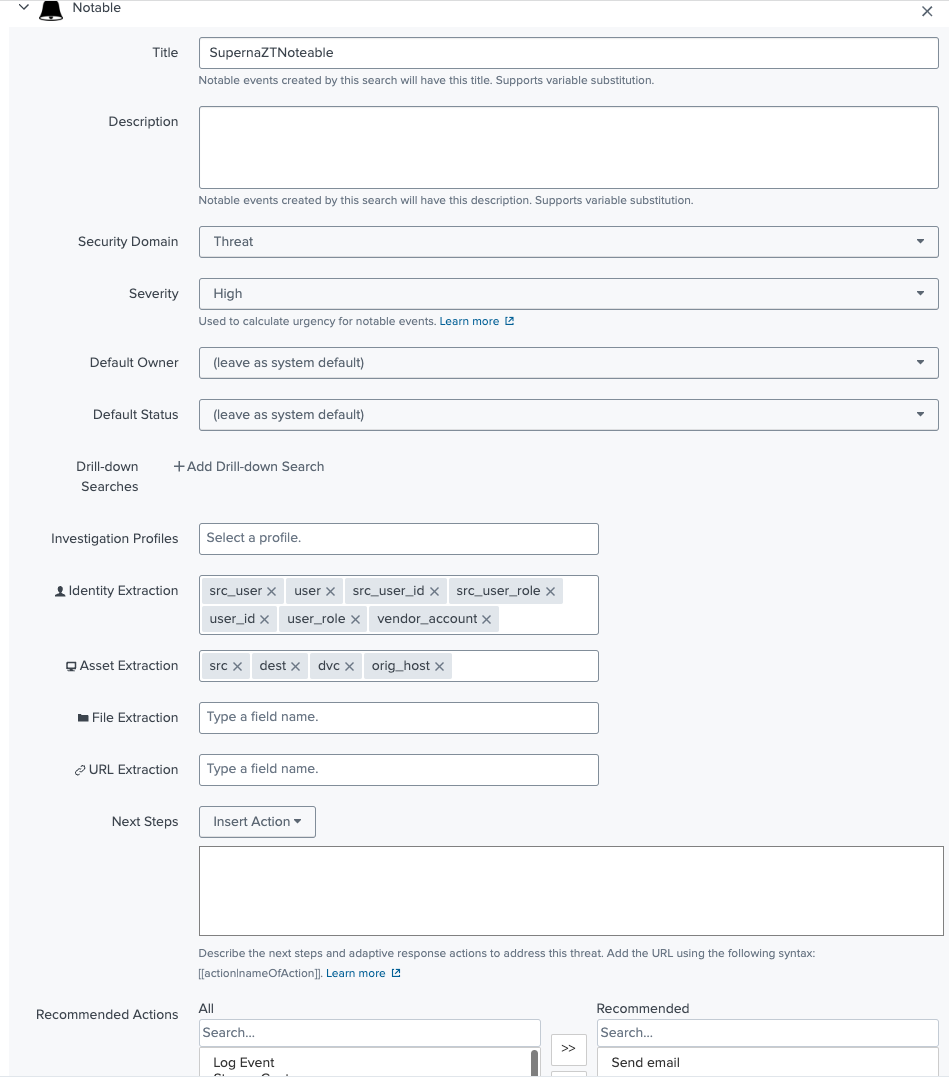
- Click Save
- Done. This will default to 5 minute searches to locate new incidents to raise within Spunk ES.
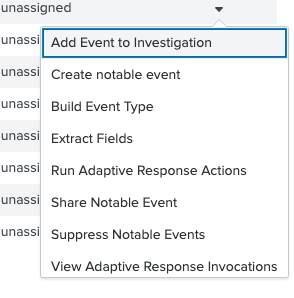
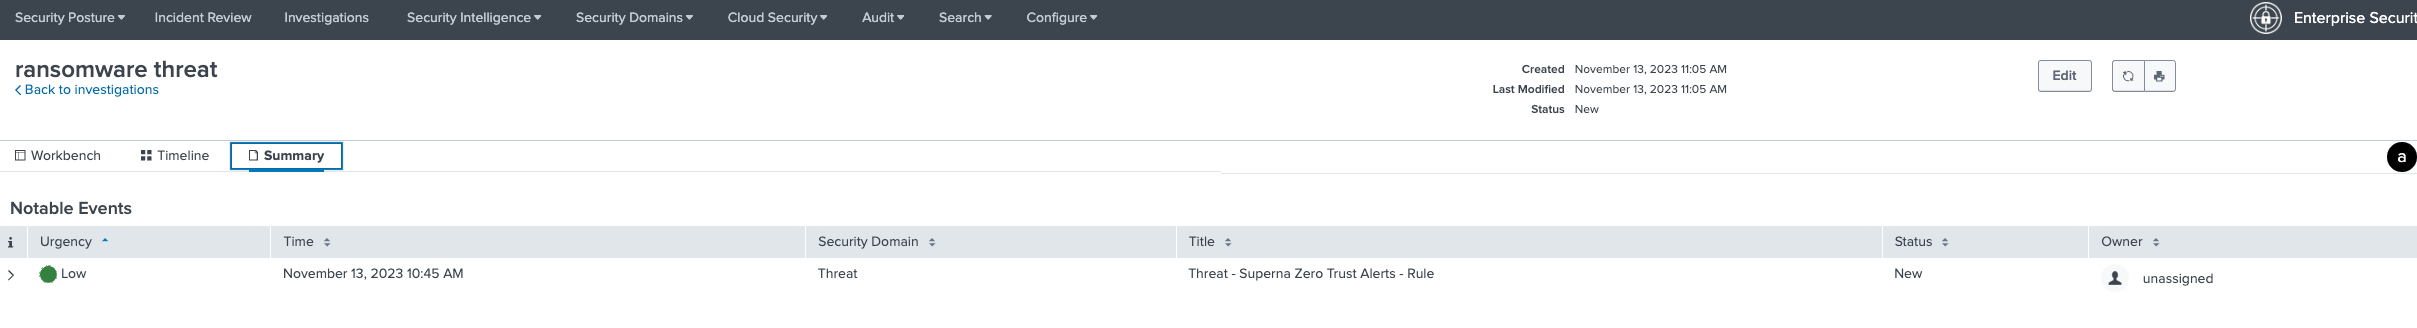
How to View Incidents in Splunk ES and map to investigations
- Before you begin, ensure Zero trust events have been raised to validate the search correlation is working.
- Once zero trust events have been parsed by Splunk indexes, they can be found by the correlation search and shown in the Incident Databoard.
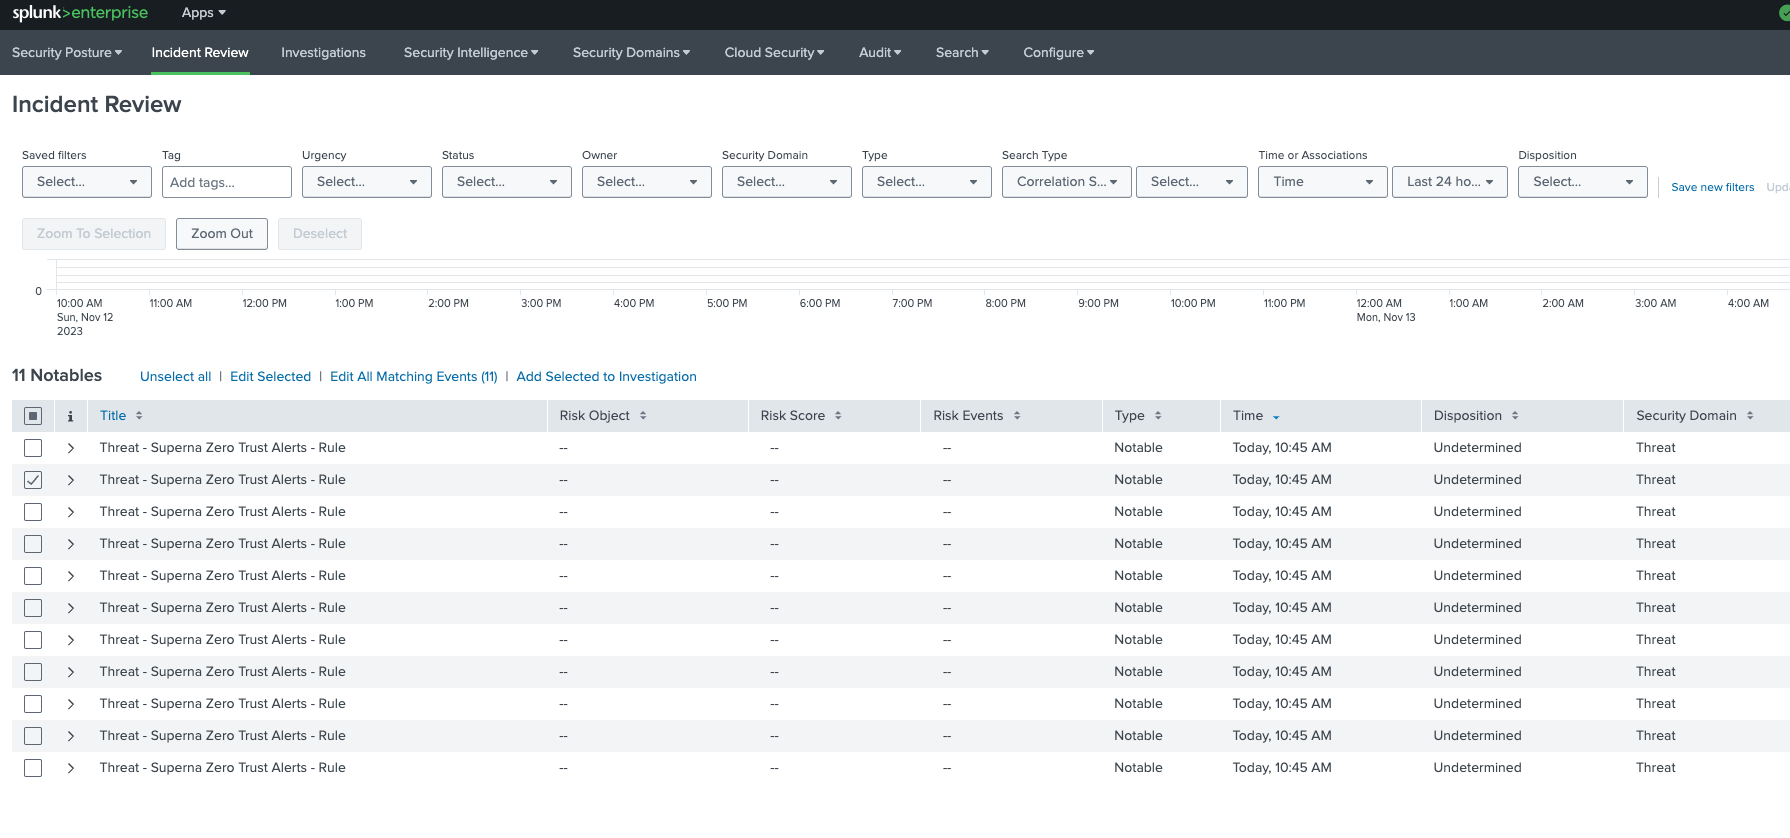
- Once an investigation is open these incidents can be assigned to the open investigation.