Splunk Enterprise Integration with Zero Trust Alarms
- Overview
- Support Statement
- Limitations
- Solution Overview
- What is Splunk Enterprise?
- Integration Architecture
- Solution Configuration in Splunk Enterprise and Defender Zero Trust
- Prerequisites
- Configuration in Splunk Enterprise
- Configuration Steps on Eyeglass Virtual Machine
- High Level steps
- Configuration Step by Step
- Configure the Service start and python integration files
- Configure the python packages and customize the splunk integration python code
- Configure Defender Zero Trust Webhooks
- How to test the Integration with Splunk Enterprise
- Splunk Enterprise SecOps administrators Integration Experience
- How to Configure Data Security Essentials
- Overview
- Requirements
- Features
- Steps to Configure Event Sync to Splunk Integration Download the integration code from here.
Overview
Customers using Splunk Enterprise can leverage this integration to send real time zero trust alerts using webhooks and maintain full payload parsing using json defined fields. The Splunk HTTP Event Connector capability allows inbound webhook json payload to be parsed and tagged with a source type to allow for dashboards and triggers to be leveraged in workflows.
Support Statement
-
NOTE: This documentation is provided "as is" without support for 3rd party software. The level of support for this integration guide is best effort without any SLA on response time. No 3rd party product support can be provided by Superna directly. 3rd party components require support contracts
Limitations
- HTTPS with un-signed certificates is the default configuration and certificate checking has been disabled in this sample code.
Solution Overview
Superna Defender Zero Trust API is the cornerstone technology used to integrate with SIEM, SOAR and XDR platforms. Automation begins with data that summarizes the threat and places that information into a security tools to be acted on by Secops and run playbooks to protect corporate IT assets from vulnerabilities and insider or external attackers. In order to allow a Splunk to act on the data it must be parsed. The Splunk platform can dynamically extract fields that are encoded in the alert payload and exposed inside the index. The example code shows how to take a subset of the fields available in the Superna Zero Trust alarms and have them exposed to the index as key value pairs.
What is Splunk Enterprise?
Enables you to search, analyze, and visualize the data gathered from the components of your IT infrastructure or business. Create triggers and workflows and dashboards to monitoring critical infrastructure.
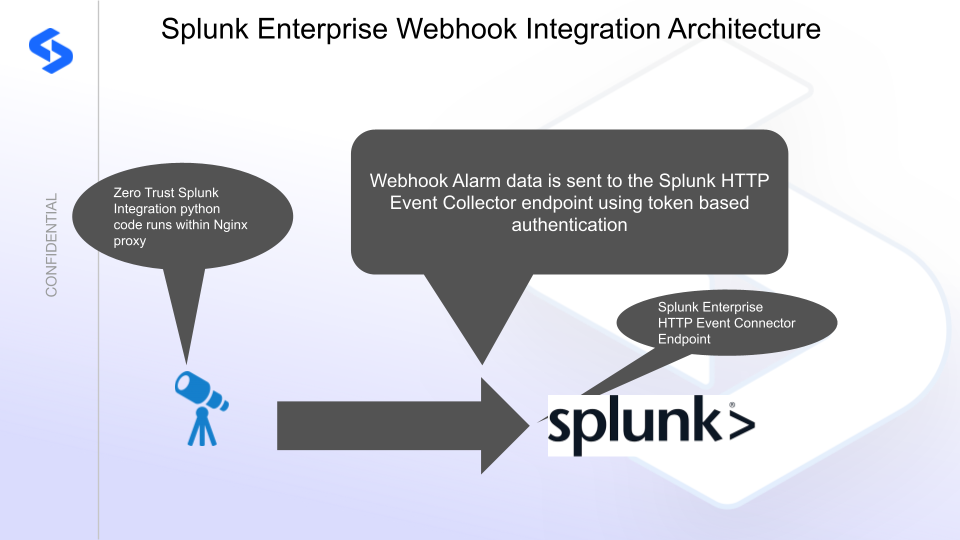
Integration Architecture
Solution Configuration in Splunk Enterprise and Defender Zero Trust
Prerequisites
- Installed Ransomware Defender and or Easy Auditor or Defender for AWS
- Eyeglass OS appliance version 15.5
- cat /etc/os-release
- License key for the Zero Trust API
Configuration in Splunk Enterprise
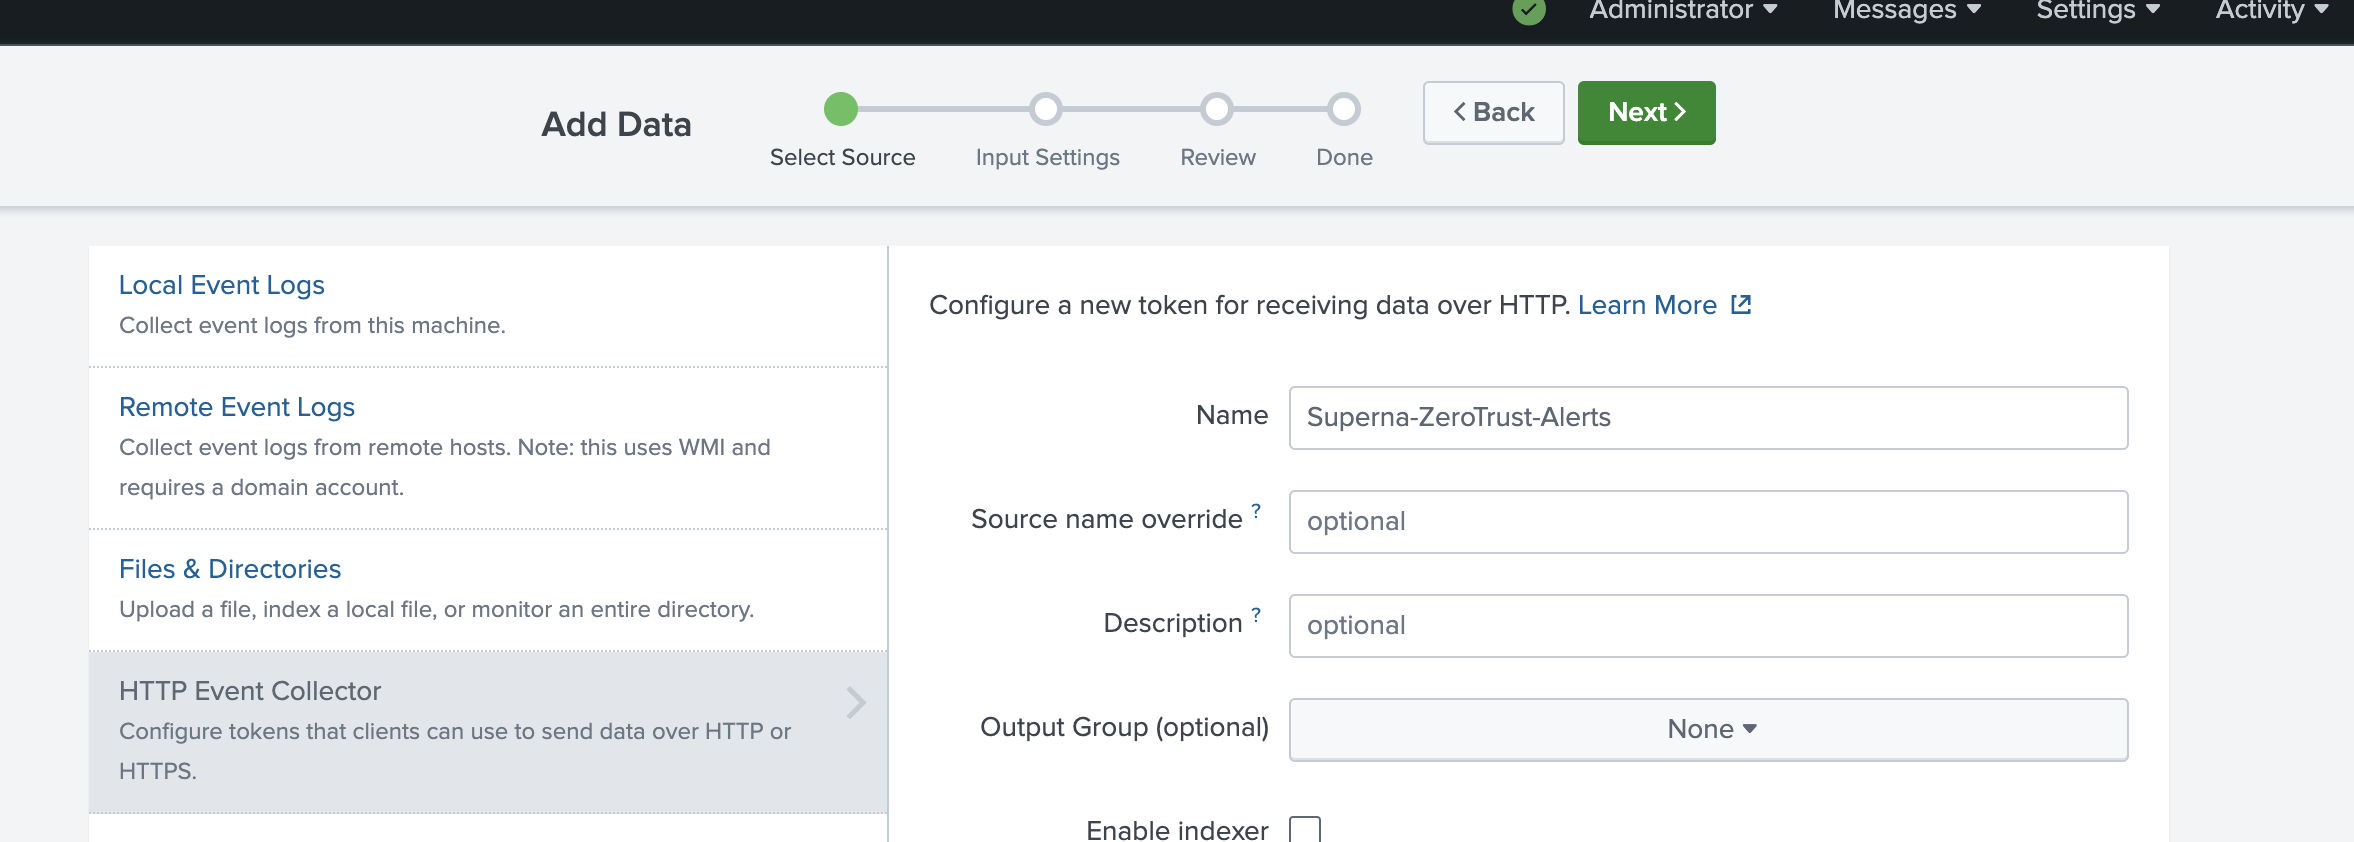
- Login to the console and select Settings --> Data Input --> HTTP Event collector.
- Fill in the Fields as per the below image.
- Enable all indexes and set the default to Main
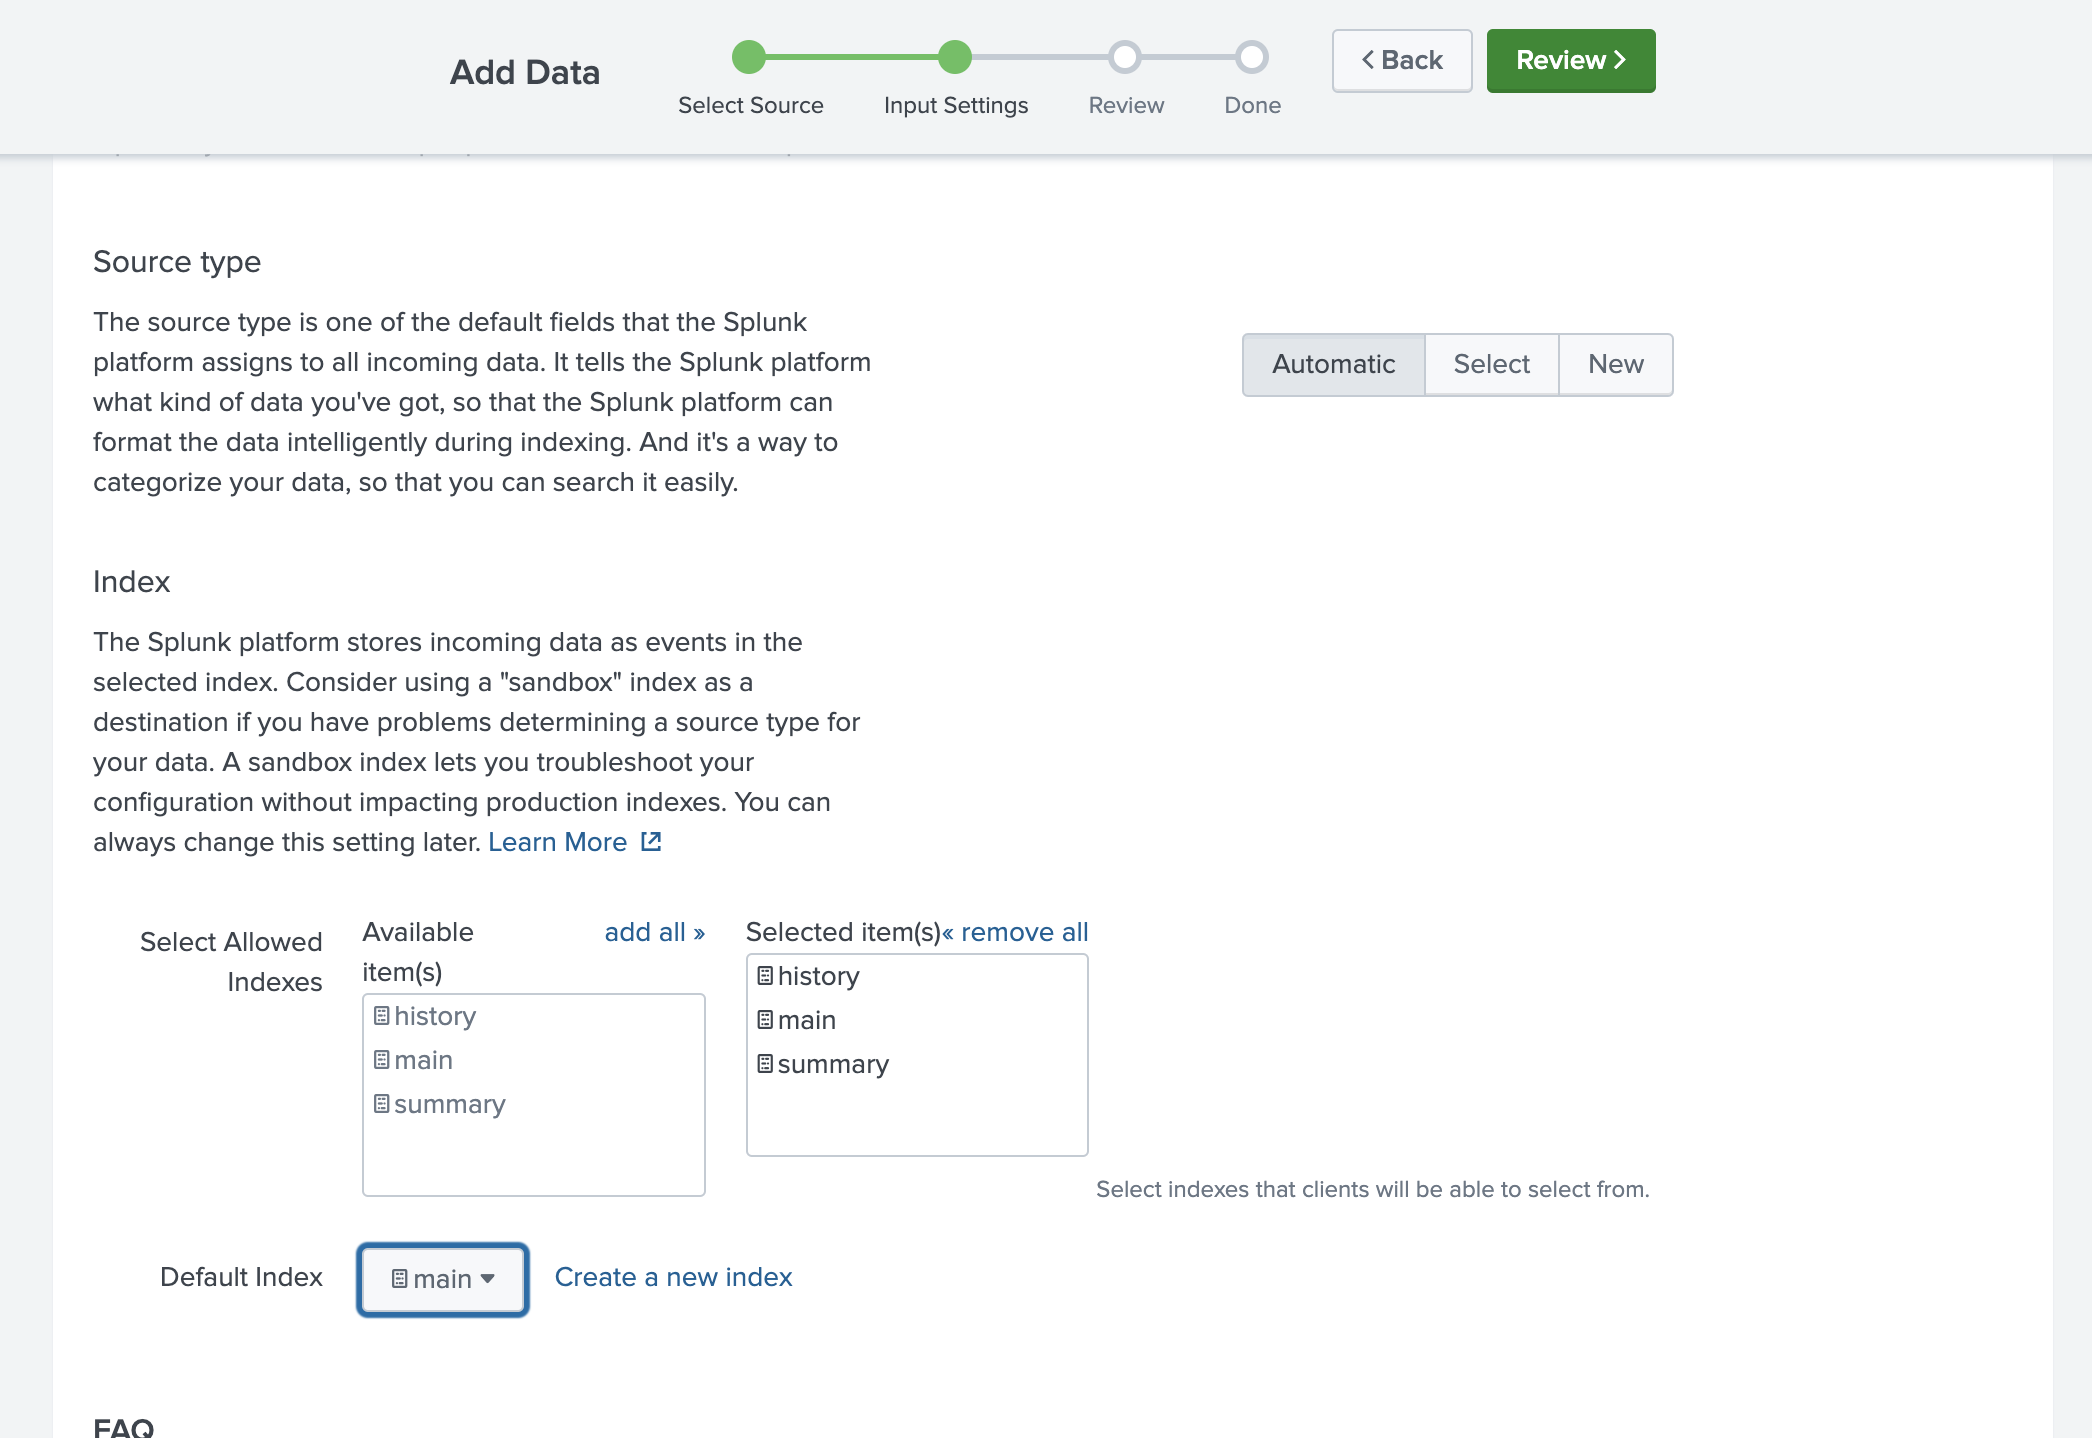
- Click submit
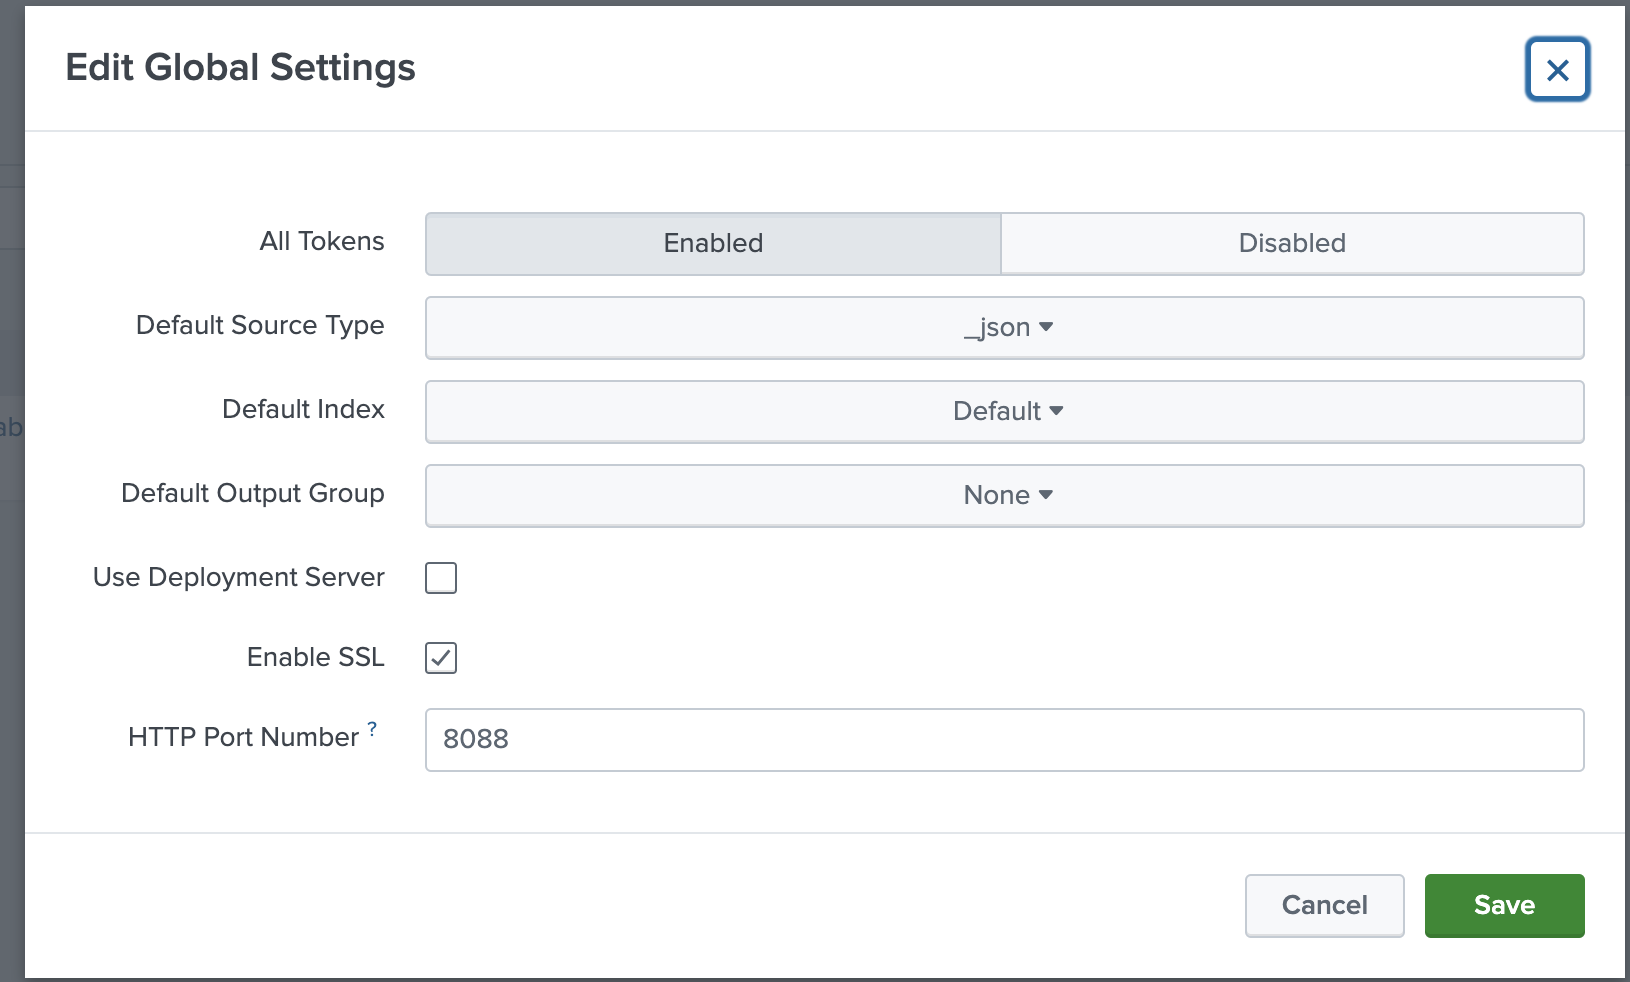
- Go back to Data Inputs --> HTTP Event Collector Screen and click Global Settings
- Set the default Source Type to _json
- Click Enable All Tokens
- Click Save
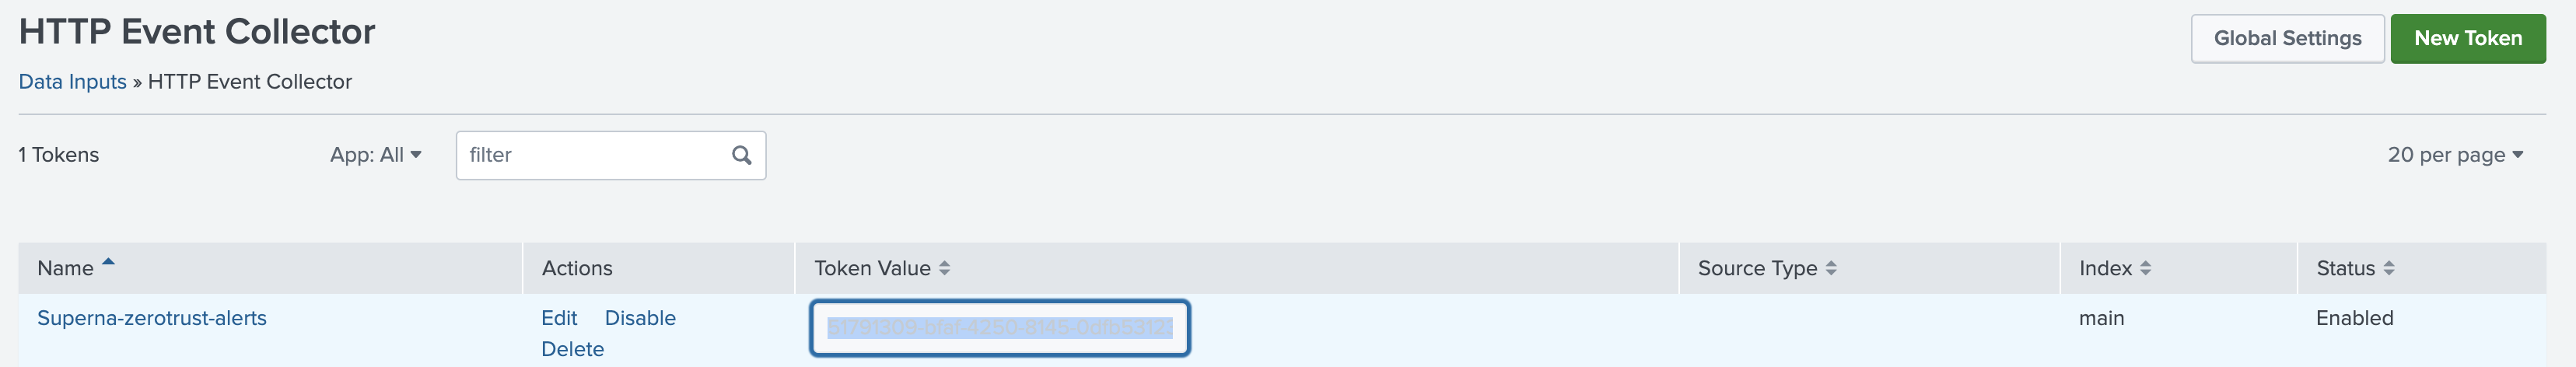
- On the list of HTTP Event Tokens record the token to be used with the python code. Click the token field to copy the value.
Configuration Steps on Eyeglass Virtual Machine
High Level steps
- Create python location to run the application on the Eyeglass vm
- Create python main application script
- Create linux systemd service and set to auto start
- Create Zero Trust configuration in Defender
- Update the main script to customize with Splunk Enterprise python code
- Test the script is running as a service
- Create a test event in Defender to validate the alerts appear as indexed parsed events in Splunk Enterprise
Configuration Step by Step
Configure the Service start and python integration files
Configure the python packages and customize the splunk integration python code
- Customize the application code by downloading the python code from this link to download
- Open the python template file in a text editor. NOTE: make sure to only replace the values and do not delete any of the commas
- Locate this section in the file
- SPLUNK_HEC_TOKEN = 'xxxxxxxxxxxxxxxx'
- SPLUNK_HEC_URL = 'https://yyyyyyyyyyyyyy:8088/services/collector/event'
- Replace the xxxxx with the HEC token recorded from the steps above and replace yyyy with the IP address of the Splunk server running the HTTP Event Collector
- Paste the updated script into the production file
- nano /opt/superna/cgi-bin/splunk.py
- Open the file locally in Windows OS notepad and use control-A or select all the text.
- Paste the clipboard into the ssh terminal session with the open nano editor file
- save the file
- press control+x
- Answer yes to save and exit the nano editor
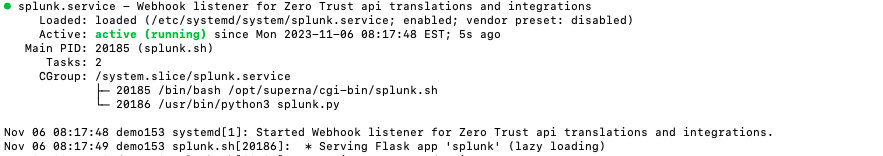
- Start the service and verify it is running
- systemctl start splunk
- systemctl status -l splunk
- Verify the service is started successfully and returns "active and running".
- If the service does not start do not proceed and double check the steps above are completed.
Configure Defender Zero Trust Webhooks
- The next step creates an Zero Trust Webhook URL.
- Configure Zero Trust endpoint in Ransomware Defender Zero Trust tab.
- Recommended Configuration: Only Critical and Major events and only the webhooks that set lockout or delayed lockout. Customers can customize based on specific requirements. The goal is to send findings versus a list of alarms that do not pinpoint a security incident.
-
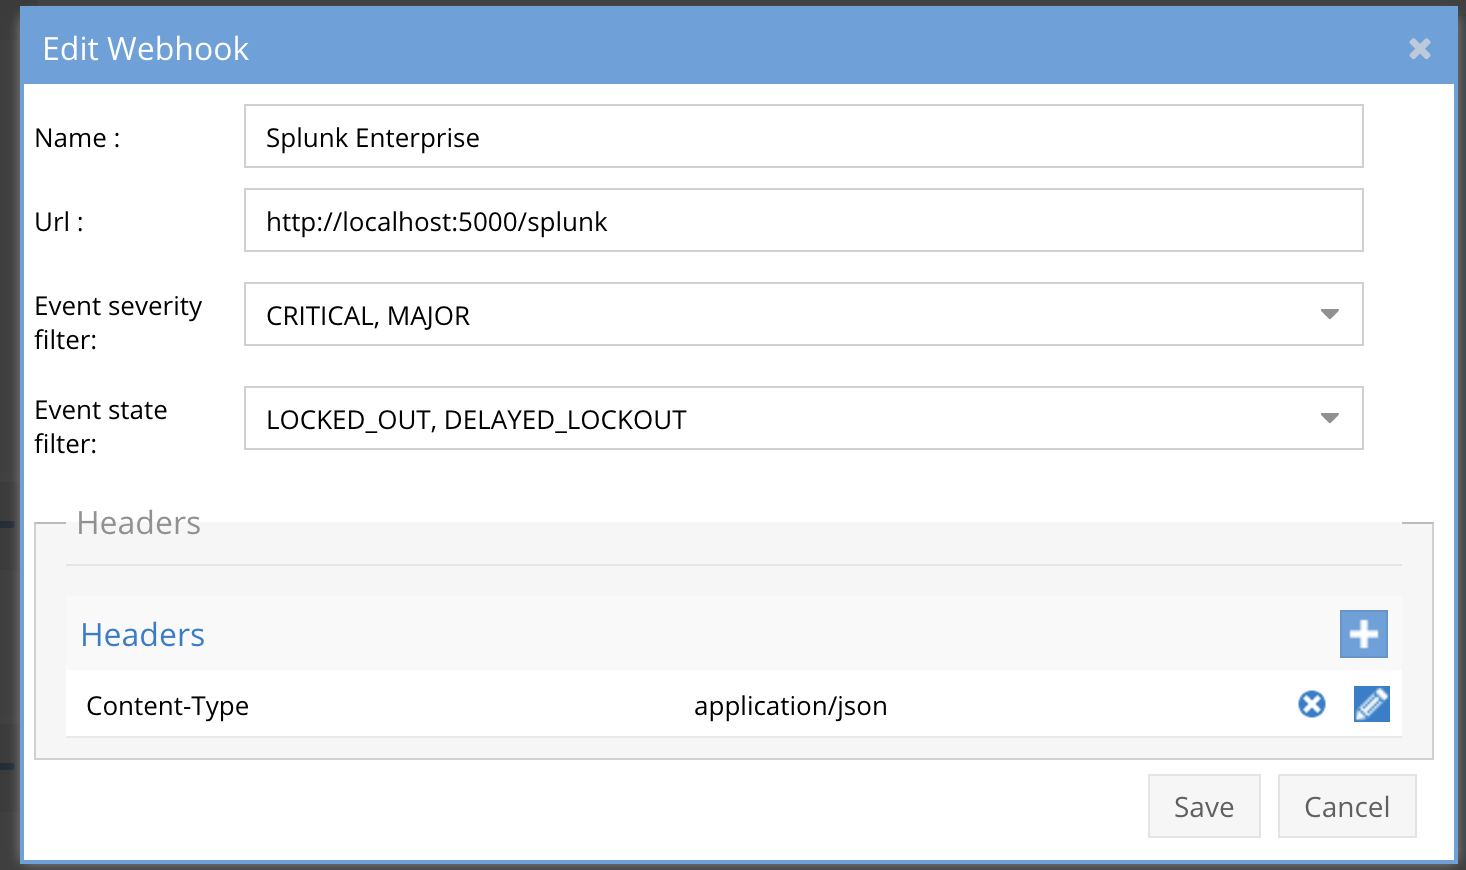
- The endpoint url above will use localhost and will send Webhooks to the application service listening on port 5000. URL to use in the configuration
- http://localhost:5000/splunk
- Add the Content-Type header with value of application/json as shown above to complete the webhook configuration.
- Click save to commit the configuration.
- Click save on the main Webhook configuration page
- Configure Zero Trust endpoint in Ransomware Defender Zero Trust tab.
- Test the configuration is working following the next section
How to test the Integration with Splunk Enterprise
- To test the integration follow these steps
- download this curl command template and open with a text editor
- Copy all the text
- ssh to the eyeglass vm as the admin user
- paste the entire cli command to the ssh prompt to send sample data to the running Zero Trust application. This will send test data directly to the application to be processed and sent to Splunk Enterprise.
- The output of a successfully processed webhook test will return this text in the ssh terminal
- done sending event to Splunk and check for http 200 and success count in response
- How to review the process logs from the web application
- sudo -s
- journalctl -f -u splunk
- This allows you to view the logs generated by the application.
- To log to a file and review with nano showing only the most recent 250 lines.
- journalctl -f -n 250 -u splunk > /tmp/ztwebhook.log
- nano /tmp/splunk.log
- In the log below the response code from the Splunk Enterprise api call should show http 200 status code and successCount 1 to indicate the Finding was successfully created.
- You can also view splunkd.log for specific error messages.
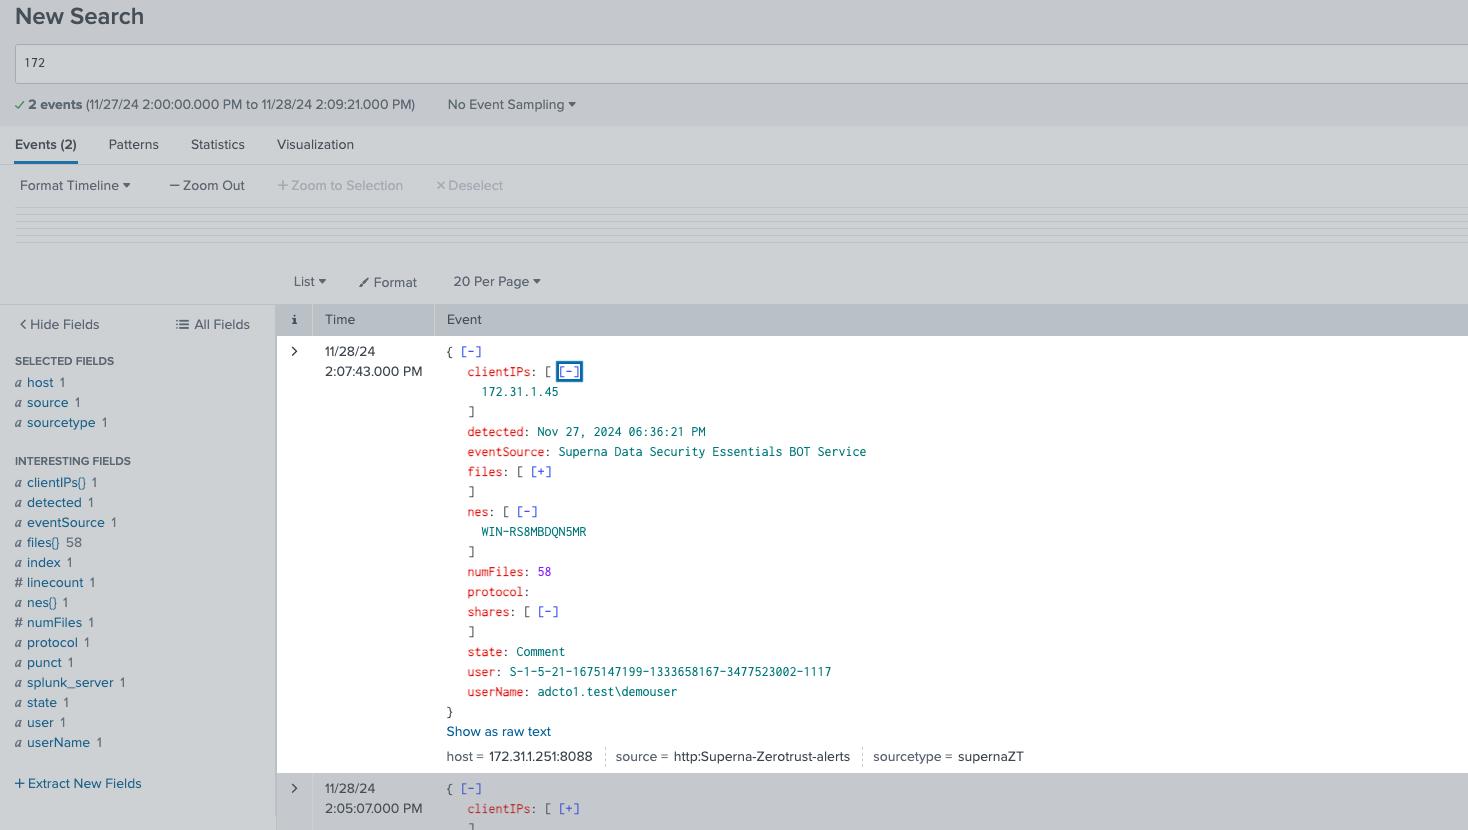
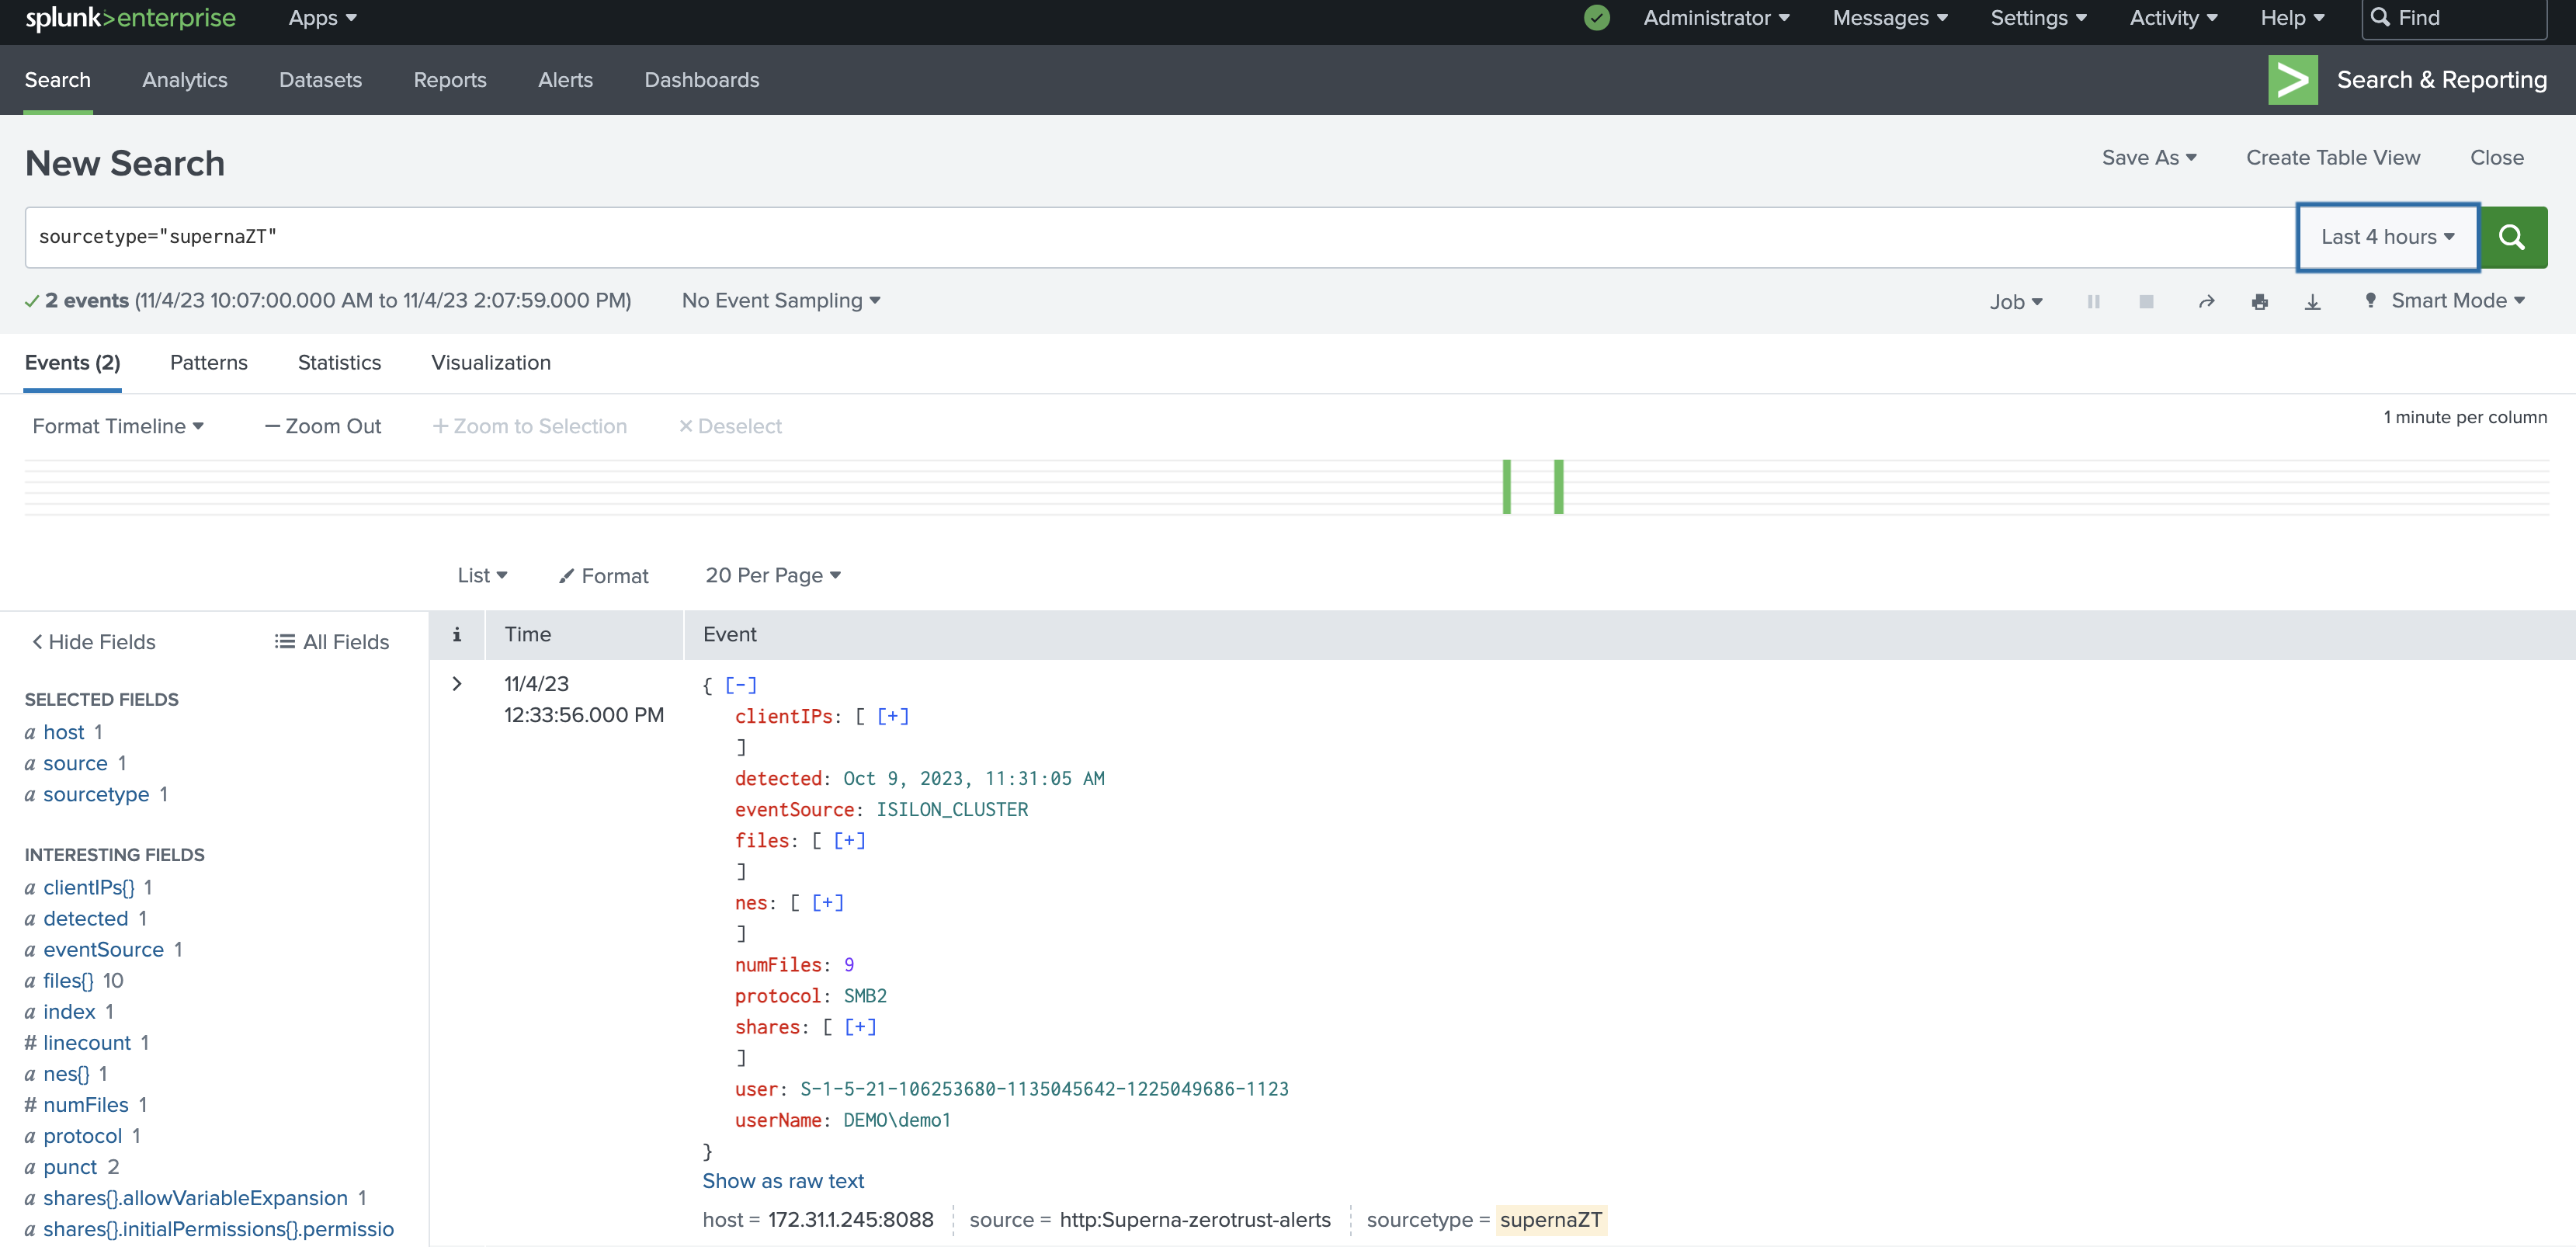
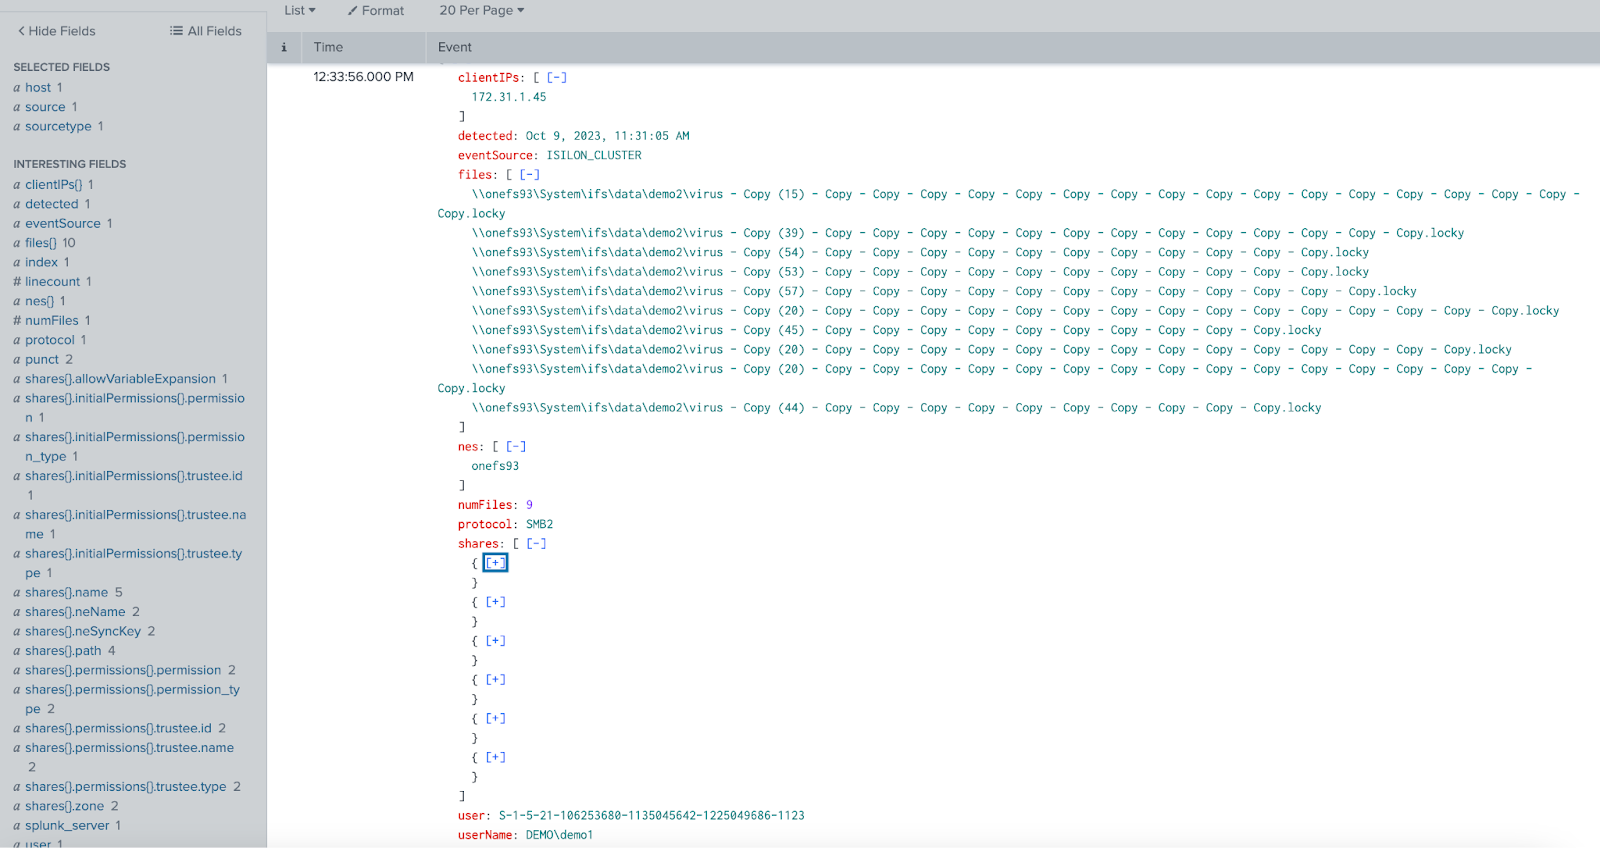
- Login to the Splunk Enterprise Main Dashboard to run a search for all supernaZT source messages. enter a search with sourcetype="supernaZT" to locate events sent from testing.
-
- Done
Splunk Enterprise SecOps administrators Integration Experience
- Once the integration has been tested, it is possible to build triggers from indexed parsed zero trust fields.
How to Configure Data Security Essentials
Overview
Data Security Essentials saves alerts to the Windows Event log to a custom application log. This integration will extract the log entries and the json payload contained within them and format as webhook data to send to Splunk to endpoint provided by Splunk HEC endpoint.
Requirements
- Follow the Splunk integration steps above to configure the Scripted REST API endpoint integration.
- Install python for Windows on the Data Security Essentials host and allow the installation to add python to the path variable. https://www.python.org/downloads/windows/
- NOTE: Ensure it's installed for all users so service accounts have access, by enabling for all users during installation.
- The integration code matches event log entries from Custom trigger BOT policies and File management policies
- The event log source names are below
- Superna Data Security Essentials BOT Service
- Superna Data Security Policy Engine
- The event log source names are below
Features
- Logs for each execution are stored in the path below along with the python code.
- Each execution will store the event log record ID and date time and event number of the last processed event in a file called last_processed_record.txt. This file is read on each execution to continue processing from last record. The record number is not visible in Event Viewer, the date time and event number can be used to understand where in the log the last processing occurred.
- The schedule sync runs every minute and only processes events since the last record and logs all processing as well as event matches in the log file for debugging.
- Only events that match the severity filter will be processed for client ip address. The sample code defaults to Major and Critical severity events all other severities will be ignored.
Steps to Configure Event Sync to Splunk Integration Download the integration code from here.
- Modify the python and update the Splunk integration settings highlighted in yellow to match your environment.
- #Splunk HEC authenticationSPLUNK_HEC_TOKEN = 'xxxxxxx'SPLUNK_HEC_URL = 'https://yyyyyy:8088/services/collector/event# Configurationserver = 'localhost'log_name = 'Data Security Essentials'source_names = ['Superna Data Security Essentials BOT Service', 'Superna Data Security Policy Engine']trigger_severities = ['MAJOR', 'CRITICAL','WARNING'] # Configure severities that should trigger event forwarding
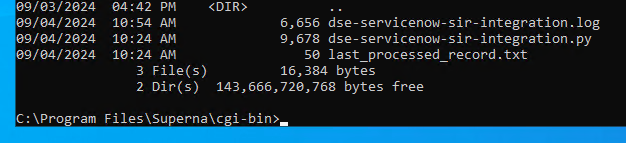
- Copy the Python code into C:\Program Files\Superna\cgi-bin on the Data Security Essentials host and name the file splunk-dse.py
- Install python dependancies
- MANDATORY Step: Open a command prompt as the service account (hold down shift and right click the command prompt icon) run as option to login as the service account dse-service. This is required to install the python packages under the correct user account.
- Install the dependencies with this command
- pip install pywin32 requests
- This command installs the windows API python libraries needed to read the event log.
- Test the script can correctly reach your Splunk instance from a dos prompt
- cd C:\Program Files\Superna\cgi-bin
- python splunk-dse.py
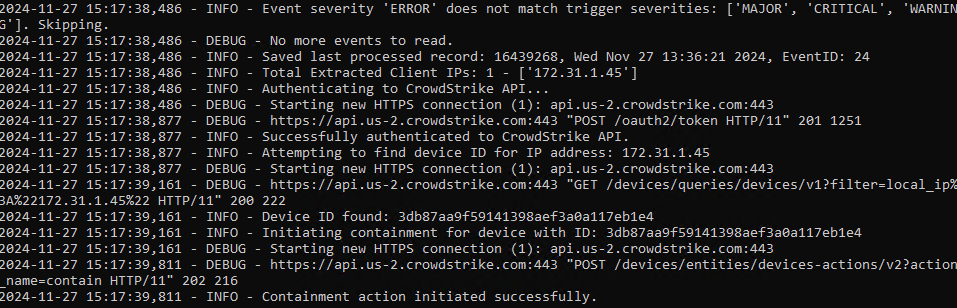
- The output should display event log entries that match and will ignore severities that do not match script settings . It will display the event payload details in json format and will show the data that was sent to the Splunk endpoint.
- Example output
- You can also review this file last_processed_record.txt to see the last date and time within the event log and event id that was last processed. This file can be deleted to have the script start reading from the oldest windows event log entry. This can be done for testing puposes.
- The above examples shows the output when a client ip address is successfully located and the host containment api returns success.
- The example below is logged when event data is processed and inspected for severity and forwarded with key fields parsed and extracted.
- Steps to Schedule sync alerts into Splunk Security Incidents
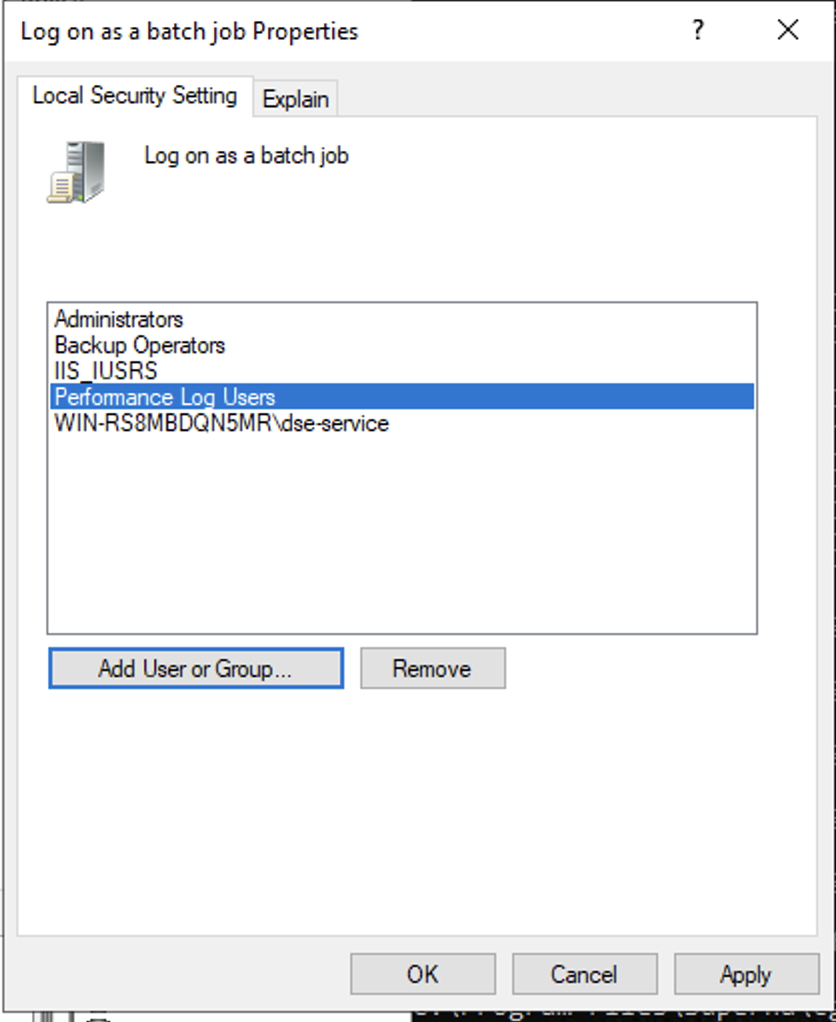
- Open secpol.msc, Local policies
- Give the Data security essentials AD service account the "Logon as a batch job" OS permission.
- Create a file
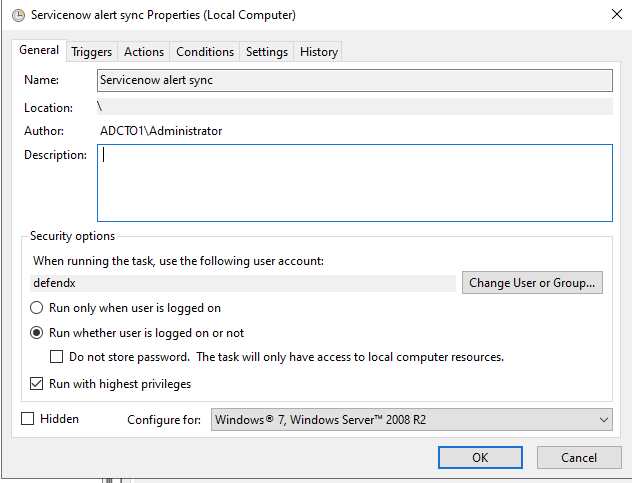
- Right click this link to save to a file. The task scheduler XML file to import into Task Scheduler
- You can rename the xml from Servicenow alert sync.xml to Splunk integration.xml.
- Open Task Scheduler
- Run taskschd.msc, right click task schedule library

- Import the xml file
- You will be prompted with the task definition, you will need to change the service account to match your service account name and domain and re-enter the password to save the task scheduler. All other settings are configured and match the path and settings used above. Adjust any parameters that you changed if you did not use all the steps above.
- Edit the name "Splunk integration"
- Click the Actions tab and browse to select the file C:\Program Files\Superna\cgi-bin\splunk-dse.py
- Click ok to save
- done.