- Microsoft Network Load Balancing Operation
- PowerShell Commands
- NLB Manager UI
- DR Dashboard
- Failover Log
- Eyeglass Upgrade
Microsoft Network Load Balancing Operation
NLB status monitoring and stop / start /suspend /resume operations can be done through Powershell commands or NLB Manager UI
PowerShell Commands
We can run some PowerShell commands to monitor the status of NLB and to perform operations.
Executing NLB PowerShell commands requires to import module : NetworkLoadBalancingClusters
Example:
Windows PowerShell
Copyright (C) Microsoft Corporation. All rights reserved.
PS C:\Users\Administrator> Import-Module NetworkLoadBalancingClusters
PS C:\Users\Administrator> Get-NlbClusterNode
Name State Interface HostID
---- ----- --------- ------
dg-win52 Converged Ethernet0 3
dg-win51 Converged(default) Ethernet0 1
For complete NLB PowerShell Command refer to this Microsoft document
https://learn.microsoft.com/en-us/powershell/module/networkloadbalancingclusters/?view=windowsserver2022-ps
The most commonly used commands for operation / monitoring:
PowerShell Command | Description |
Get-NlbClusterNode | Gets information about a node object or the NLB cluster object that is queried by the caller. Including the State information of cluster node |
Get-NlbCluster | Gets information about the NLB cluster object that is queried by the caller. (Cluster IP Address, Subnet Mask, Mode) |
Get-NlbClusterNodeNetworkInterface | Gets information about interfaces, including information about the NLB driver, on a host. |
Stop-NlbClusterNode | Stops a node in a NLB cluster. |
| Start-NlbClusterNode | Starts a NLB cluster node. |
| Suspend-NlbClusterNode | Suspends a specific node in a NLB cluster |
| Resume-NlbClusterNode | Resumes a node in a NLB cluster |
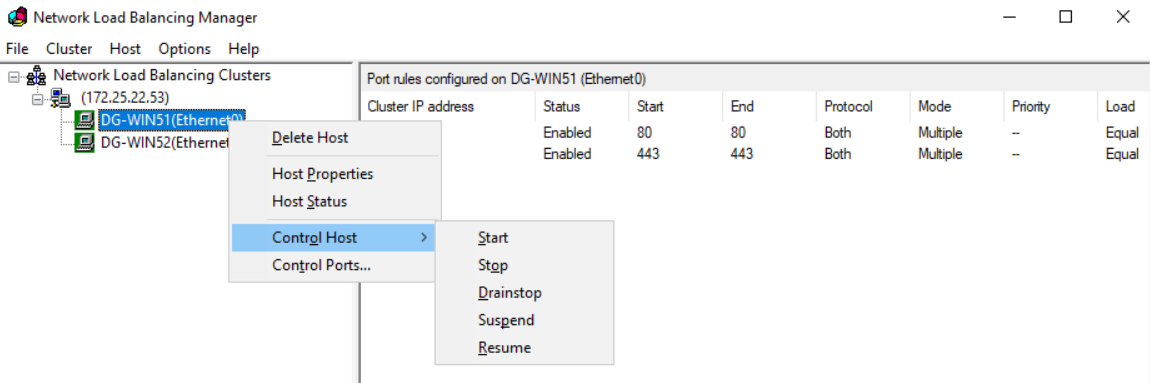
NLB Manager UI
Open NLB Manager UI to perform the following Host Control operations:
Stop / Start / Suspend / Resume Node
Eyeglass DR
DR Dashboard
The DR Dashboard is the main status screen for overall PowerScale cluster readiness for a DR event. The DR Status column of this DR Dashboard displays the Readiness validation for Failover.
- Click DR Dashboard icon from Eyeglass Web UI
- Select type of Readiness. For DFS Mode Failover, select DFS Readiness. Check DR Failover status column to view readiness
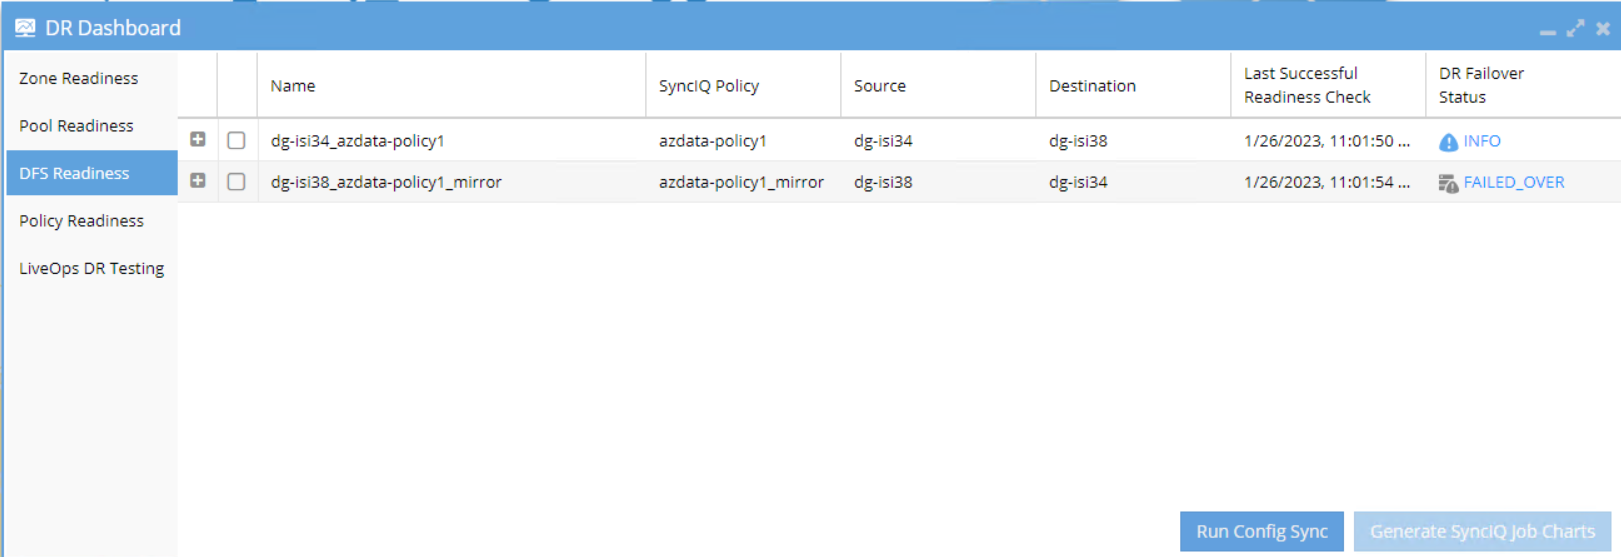
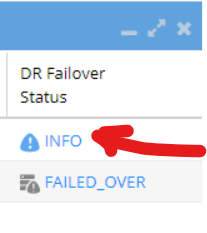
- Click the Status of the configuration that we want to check under DR Failover Status column of to view the DR Readiness validation details for that particular configuration
- And the detailed Readiness validation window will be displayed. We can expand the list by clicking “+” sign to drill down further details

Failover Log
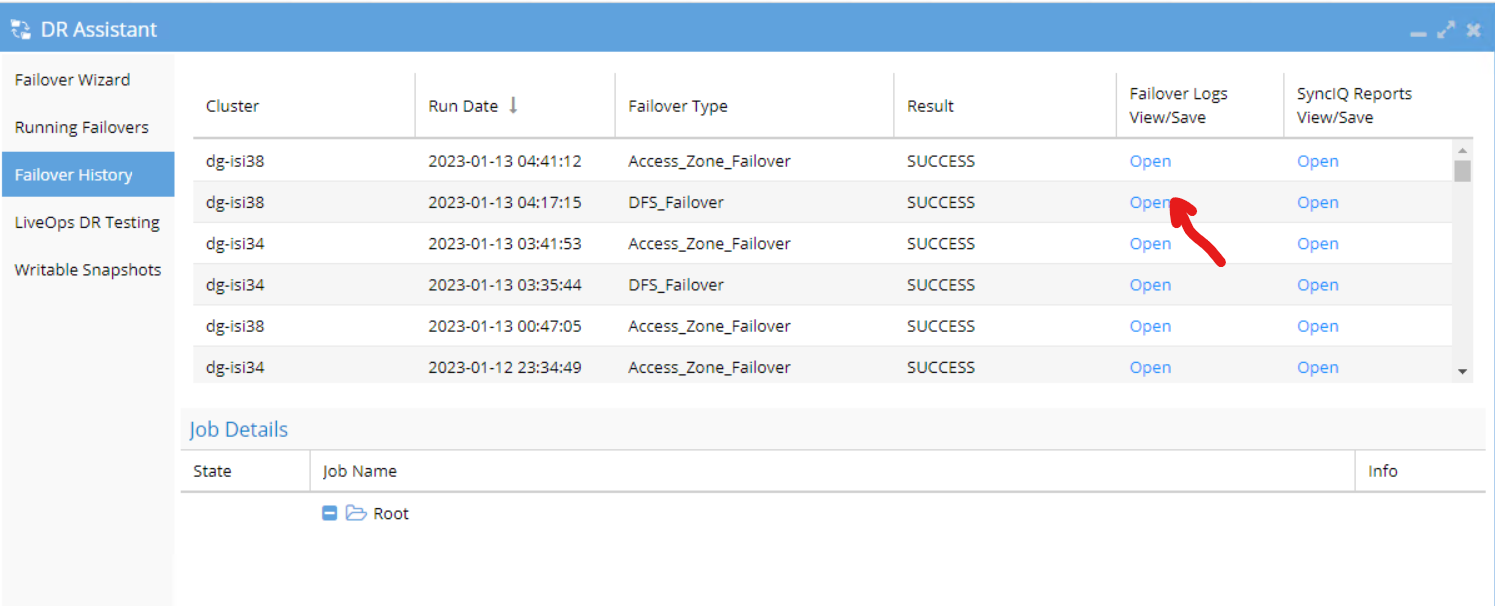
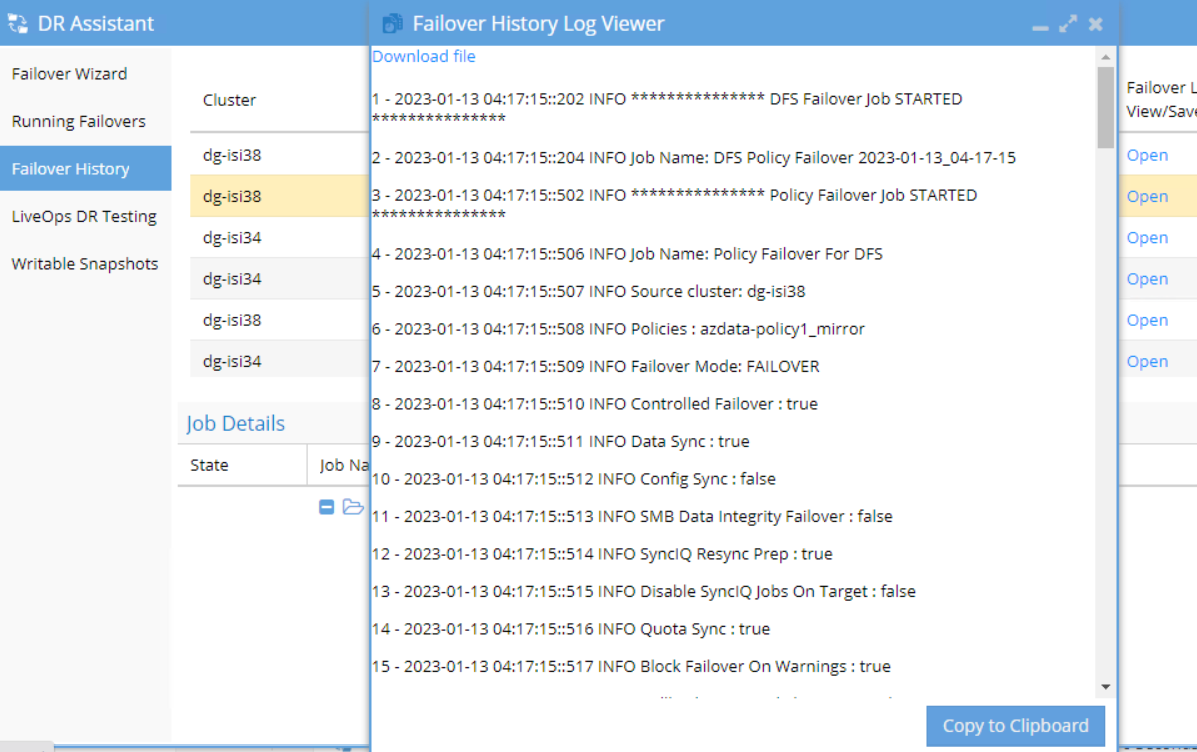
- The Failover Logs can be found by clicking on the DR Assistant on the Eyeglass desktop.
- Click on the Failover History tab, to see the list of the past Failover jobs. By clicking on an individual job, the details of that job will appear in the window below (see screenshot below).
Eyeglass Upgrade
Refer to the Eyeglass Upgrade guide document.