Eyeglass Solutions Publication
ADAF - Operation Guide
Home
Eyeglass DR
DR Dashboard
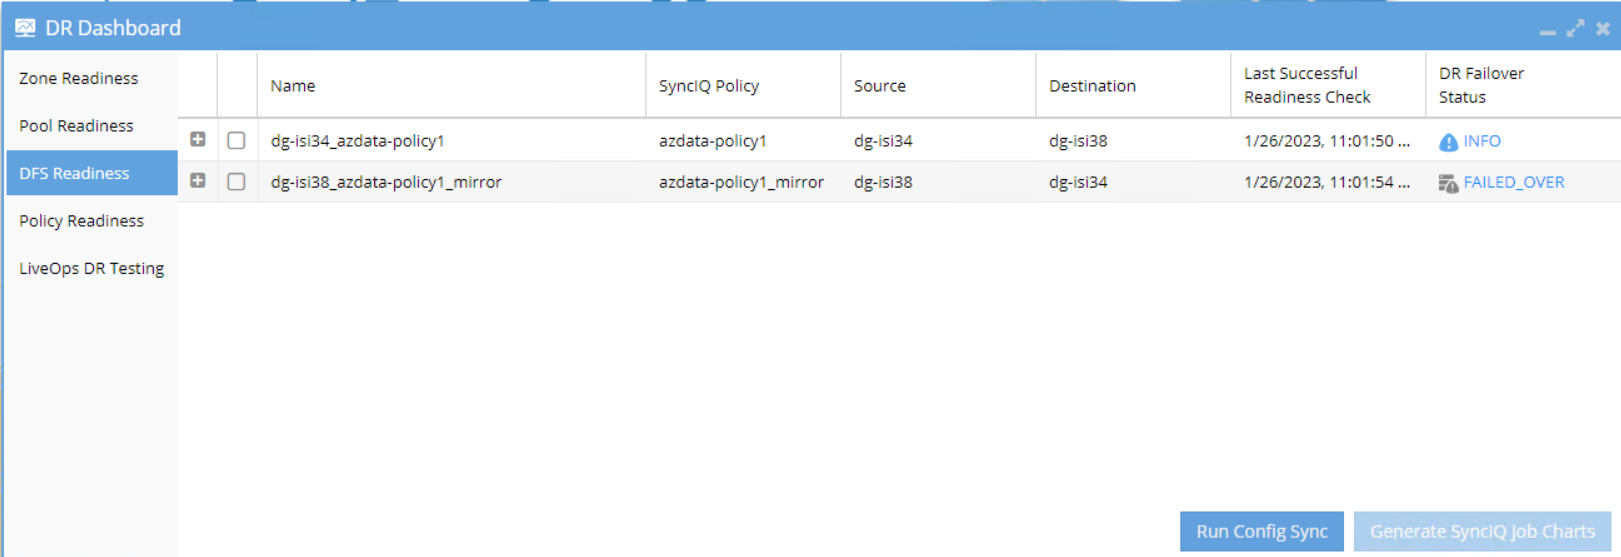
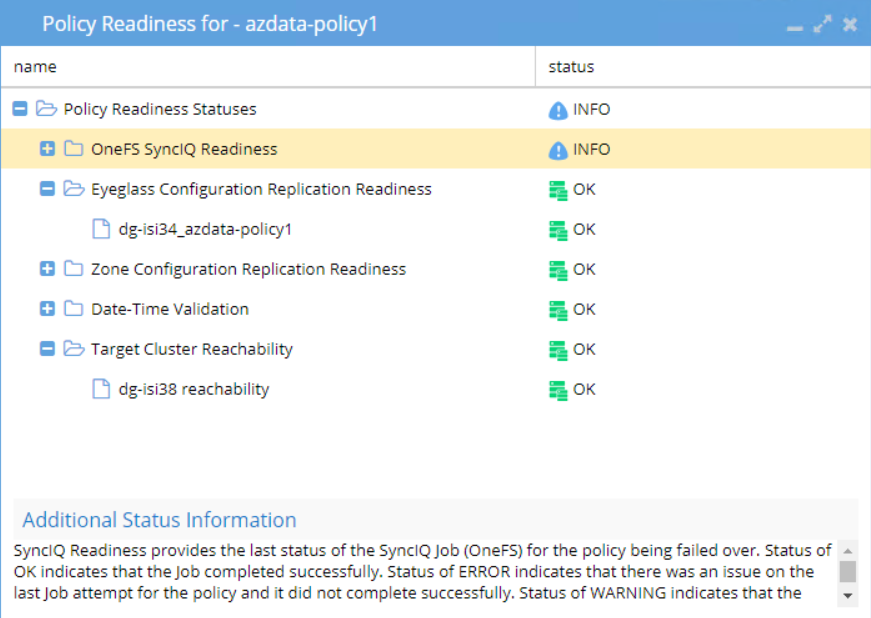
The DR Dashboard is the main status screen for overall PowerScale cluster readiness for a DR event. The DR Status column of this DR Dashboard displays the Readiness validation for Failover.
- Click DR Dashboard icon from Eyeglass Web UI
- Select type of Readiness. For DFS Mode Failover, select DFS Readiness tab. Check DR Failover status column to view readiness
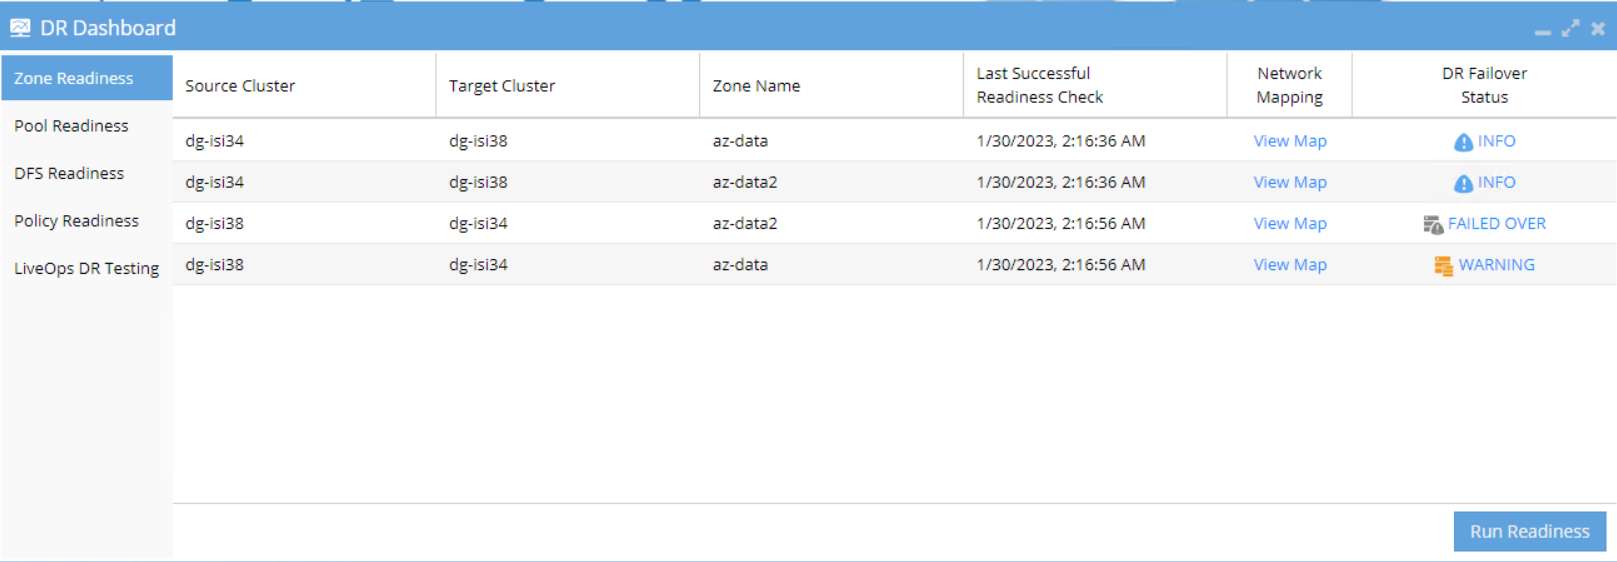
- For Access Zone Failover Readiness, select Zone Readiness tab. Check DR Failover status column to view readiness
- Click the Status of the configuration that we want to check under DR Failover Status column of to view the DR Readiness validation details for that particular configuration
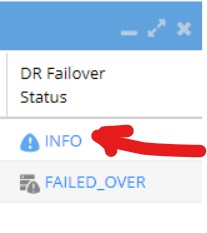
- And the detailed Readiness validation window will be displayed. We can expand the list by clicking “+” sign to drill down further details
Failover Log
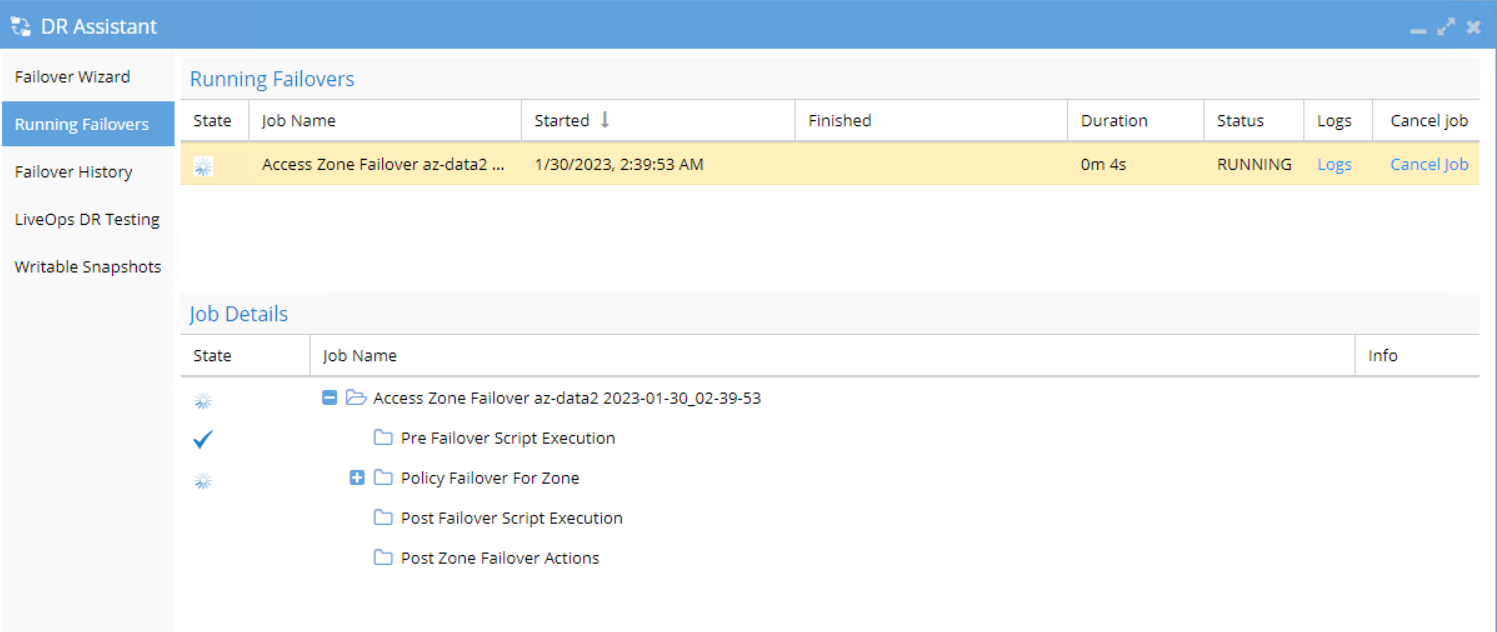
- The Failover Logs can be found by clicking on the DR Assistant on the Eyeglass desktop.
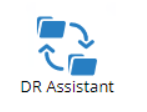
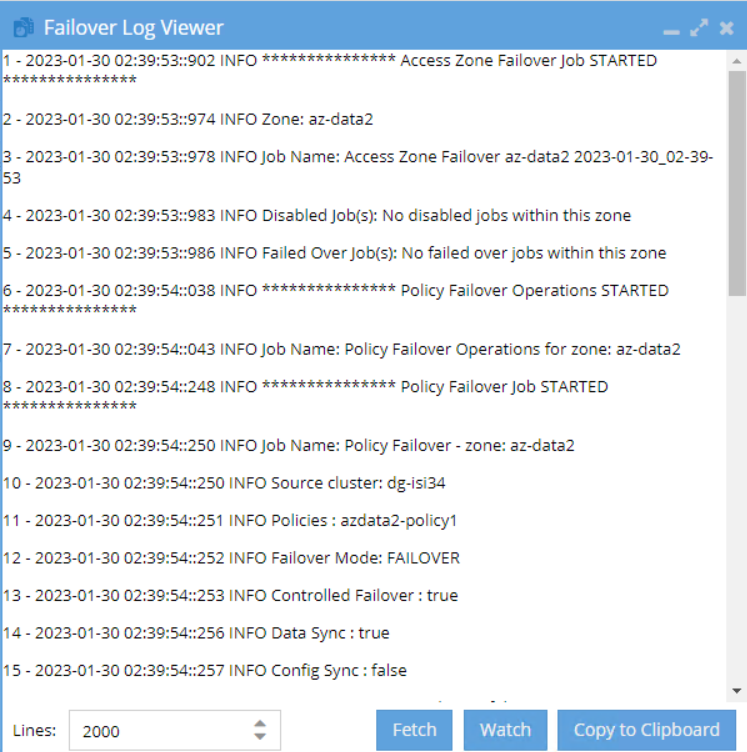
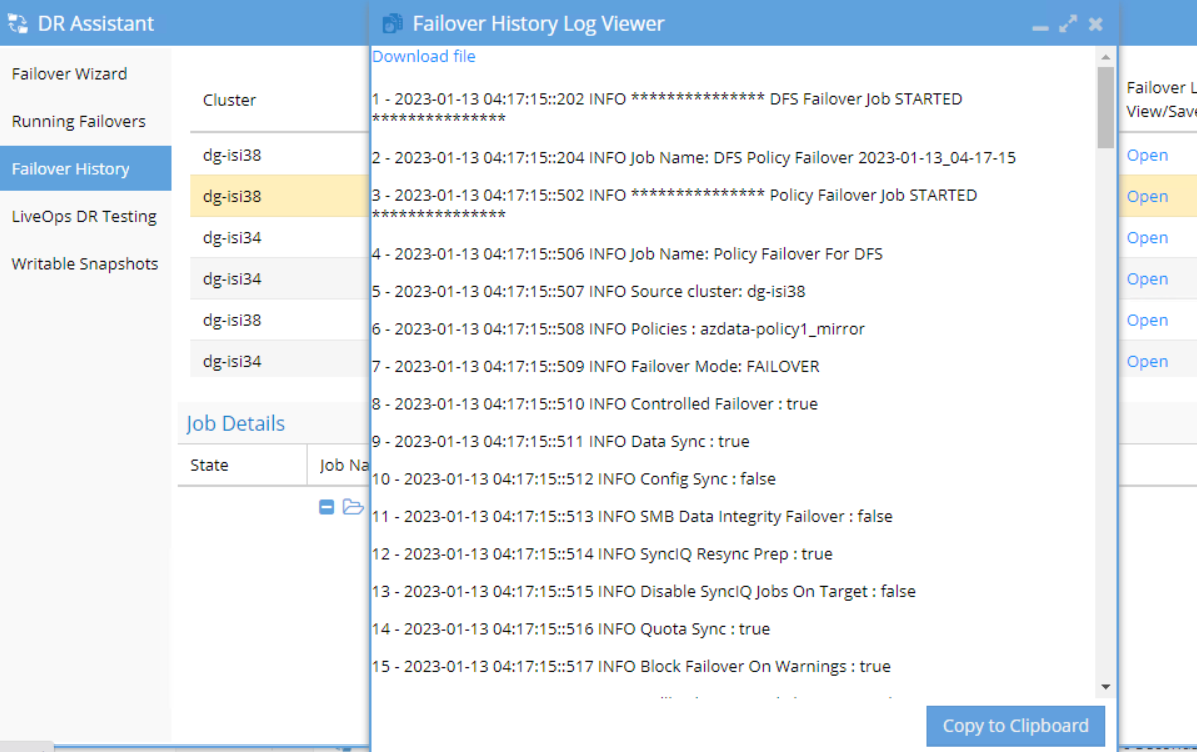
- Click on the Running Failovers tab, to monitor the running Failover jobs. Click Logs link under Logs column to open Failover Log viewer.
- Click Fetch button to refresh the Log viewer with updated log
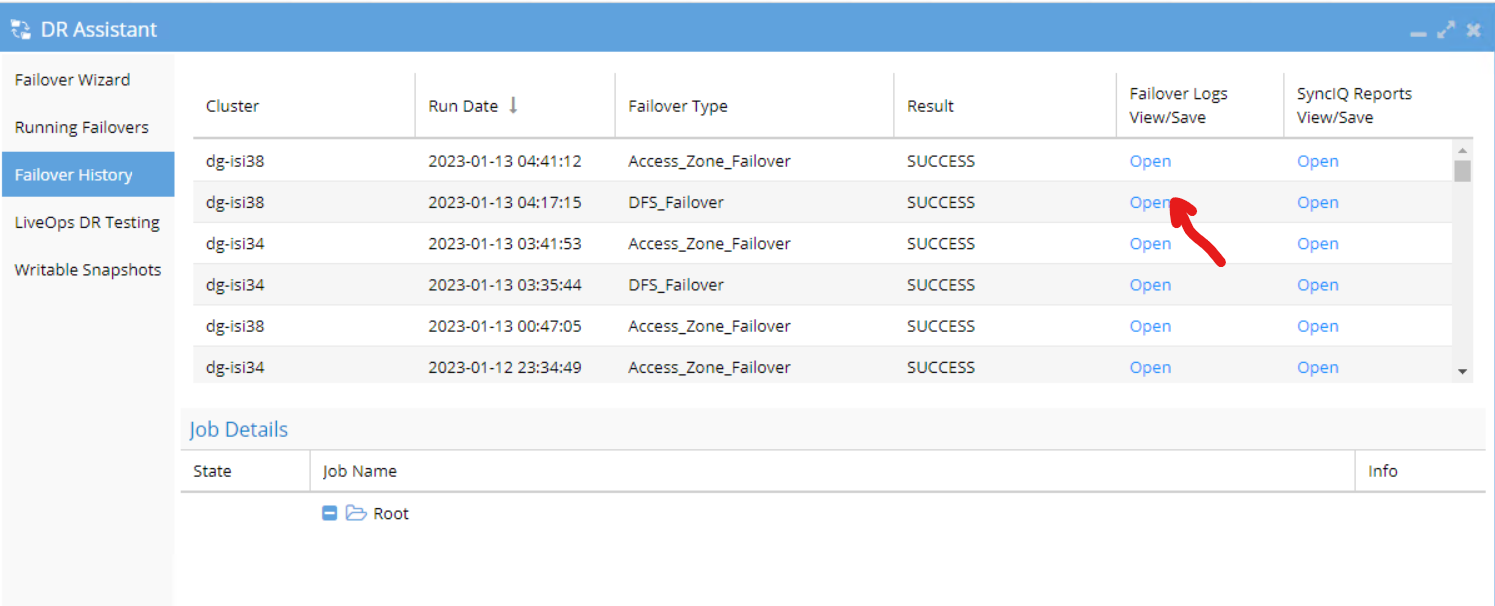
- For checking the past Failover jobs, click on the Failover History tab from DR Assistant Wizard Window. By clicking on an individual job, the details of that job will appear in the window below (see screenshot below).
Eyeglass Upgrade
Refer to the Eyeglass Upgrade guide document.