Sumo Logic SIEM Zero Trust Alert Integration
- Overview
- Support Statement
- Limitations
- Solution Overview
- Advanced Zero Trust Capabilities
- What is Sumo Logic SIEM?
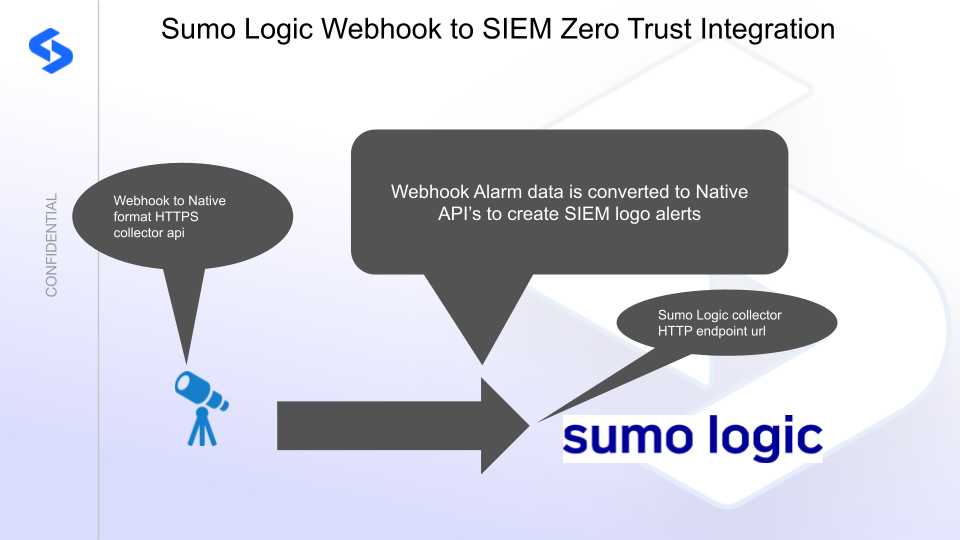
- Integration Architecture
- Solution Configuration in Sumo Logic SIEM and Defender Zero Trust
- Prerequisites
- Configuration in Sumo Logic SIEM
- Configuration Steps on Eyeglass Virtual Machine
- High Level steps
- Configuration Step by Step
- Configure the Service start and python integration files
- Configure the python packages and customize the sumologic integration python code
- Configure Defender Zero Trust Webhooks
- How to test the Integration with Sumo Logic SIEM
- Sumo Logic SIEM SecOps administrators Integration Experience
- How to create an Alert Monitor
Overview
Customers using Sumo Logic SIEM solution can now leverage a native integration that initiates native ingestion API alerts from Security Editions zero trust alerts. Customers can augment the capabilities of Sumo Logic SIEM with threat intelligence and Cyber Storage capabilities of Superna Security Edition.
Support Statement
-
NOTE: This documentation is provided "as is" without support for 3rd party software. The level of support for this integration guide is best effort without any SLA on response time. No 3rd party product support can be provided by Superna directly. 3rd party components require support contracts
Limitations
- None
Solution Overview
Superna Defender Zero Trust API receives webhook alerts and parses the key data into a HTTPS API payload events that are sent to the SIEM collector endpoint url. Sumo Logic SIEM (Security Information and Event Management) is a modular architecture that provides real-time visibility of your IT infrastructure, which you can use for threat detection and prioritization.
Advanced Zero Trust Capabilities
- Webhook to native HTTPS collector API alarm integration
What is Sumo Logic SIEM?
Integration Architecture
Solution Configuration in Sumo Logic SIEM and Defender Zero Trust
Prerequisites
- Installed Security Edition
- Eyeglass OS appliance version 15.5
- cat /etc/os-release
- License key for the Zero Trust API
- Sumo Logic SIEM
Configuration in Sumo Logic SIEM
The steps below create a collector endpoint,
Steps to Create an HTTP Source
- Log in to Sumo Logic
- Go to Sumo Logic’s login page.
- Navigate to the “Collectors” Page
- In the left-hand menu, go to:
- Manage Data → Collection → Add Source.
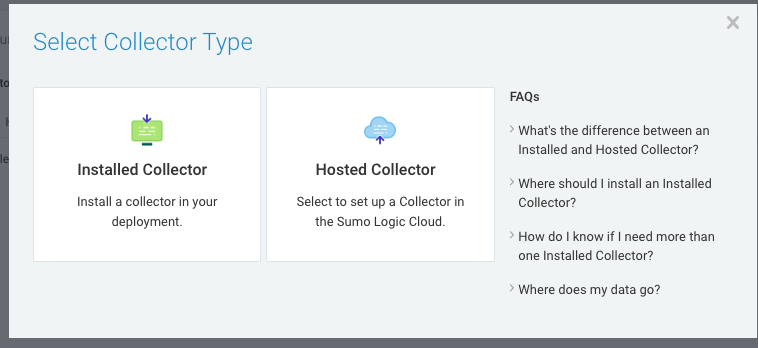
- Select Your Collector
- Click Add Collector to create one.
- Select Hosted Collector (to collect data from an HTTP source)
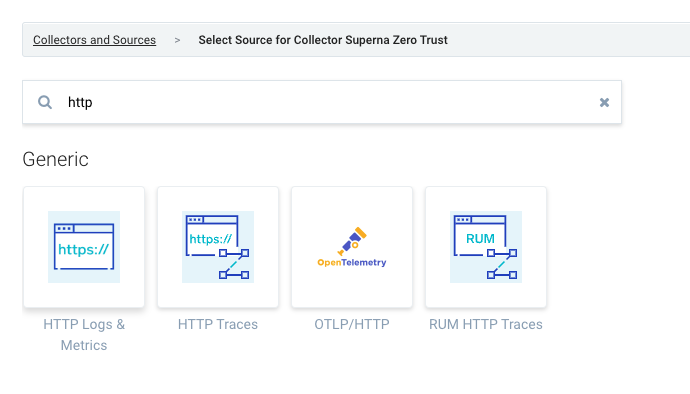
- Add a New HTTP Source
- Click Add Source within your Hosted Collector.
- Select HTTP Logs and Metrics as the source type.
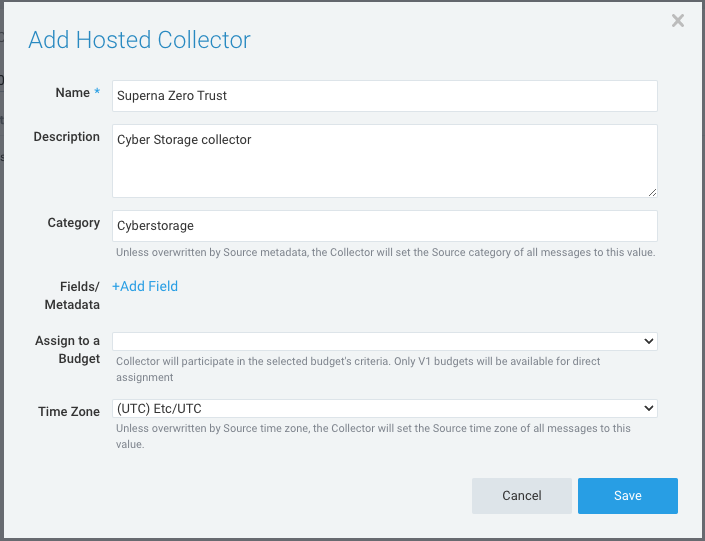
- Configure the HTTP Source
- Name: Enter a descriptive name (e.g., “Webhook Data Ingest”).
- Description: Optional field for notes.
- Source Category: Use a meaningful category, e.g., webhook/sumo_logic.
- Click Save.
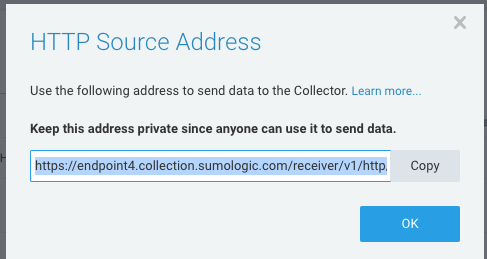
- Copy the HTTP Endpoint URL
- Save this URL to update the integration code below.
- done
Configuration Steps on Eyeglass Virtual Machine
High Level steps
- Create python location to run the application on the Eyeglass vm
- Create python main application script
- Create linux systemd service and set to auto start
- Create Zero Trust configuration in Defender
- Update the main script to customize with Sumo Logic SIEM python code
- Test the script is running as a service
- Create a test event in Defender to validate the alerts appear as indexed parsed events in Sumo Logic SIEM
Configuration Step by Step
Configure the Service start and python integration files
Configure the python packages and customize the sumologic integration python code
- Customize the application code by downloading the python code from this link to download
- Open the python template file in a text editor. NOTE: make sure to only replace the values and do not delete any of the commas
- Locate this section in the file and replace the yellow sections to match your sumologic endpoint URL. The endpoint url is unique and can be copied from the console into the variable below.
- SUMO_LOGIC_URL = "https://endpoint4.collection.sumologic.com/receiver/v1/http/{unique endpoint}"
- nano /opt/superna/cgi-bin/sumologic.py
- Open the file locally in Windows OS notepad and use control-A or select all the text in the python template
- Paste the clipboard into the ssh terminal session with the open nano editor file
- save the file
- press control+x
- Answer yes to save and exit the nano editor
- Start the service and verify it is running
- systemctl start sumologic
- systemctl status -l sumologic
- Verify the service is started successfully and returns "active and running".
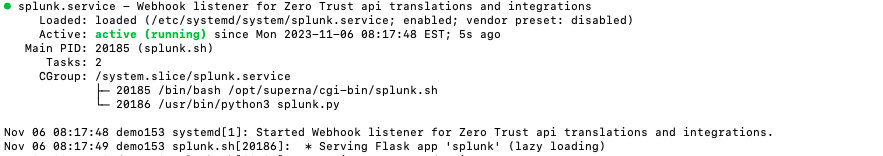
- If the service does not start do not proceed and double check the steps above are completed.
Configure Defender Zero Trust Webhooks
- The next step creates an Zero Trust Webhook URL.
- Configure Zero Trust endpoint in Ransomware Defender Zero Trust tab.
- Recommended Configuration: Only Critical and Major events and only the webhooks that set lockout or delayed lockout. Customers can customize based on specific requirements. The goal is to send findings versus a list of alarms that do not pinpoint a security incident.
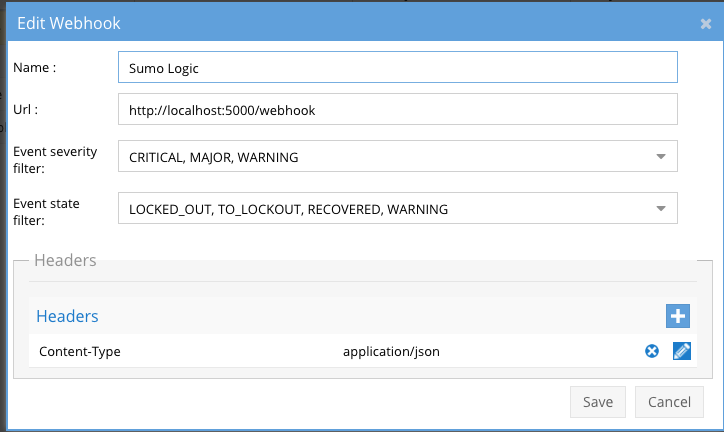
- The endpoint url above will use localhost and will send Webhooks to the application service listening on port 5000. URL to use in the configuration
- http://localhost:5000/webhook
- Add the Content-Type header with value of application/json as shown above to complete the webhook configuration.
- Click save to commit the configuration.
- Click save on the main Webhook configuration page
- Configure Zero Trust endpoint in Ransomware Defender Zero Trust tab.
- Test the configuration is working following the next section
How to test the Integration with Sumo Logic SIEM
- To test the integration follow these steps
- Prerequisites In Sumo Logic SIEMand Eyeglass:
- install the Sumo Logic SIEMagent on a test machine. Record the ip address of this test machine.
- Get the ip address of the Eyeglass vm
- download this curl command template and open with a text editor and locate the ip address of eyeglass at the very end of text and replace the ip address with the IP address of your eyeglass vm.
- Copy all the text in the text editor
- ssh to the eyeglass vm as the admin user
- Paste the entire cli command text to the ssh prompt to send sample data to the running Zero Trust application. This will send test data directly to the application to be processed and sent to Sumo Logic SIEM Integration service that is running on the Eyeglass VM.
- The output of a successfully processed webhook test will return this text in the ssh terminal
- done sending event to sumologic and check for http 200 and success count in response
- How to review the process logs from the web application
- sudo -s
- journalctl -f -u sumologic
- This allows you to view the logs generated by the application.
- To log to a file and review with nano showing only the most recent 250 lines.
- journalctl -f -n 250 -u sumologic > /tmp/sumologic.log
- nano /tmp/sumologic.log
- In the log below the response code from the Sumo Logic SIEM api call should show http 200 status code and successCount 1 to indicate the Finding was successfully created.
- You can also view sumologic.log for specific error messages.
- Login to the Sumo Logic SIEM and verify lot events can be seen in the log event viewer
- Done

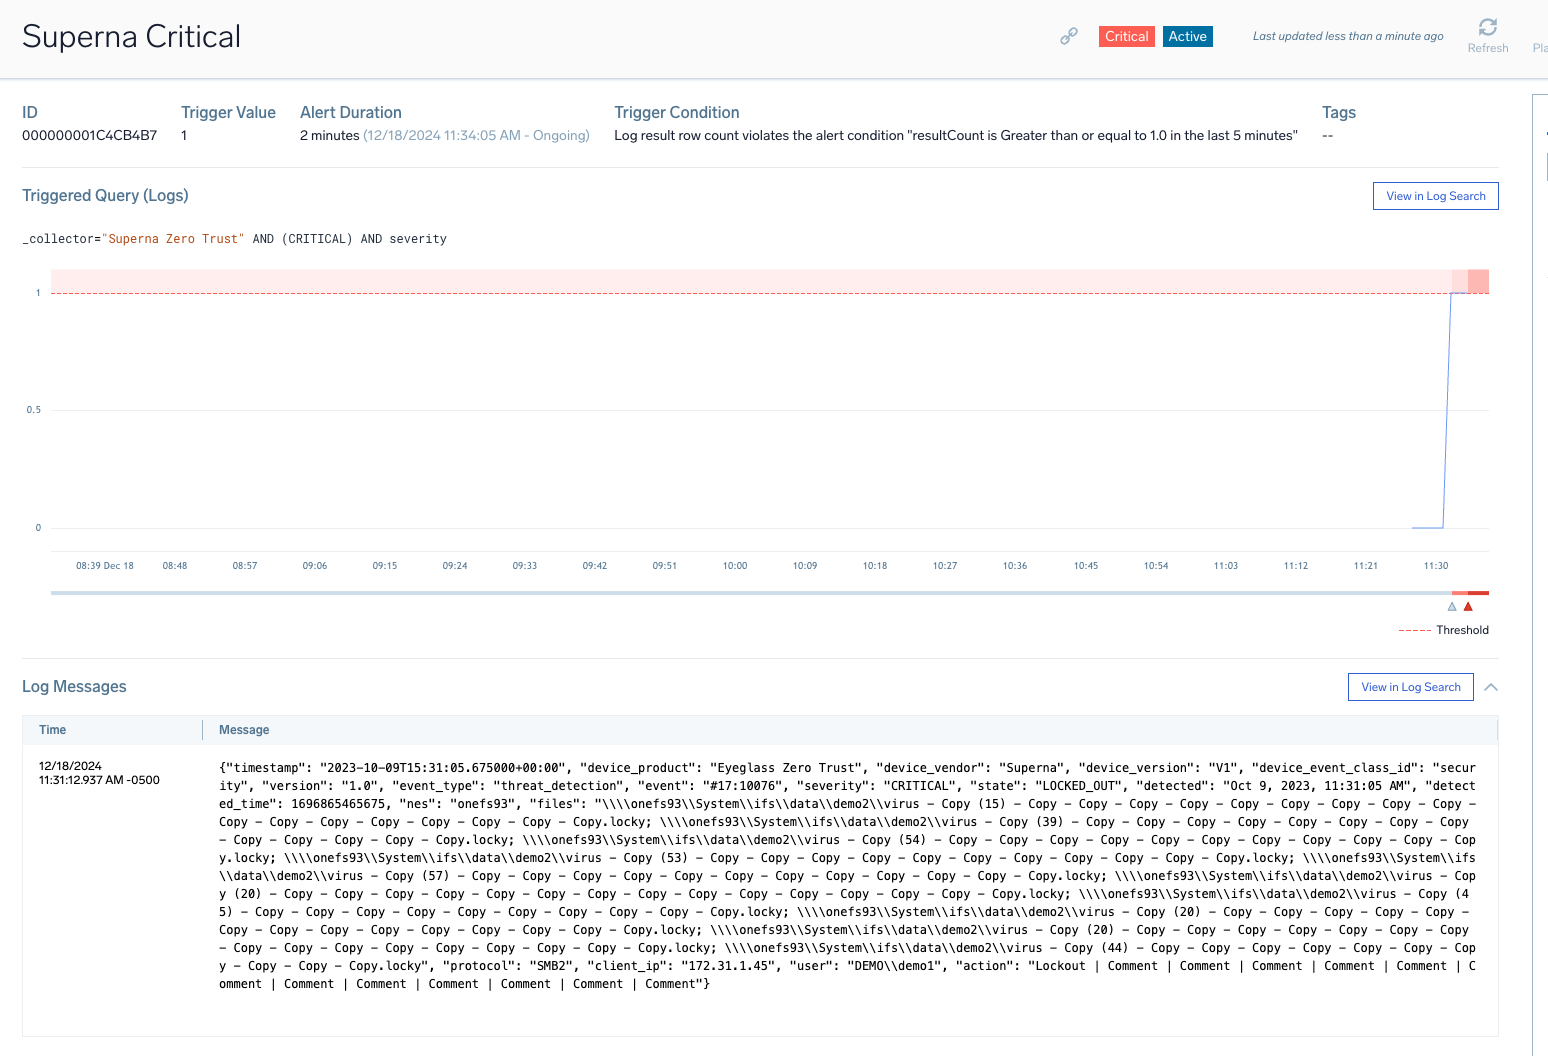
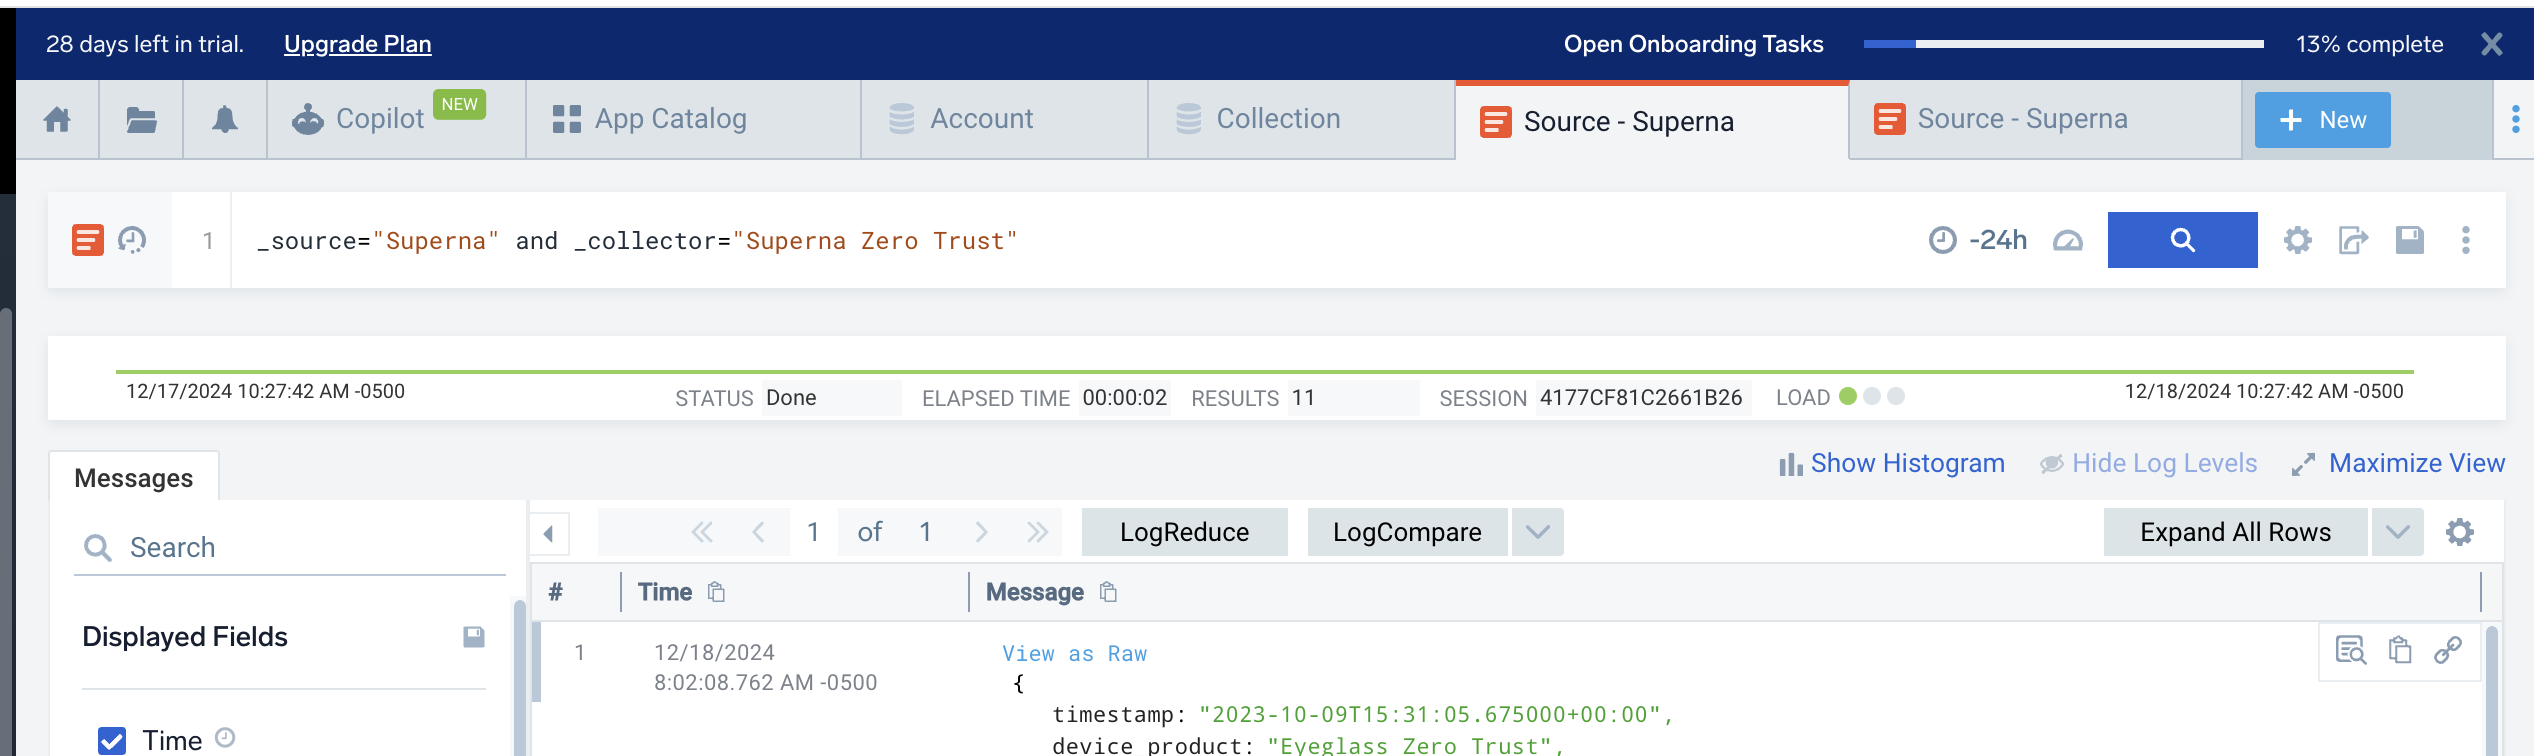
Sumo Logic SIEM SecOps administrators Integration Experience
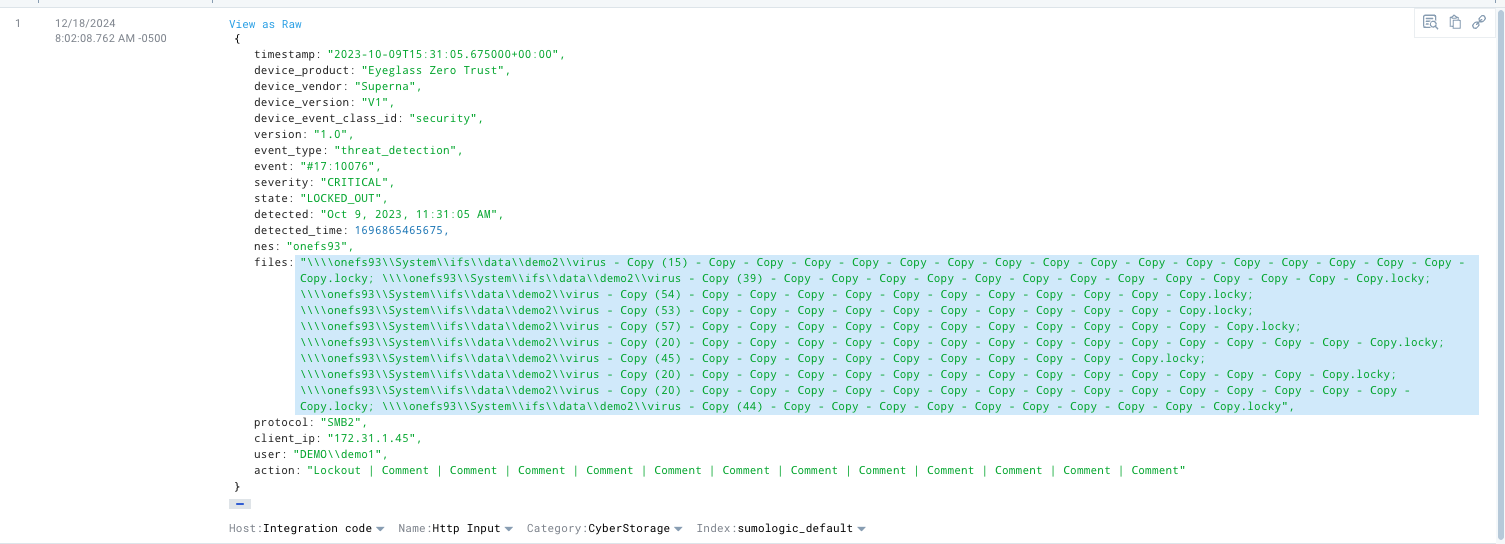
Example parsed results after an alert is sent to the collector endpoint url and parsed.
- Example log that is fully parsed
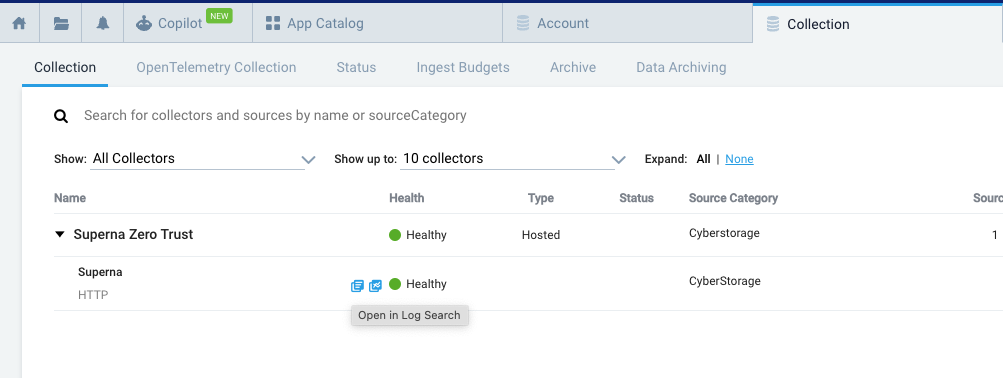
- How to Search for all events from a collector
- Open the Collector UI tab and open a search from the http collector icon.
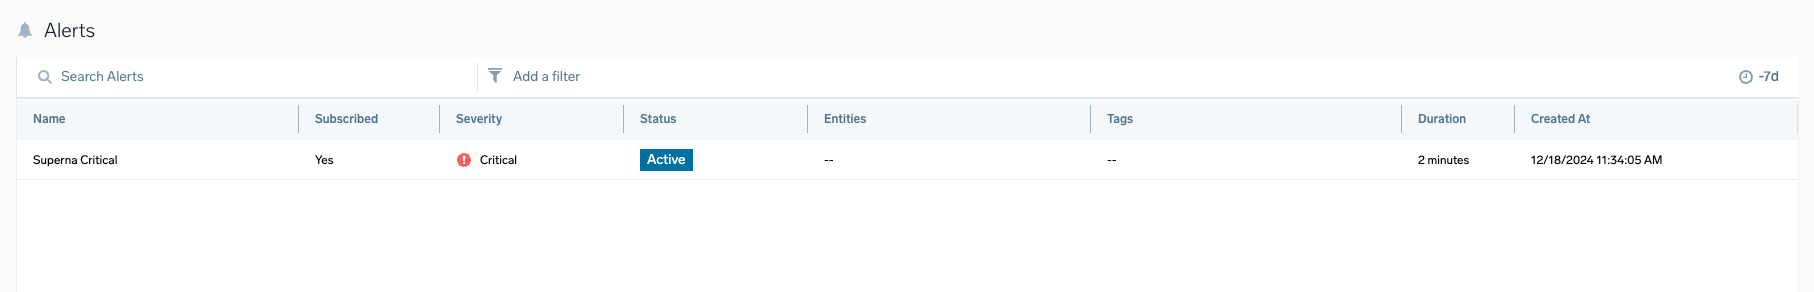
How to create an Alert Monitor
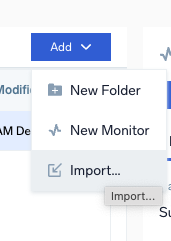
- Under the Alert monitor section of the left menu
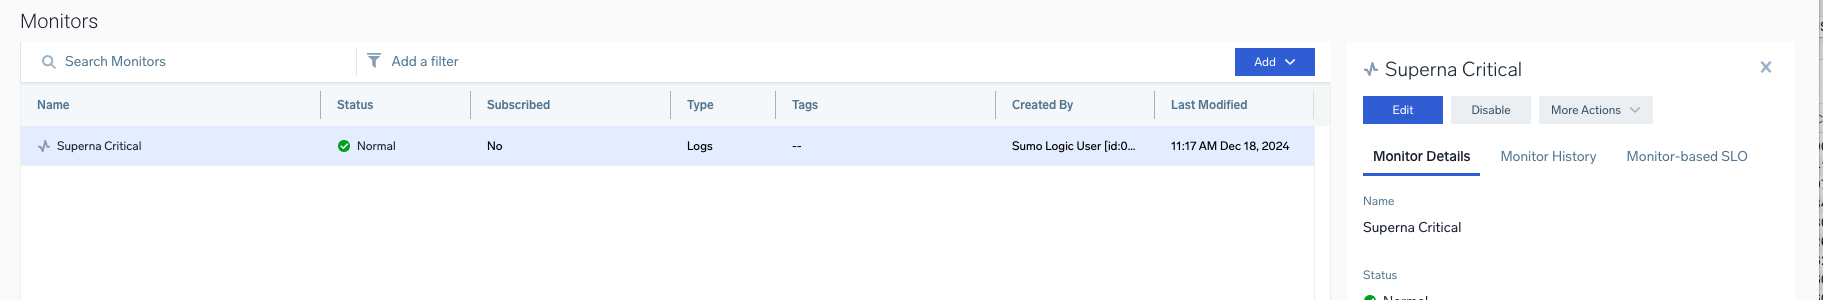
- Click Add and import
- Download this json file (right click download) and copy all the contents in the the import option and click Save
- Edit the monitor to change the Notifications as required.
- This enables a policy to look for critical Superna events every 5 minutes and raise an alert for each event
- Once it fires the Alert list should display an alert. NOTE: Use the testing procedure to create a webhook for testing log creation and Monitor alerts.