Rapid7 InsightIDR Superna Zero Trust Alerts
- Overview
- Support Statement
- Limitations
- Solution Overview
- What is Rapid7 InsightIDR?
- Integration Architecture
- Solution Configuration in Rapid7 InsightIDR and Defender Zero Trust
- Prerequisites
- Configuration in Rapid7 InsightIDR
- Configuration Steps on Eyeglass Virtual Machine
- High Level steps
- Configuration Step by Step
- Configure Defender Zero Trust Webhooks
- How to test the Integration with Rapid7 InsightIDR
- How to Create Detection Rules in Rapid7 InsightIDR
- Overview
- How to Configure Detection Rule in InisightIDR
- Example Incident in InsightIDR
Overview
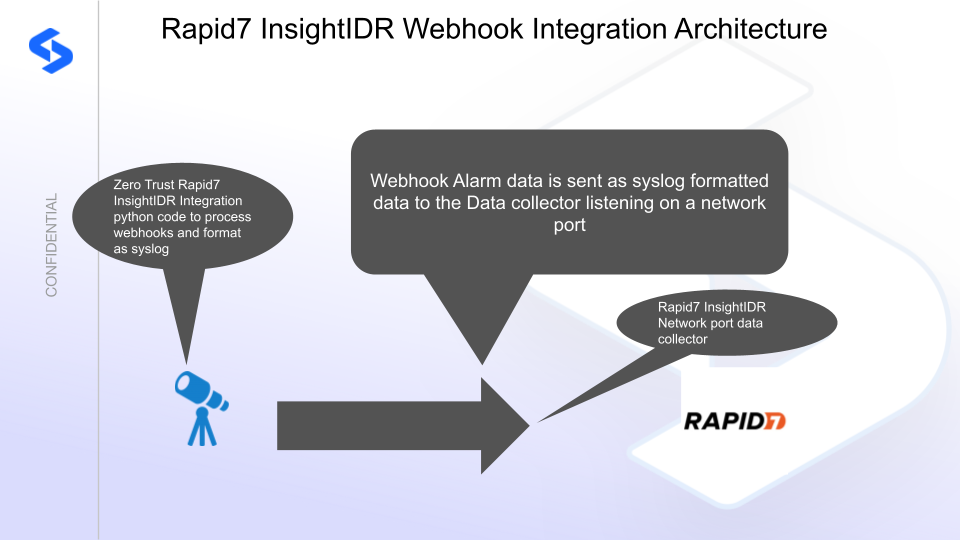
Customers using Rapid7 InsightIDR can leverage this integration to send real time zero trust alerts using webhooks and maintain full payload parsing using json defined fields. The InsightIDR Network port syslog data collector will be used. In order to leverage real time webhooks, a python integration application will be used process webhooks and format the data in syslog format to send to Rapid7.
Support Statement
-
NOTE: This documentation is provided "as is" without support for 3rd party software. The level of support for this integration guide is best effort without any SLA on response time. No 3rd party product support can be provided by Superna directly. 3rd party components require support contracts
Limitations
- HTTPS with un-signed certificates is the default configuration and certificate checking has been disabled in this sample code.
Solution Overview
Superna Defender Zero Trust API is the cornerstone technology used to integrate with SIEM, SOAR and XDR platforms. Automation begins with data that summarizes the threat and places that information into a security tools to be acted on by Secops and run playbooks to protect corporate IT assets from vulnerabilities and insider or external attackers. In order to allow a InsightIDR to act on the data it must be parsed. The InsightIDR platform can dynamically extract fields that are encoded in the alert payload. The example code sends all fields in the webhook to Rapid7, the application code could be customized to extract fields and only send a subset of the available data.
What is Rapid7 InsightIDR?
A cloud-based SIEM built for security teams in need of a solution that can quickly detect and respond to threats in today's ever-evolving hybrid and multi-cloud IT environments.
Integration Architecture
Solution Configuration in Rapid7 InsightIDR and Defender Zero Trust
Prerequisites
- Installed Superna Security Edition
- Eyeglass OS appliance version 15.5
- cat /etc/os-release
- License key for the Zero Trust API or Subscription license type
Configuration in Rapid7 InsightIDR
- Login to the console and install a Data collector, this example will use the Windows OS collector
- Select Add Raw Logs Custom Event Type, select the collector that will be used.
- Use an unused network port on the collector host
- Select Listen on Network port option and use 6675 or change to another port if this port is already used.
- Leave the protocol set to UDP
- Check the box for RFC 3164
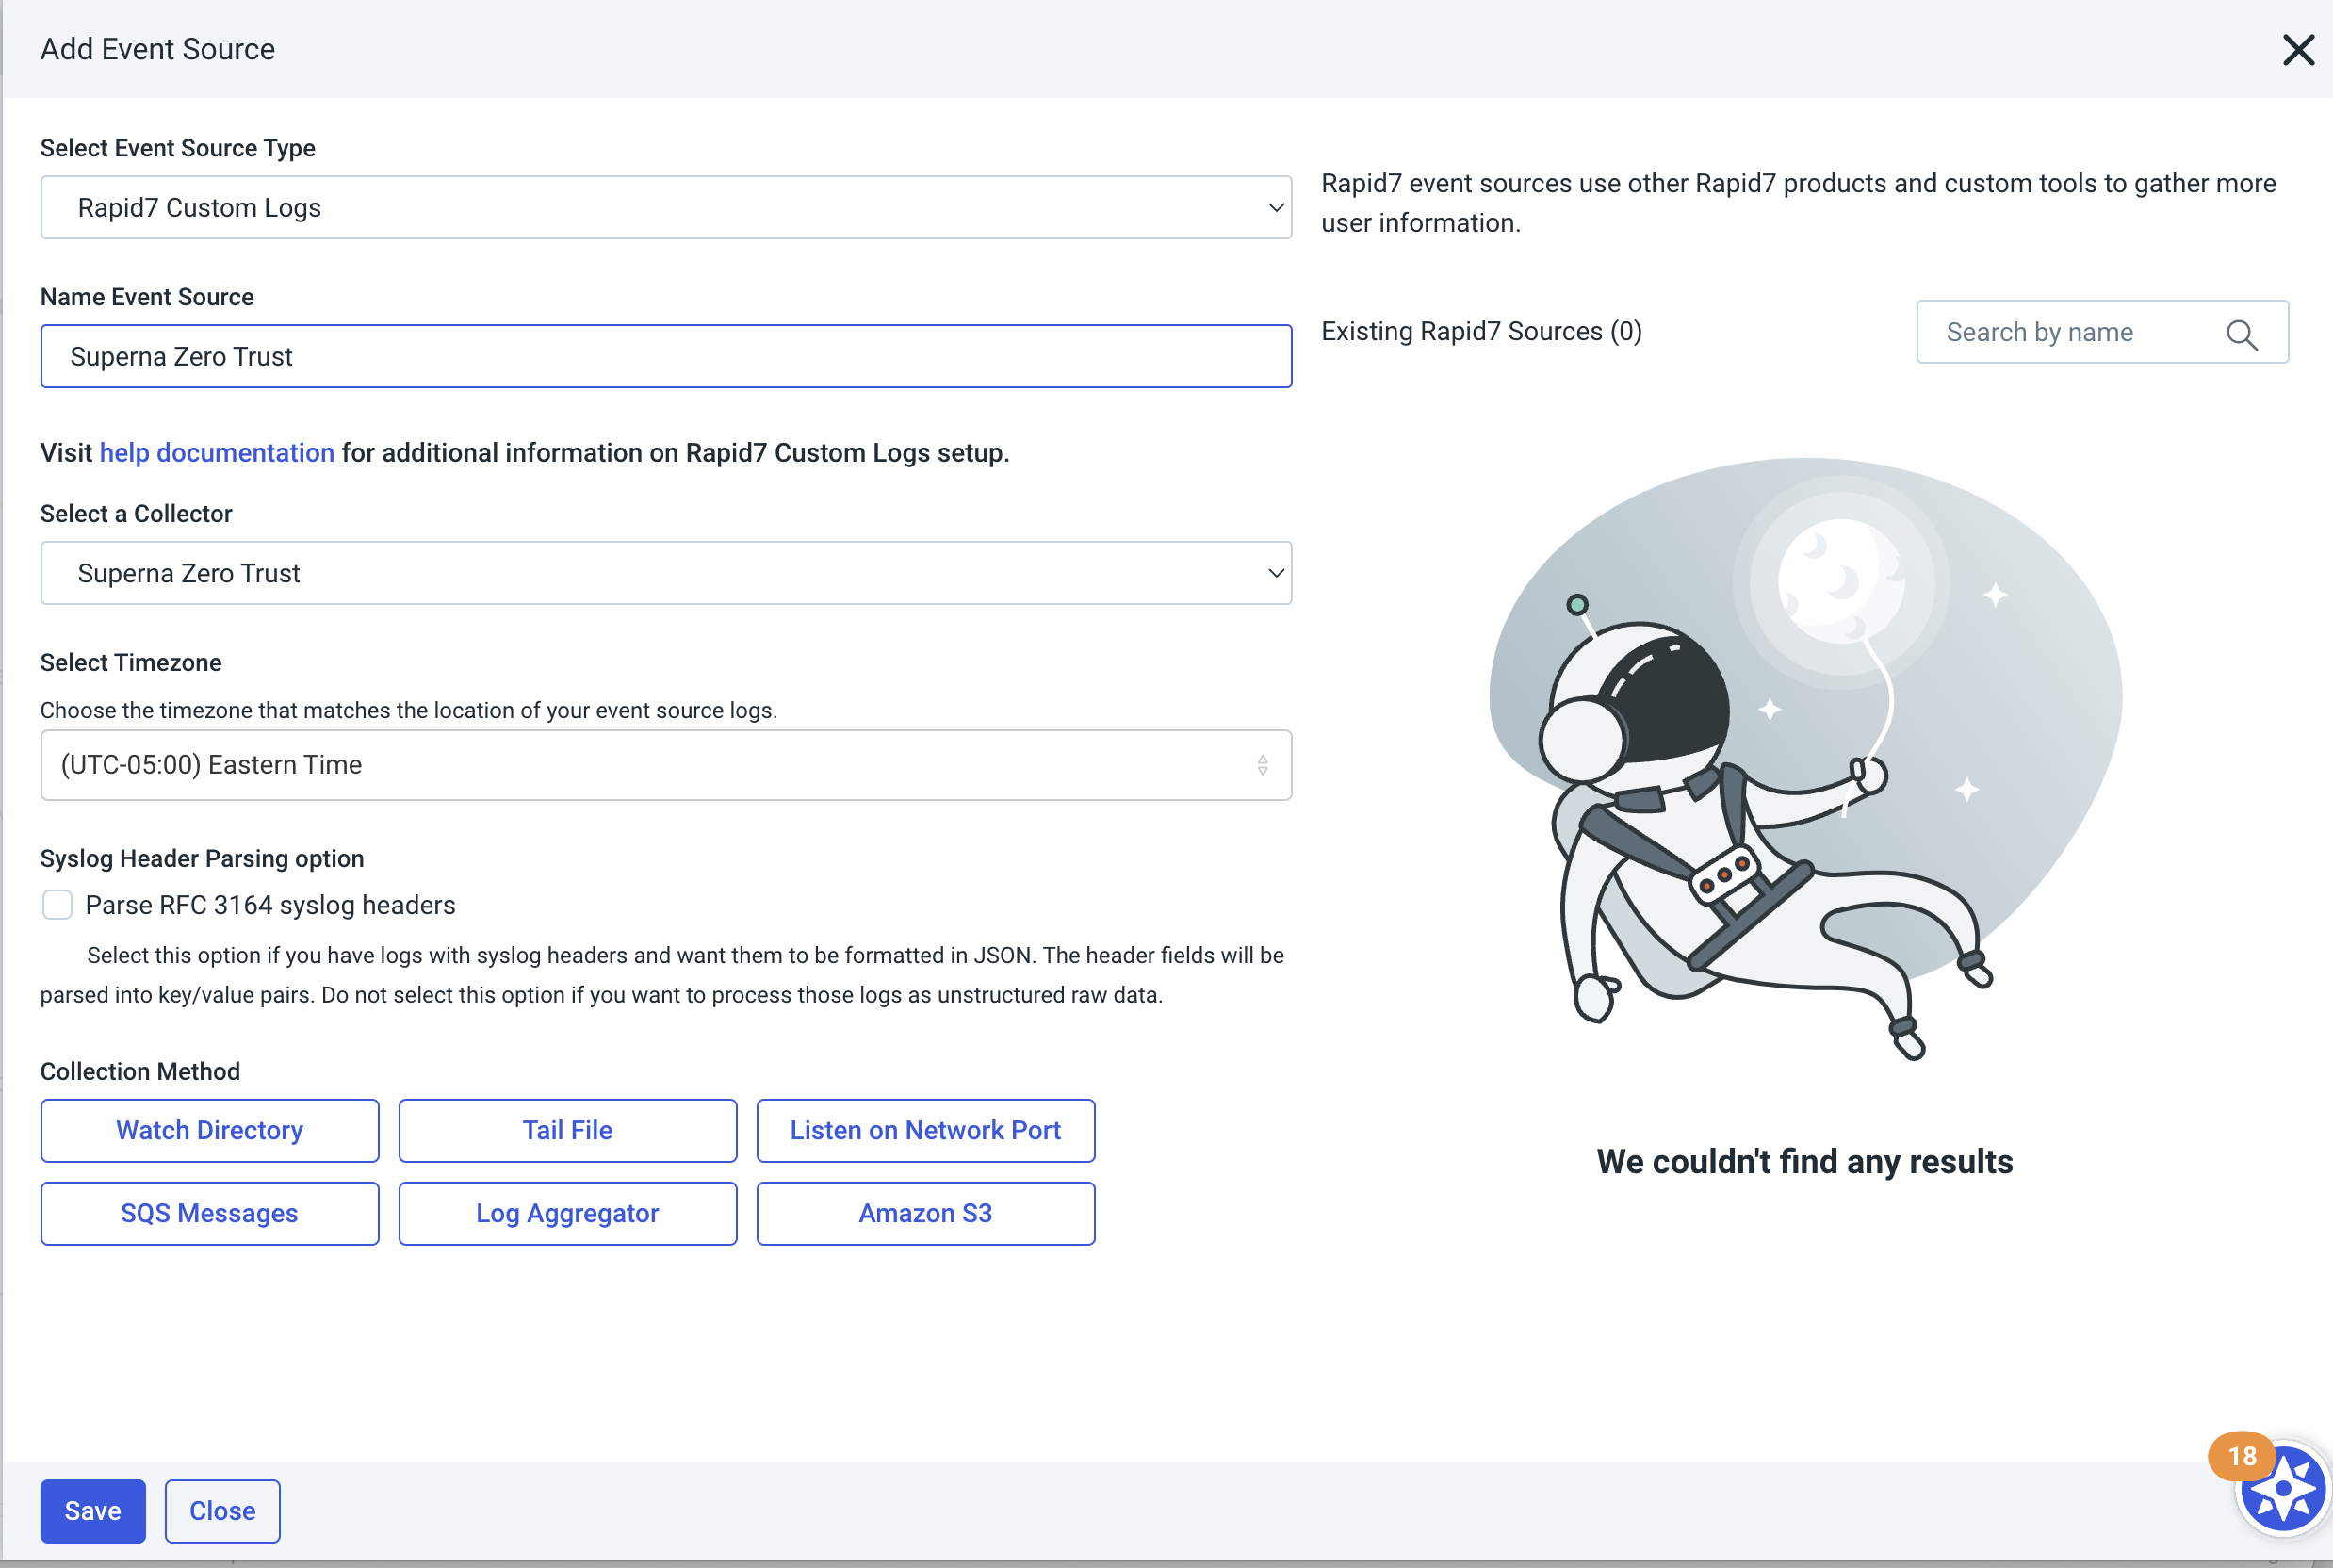
- Done
Configuration Steps on Eyeglass Virtual Machine
High Level steps
- Create python location to run the application on the Eyeglass vm
- Create python main application script
- Create linux systemd service and set to auto start
- Create Zero Trust configuration in Defender
- Update the main script to customize with Rapid7 InsightIDR python code
- Test the script is running as a service
- Create a test event in Defender to validate the alerts appear as indexed parsed events in Rapid7 InsightIDR
Configuration Step by Step
Configure the Service start and python integration files
Configure the python packages and customize the InsightIDR integration python code
- Customize the application code by downloading the python code from this link to download
- Open the python template file in a text editor. NOTE: make sure to only replace the values and do not delete any of the commas
- Locate this section in the file and update the yellow highlighted values. Optionally change the facility and severity defaults used in the syslog headers.
- SYSLOG_SERVER = 'syslog.server.address' # Replace with your Data Collector server address, keep the single quotesSYSLOG_PORT = 6675 # Replace with your Data Collector UDP port number configured for the Event SourceFACILITY = 13 # 1 - User-level messages, 13 - Security audit logSEVERITY = 2 # 1 - Alert, 2 - critical, 3 - Error, 4 - Warning, 5- Notice, 6 - Informational message
- Paste the updated script into the production file
- nano /opt/superna/cgi-bin/insightidr.py
- Open the file locally in Windows OS notepad and use control-A or select all the text.
- Paste the clipboard into the ssh terminal session with the open nano editor file
- save the file
- press control+x
- Answer yes to save and exit the nano editor
- Start the service and verify it is running
- systemctl start insightidr
- systemctl status -l insightidr
- Verify the service is started successfully and returns "active and running".
- If the service does not start do not proceed and double check the steps above are completed.
Configure Defender Zero Trust Webhooks
- The next step creates an Zero Trust Webhook URL.
- Configure Zero Trust endpoint in Ransomware Defender Zero Trust tab.
- Recommended Configuration: Only Critical and Major events and only the webhooks that set lockout or delayed lockout. Customers can customize based on specific requirements. The goal is to send findings versus a list of alarms that do not pinpoint a security incident.
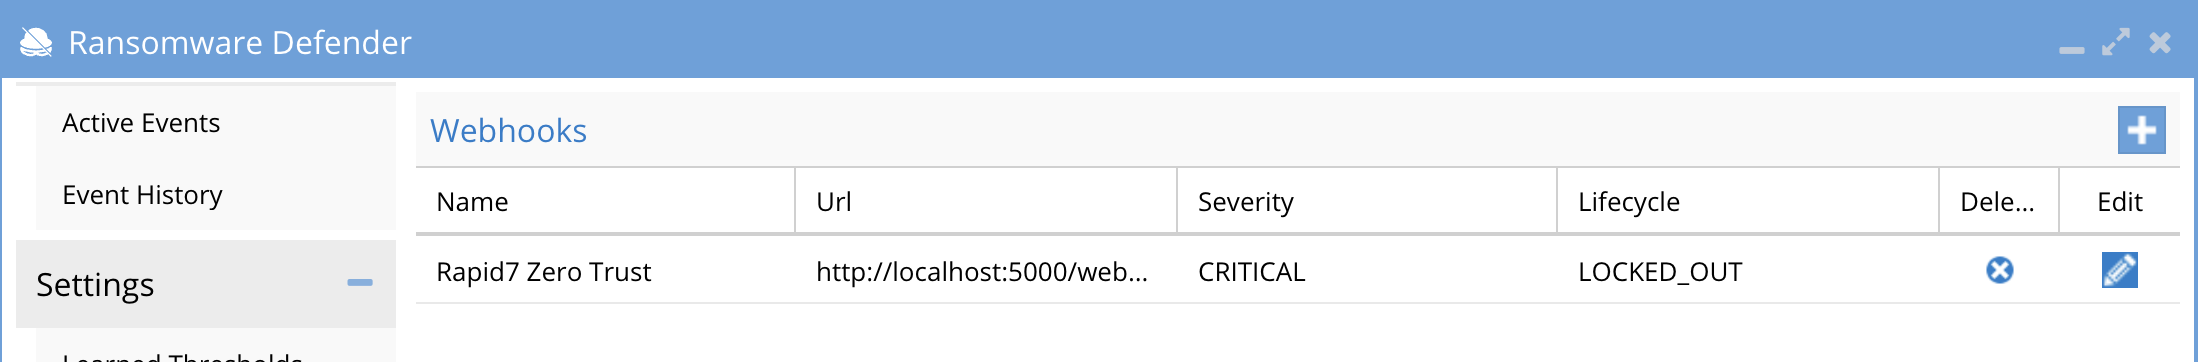
- The endpoint url above will use localhost and will send Webhooks to the application service listening on port 5000. URL to use in the configuration
- http://localhost:5000/webhook
- Add the Content-Type header with value of application/json as shown above to complete the webhook configuration.
- Click save to commit the configuration.
- Click save on the main Webhook configuration page
- Configure Zero Trust endpoint in Ransomware Defender Zero Trust tab.
- Test the configuration is working following the next section
How to test the Integration with Rapid7 InsightIDR
- To test the integration follow these steps
- download this curl command template and open with a text editor
- Copy all the text
- ssh to the eyeglass vm as the admin user
- paste the entire cli command to the ssh prompt to send sample data to the running Zero Trust application. This will send test data directly to the application to be processed and sent to Rapid7 InsightIDR Data Collector.
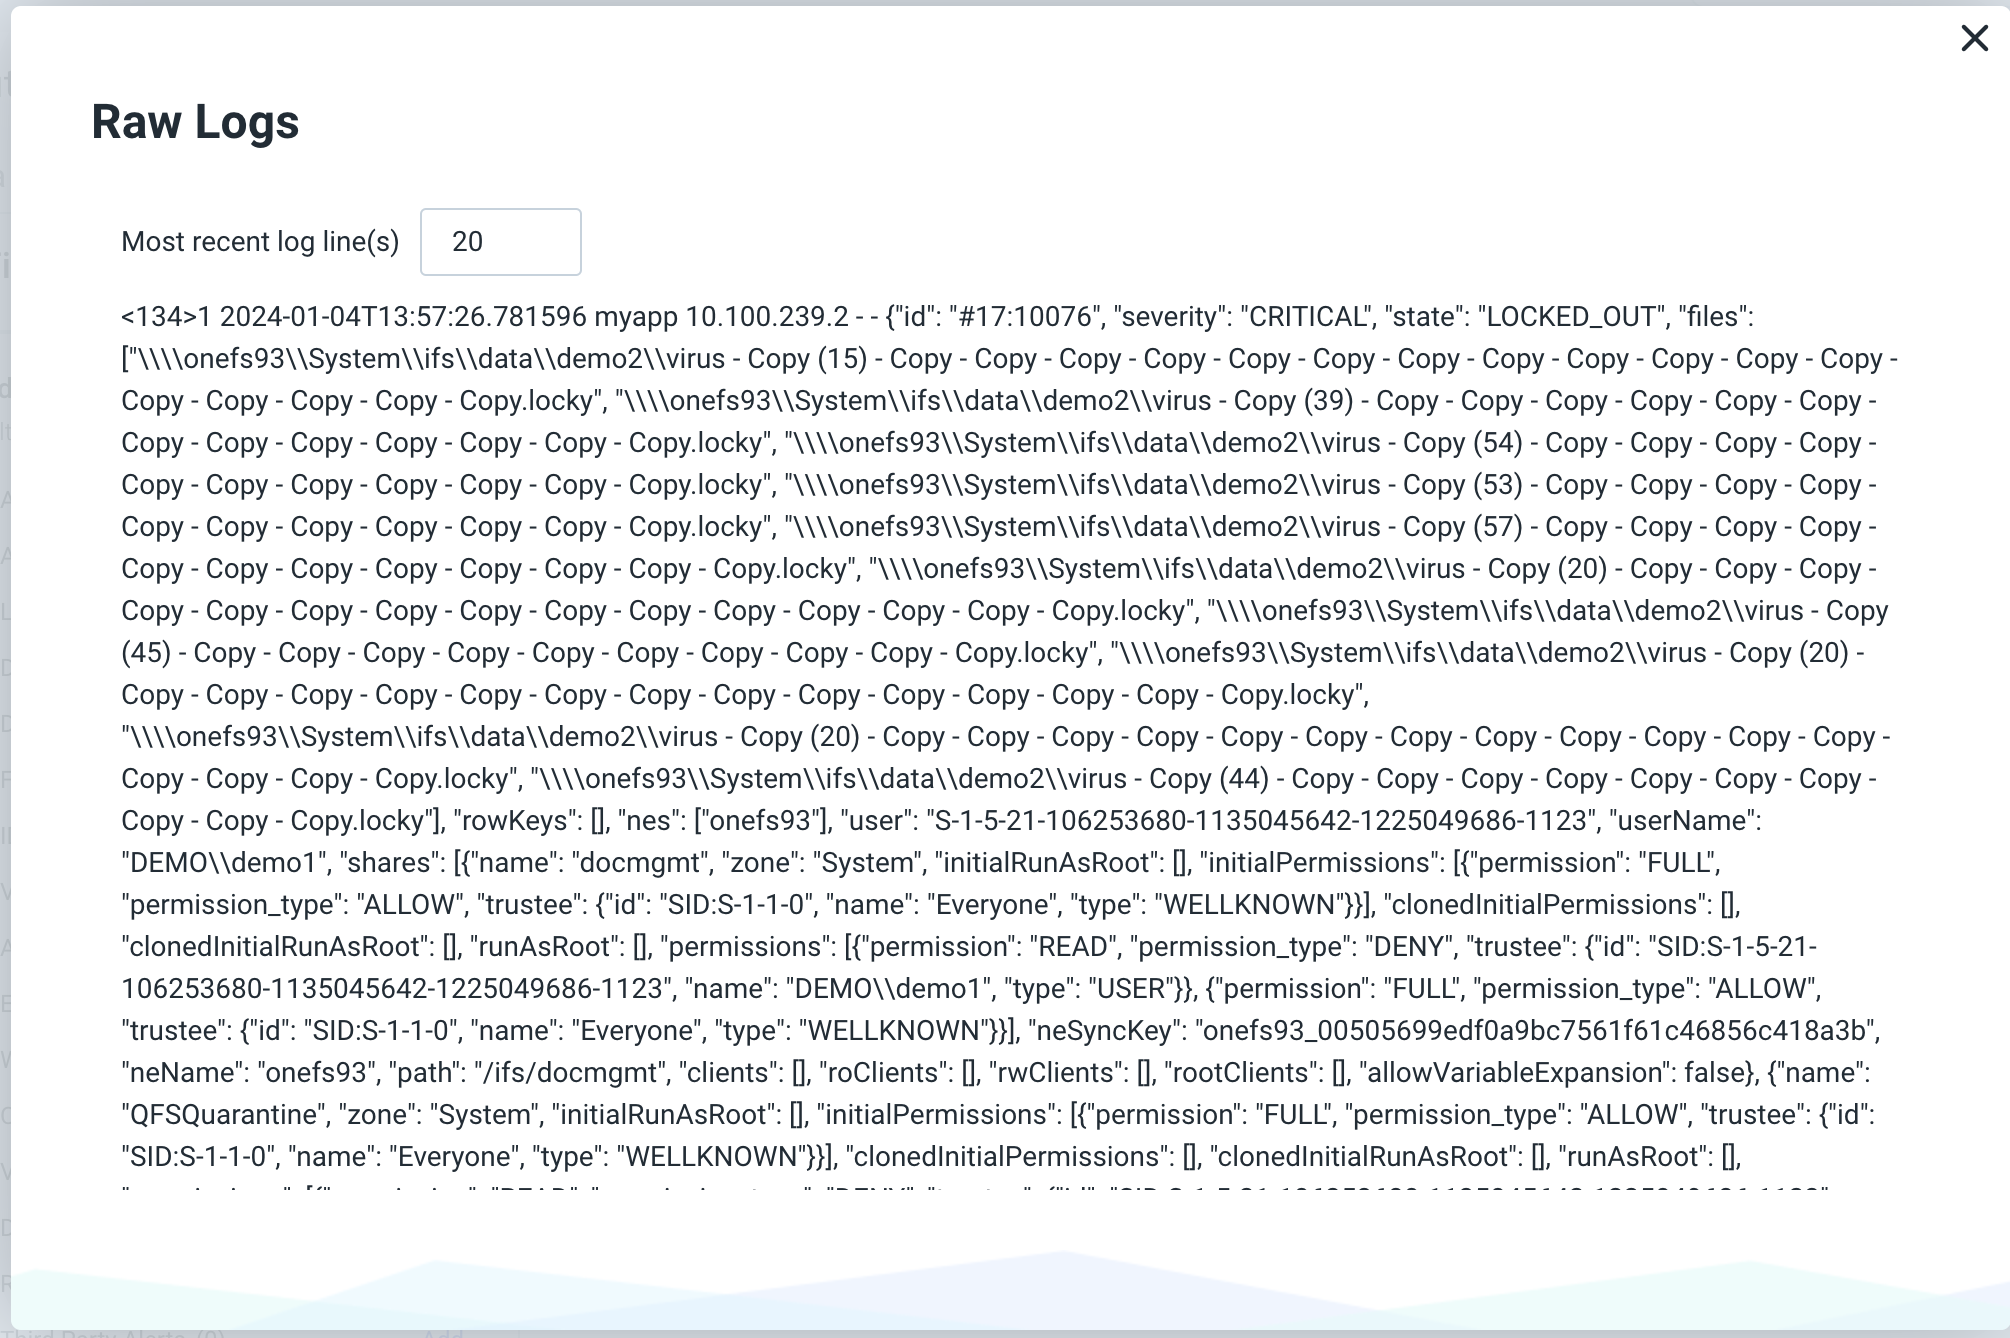
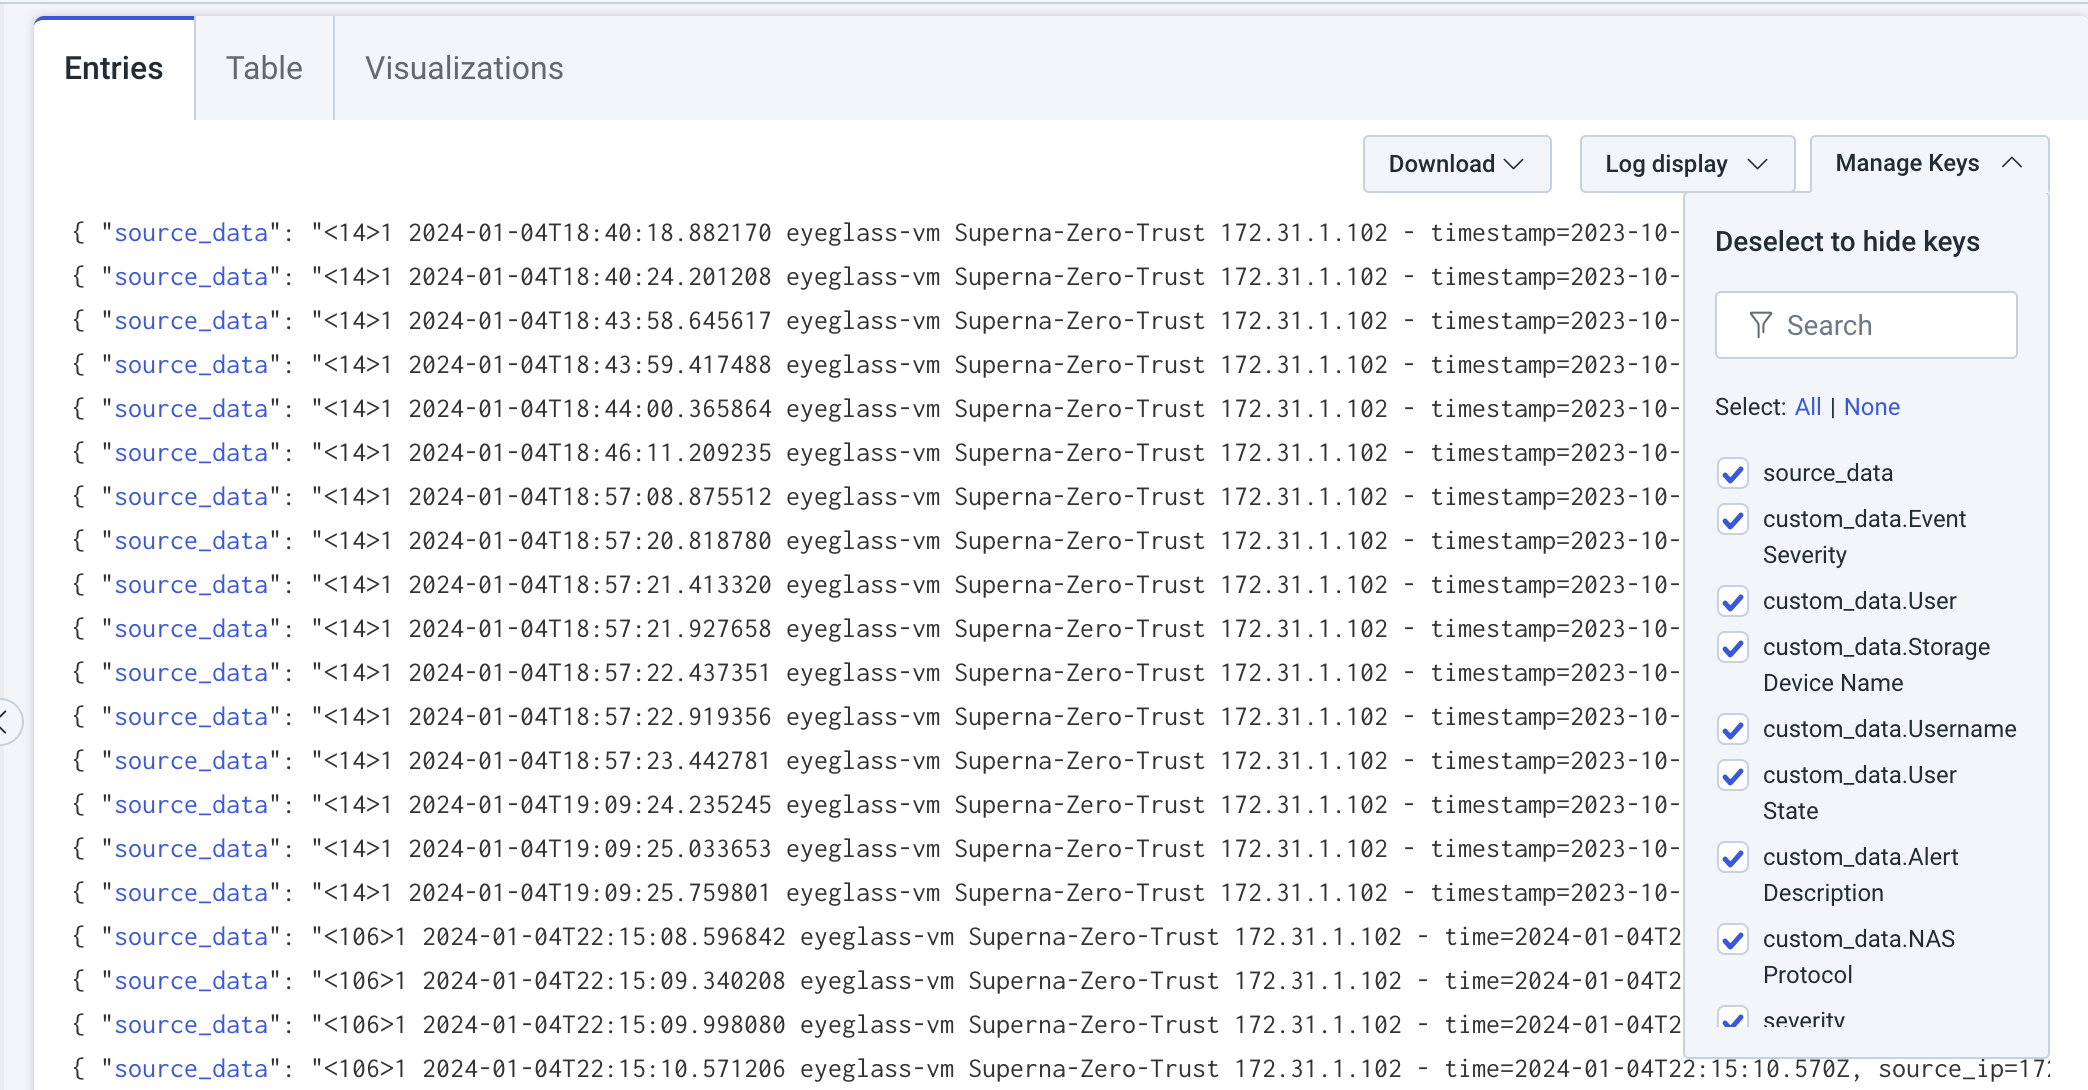
- It can take upto 5 minutes for the data collector to forward events to the portal. Once webhooks are processed. The log search will show the records and using json format the key value pairs are displayed.
- It can take upto 5 minutes for the data collector to forward events to the portal. Once webhooks are processed. The log search will show the records and using json format the key value pairs are displayed.
- The output of a successfully processed webhook test will return this text in the ssh terminal
- done sending event to InsightIDR and check for http 200 and success count in response
- How to review the process logs from the web application
- sudo -s
- journalctl -f -u insightidr
- This allows you to view the logs generated by the application.
- To log to a file and review with nano showing only the most recent 250 lines.
- journalctl -f -n 250 -u insightidr > /tmp/ztwebhook.log
- nano /tmp/insightidr.log
- In the log below the response code from the Rapid7 InsightIDR api call should show http 200 status code.
- You can also view InsightIDRd.log for specific error messages.
- Login to the Rapid7 InsightIDR view the event source
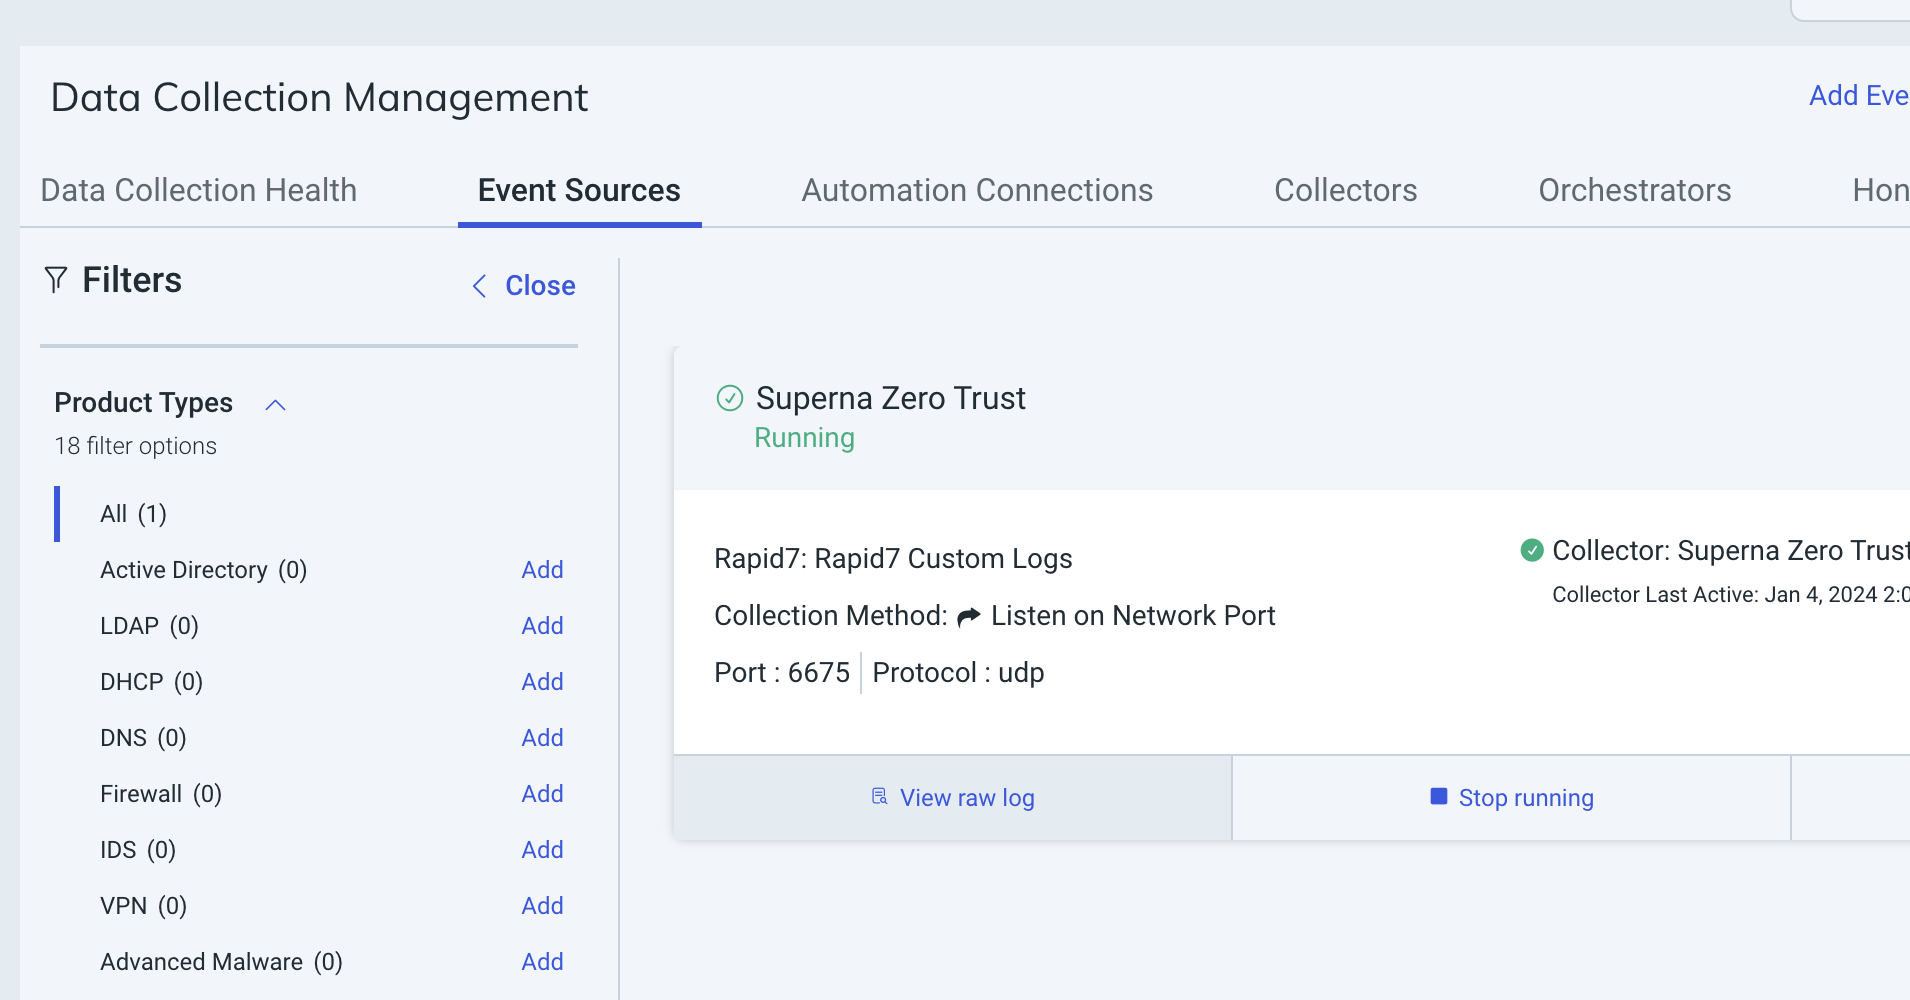
- Select the collector used for the integration and click view raw log to verify data has been recieved by the Rapid7 portal from the on premise collector.
- Done
How to Create Detection Rules in Rapid7 InsightIDR
Overview
This Log Pattern Detection rule configuration will create critical incidents since the Zero Trust alert is not a log entry it represents a root cause detection, the log entries can be set up a trigger to create critical incident in InsightIDR.
How to Configure Detection Rule in InisightIDR
- NOTE: Ensure log entries have been tested and visible in the log search before starting this configuration.
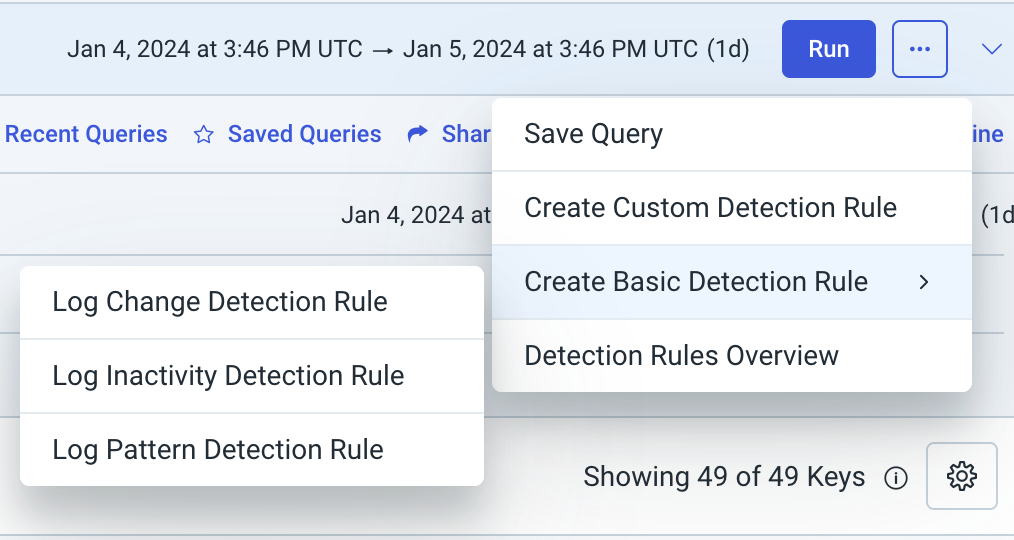
- Run a search using the severity query filter and select the Superna Zero Trust log collector.
- Use this query syntax where("severity" = "CRITICAL")
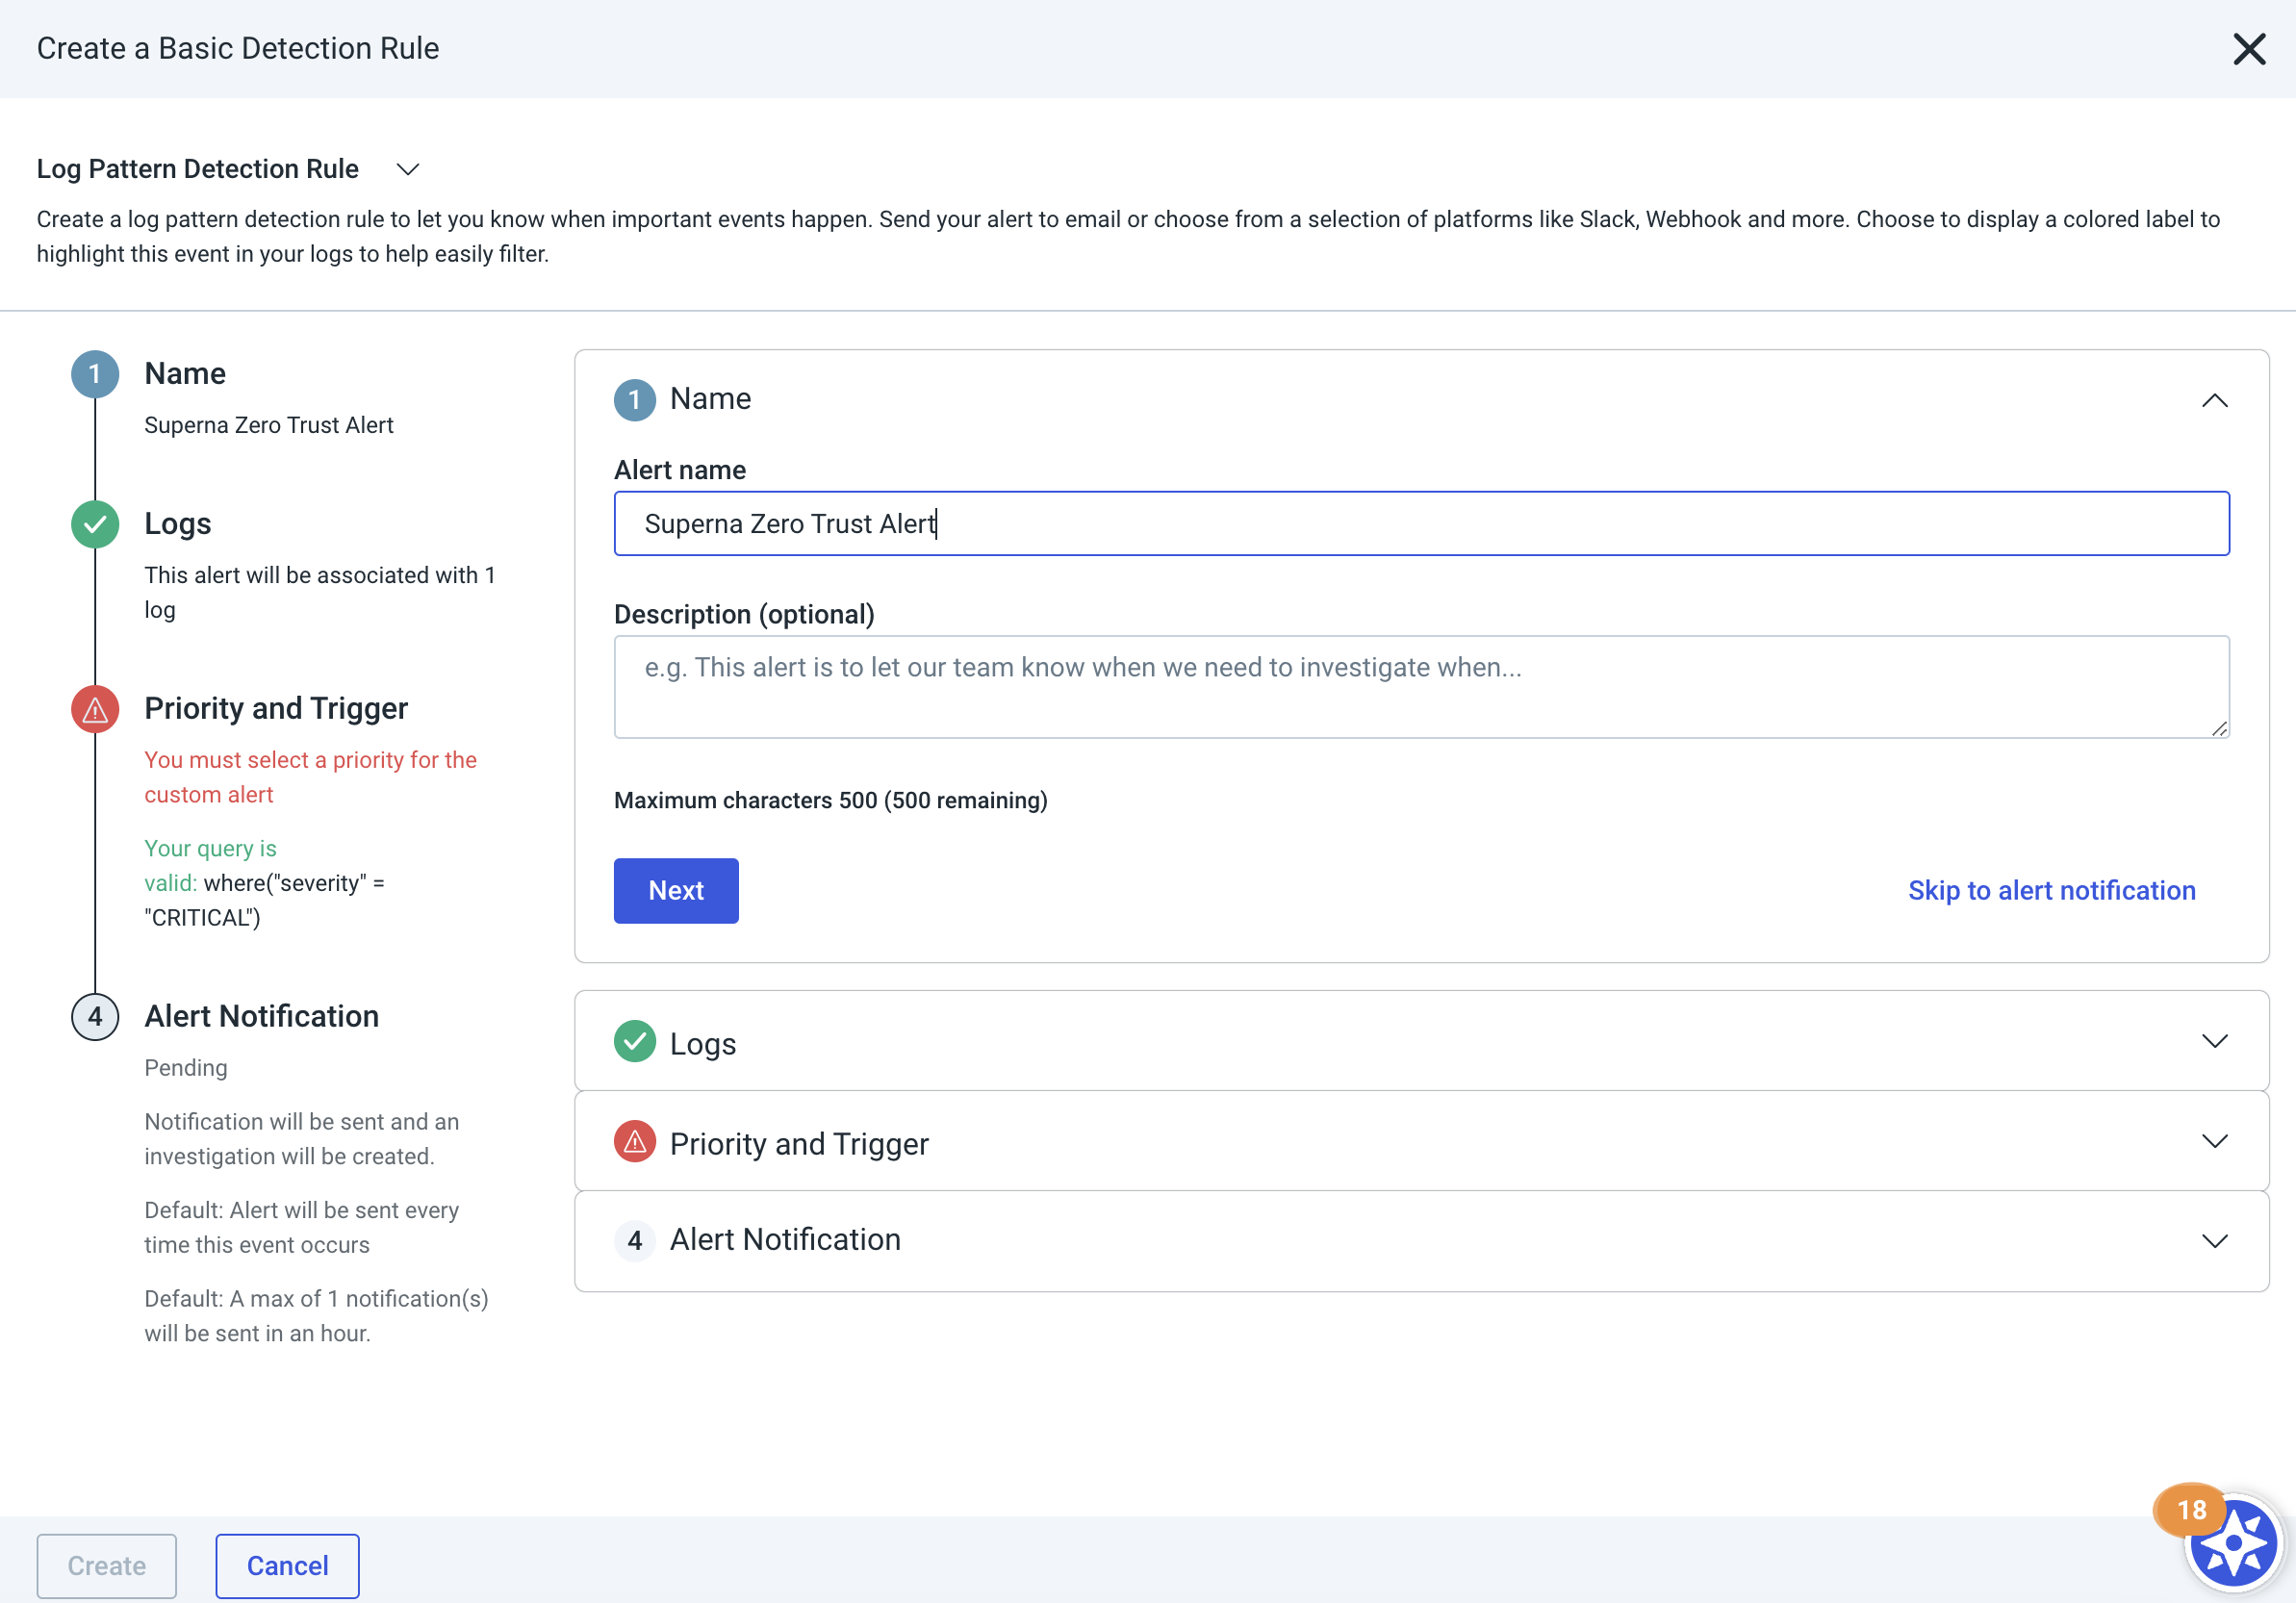
- Select the 3 dots to create a Log Pattern Detection Rule
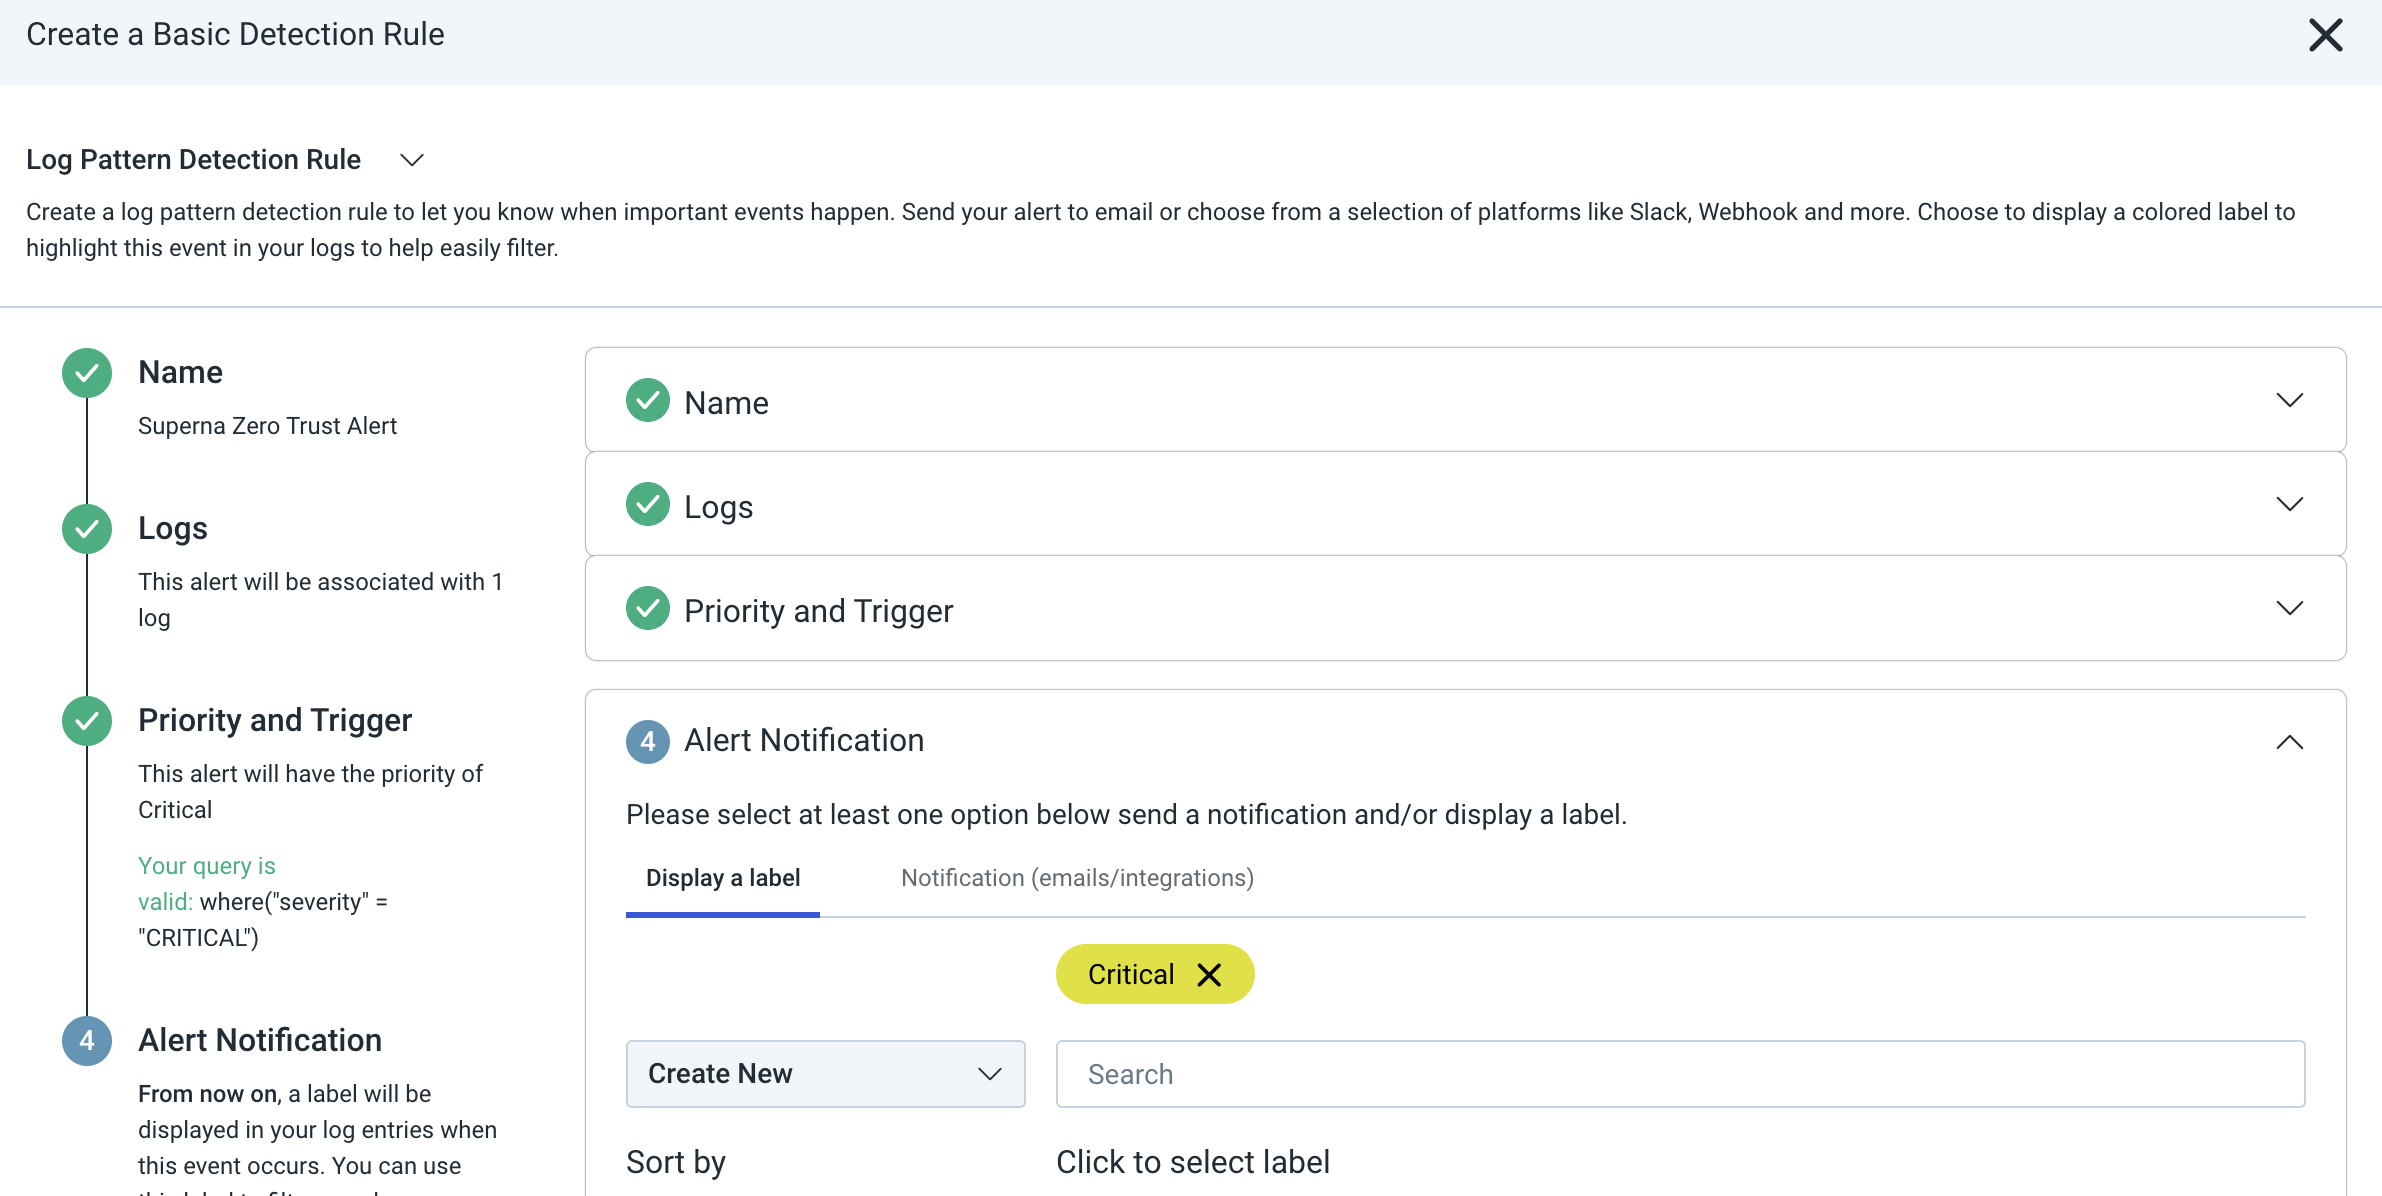
- To Create Log Pattern Detection Rule triggers follow these steps
- Click Create and then view the detection rules page to verify it is enabled as per below image.
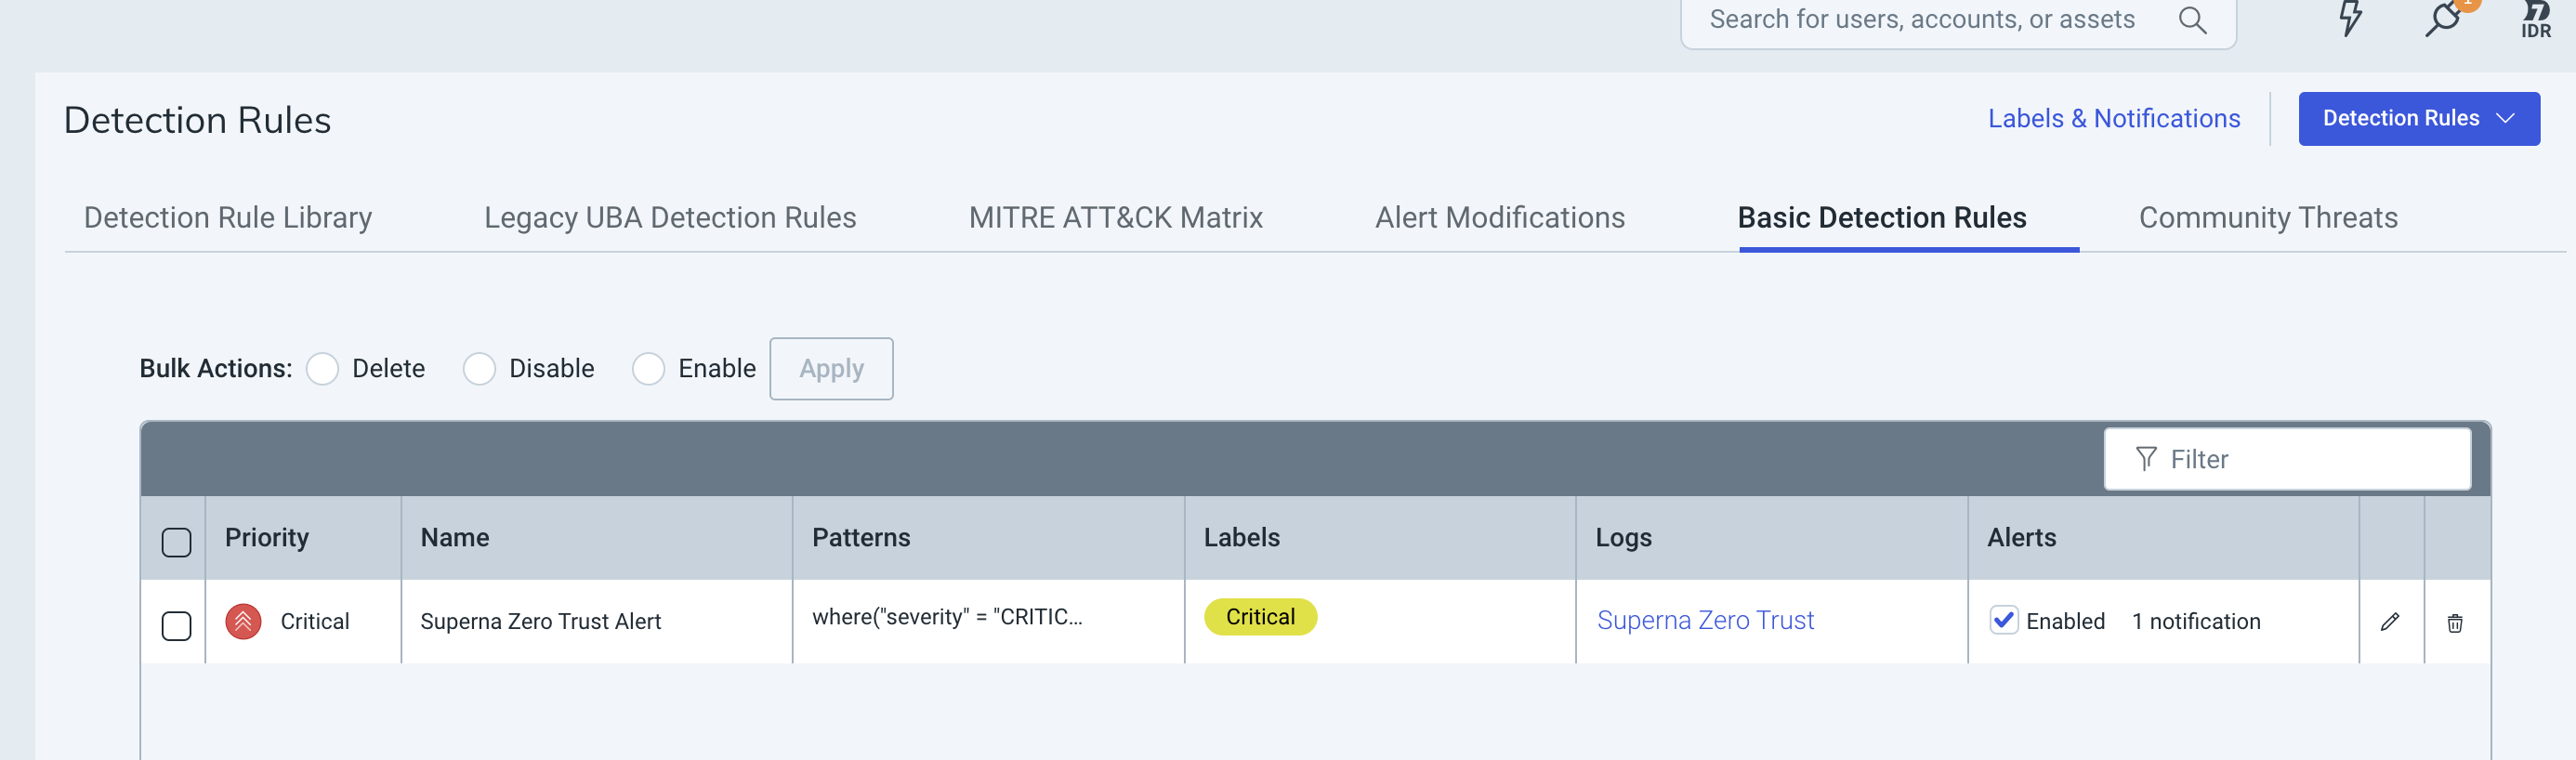
- Procedure Completed. When new log entries arrive they should trigger the creation of Critical incidents.
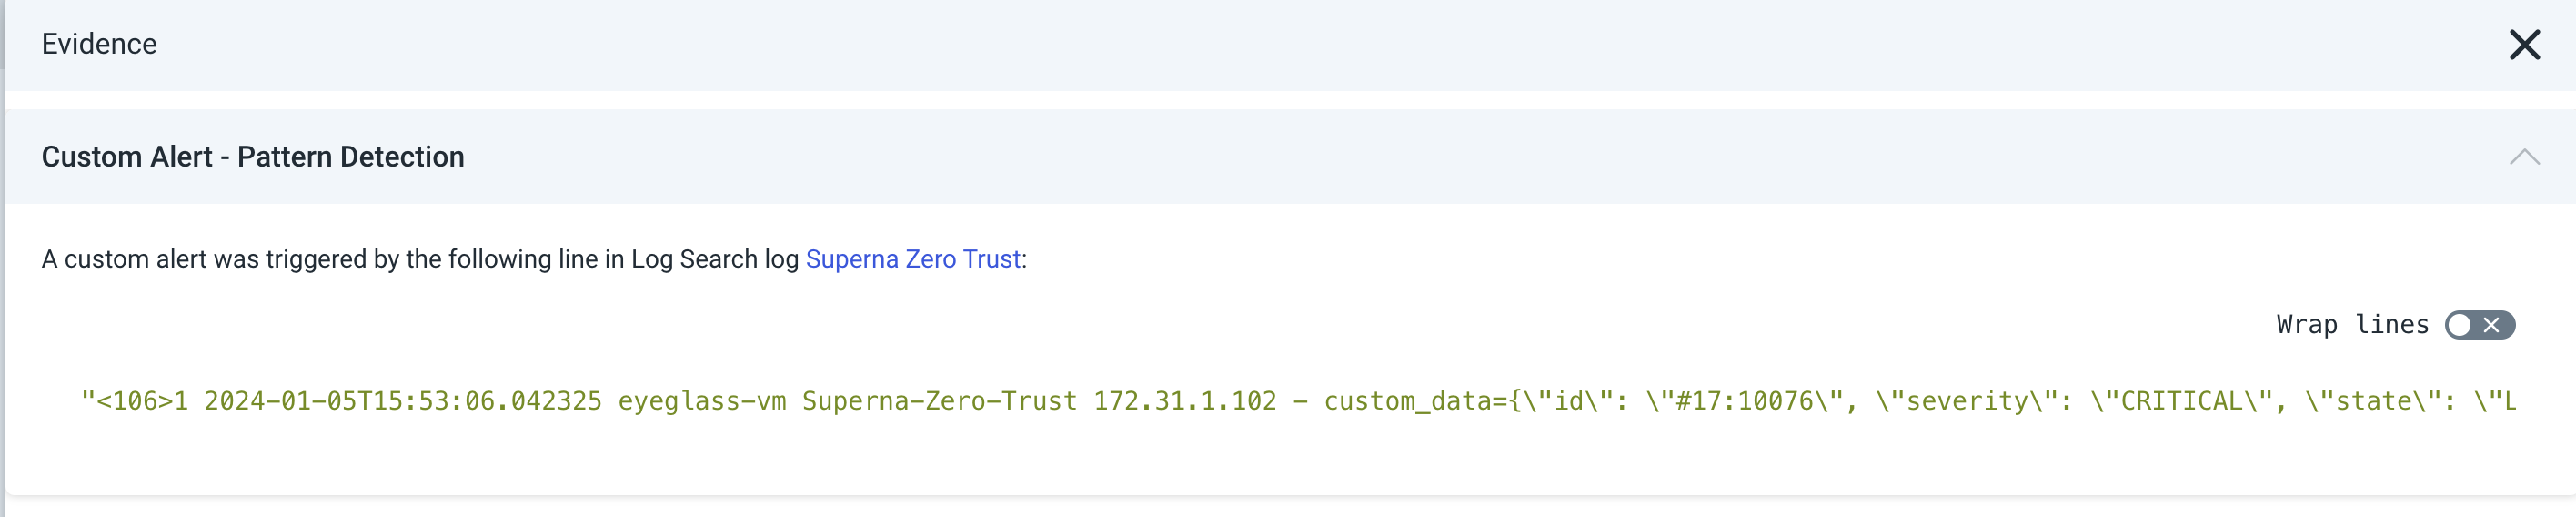
Example Incident in InsightIDR

- Evidence log