LogicMonitor Zero Trust Alert Integration
- Overview
- Support Statement
- Limitations
- Solution Overview
- What is LogicMonitor?
- Integration Architecture
- Solution Configuration in LogicMonitor and Data Security Edition Zero Trust
- Prerequisites
- Features
- Configuration in LogicMonitor Endpoint
- Configuration Steps on Eyeglass Virtual Machine to Install the Feature Pak
- Configure Data Security Edition Zero Trust Webhooks
- How to test the Integration with LogicMonitor
- LogicMonitor Administrator Integration Experience
Overview
Customers using LogicMonitor can leverage this integration to send real time zero trust alerts using webhooks and maintain full payload parsing using json defined fields. The LogicMonitor Alert Ingestion Connector capability within the platform allows inbound webhook json payload to be parsed within the SIEM.
Support Statement
-
NOTE: This documentation is provided "as is" without support for 3rd party software. The level of support for this integration guide is best effort without any SLA on response time. No 3rd party product support can be provided by Superna directly. 3rd party components require support contracts
Limitations
- NOTE: This guide does not provide any configuration for routes, pipelines or destinations. It is assumed customers will configure where the alert data should be routed and sent to destinations.
Solution Overview
Superna Data Security Edition Zero Trust API is the cornerstone technology used to integrate with SIEM and SOAR platforms. This integration offers alerts mapped
What is LogicMonitor?
LogicMonitor is a SaaS-based, AI-powered hybrid infrastructure monitoring and observability platform. It provides unified visibility into servers, networks, clouds, and applications, allowing IT teams to detect issues, automate responses, and prevent downtime. It uses agentless collectors to monitor data centers, cloud (AWS, Azure, GCP), and legacy infrastructure.
Integration Architecture
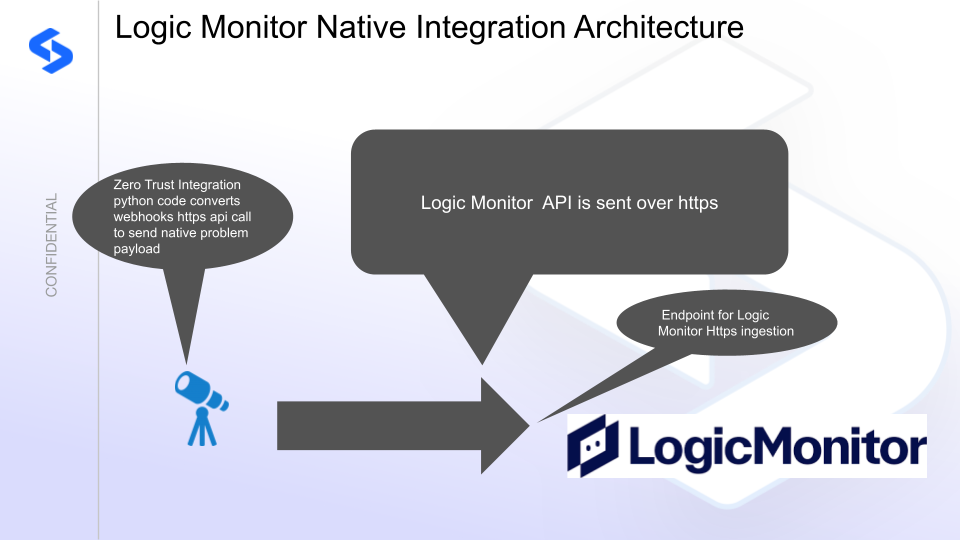
Solution Configuration in LogicMonitor and Data Security Edition Zero Trust
Prerequisites
- Installed Data Security Edition subscription product
- Eyeglass OS appliance version 15.5
- cat /etc/os-release
- License key for the Zero Trust API
- LogicMonitor Instance
Features
- Sends over webhook https
Configuration in LogicMonitor Endpoint
To configure webhook events, you need the following:
An API Only User in LogicMonitor with “Manage” permission for Logs & Traces
An appropriate webhook name, for example, Superna
_WebhookA valid Receiver URL (Callback URL) to the LogicMonitor portal
For example:https://portalname.logicmonitor.com/rest/api/v1/webhook/ingest/sourceName
In this example,The
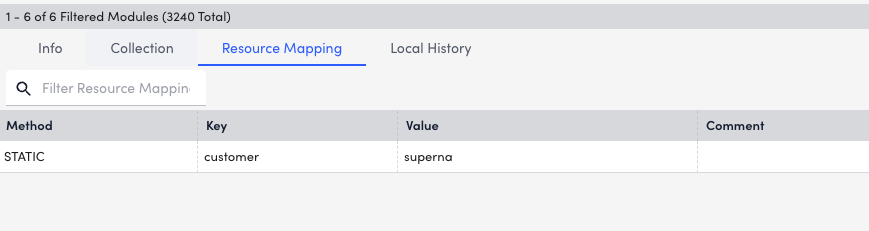
sourceNameis included in webhook messages to identify the origin of the data.You can also configure a LogSource to filter by
sourceName.Each
sourceNameshould be unique (for example, Superna+CustomerName).
Bearer Token assigned to the API Only User configured for authentication
For example: HTTP Header Key:Authorization
HTTP Header Value:Bearer <BearerTokenHere>
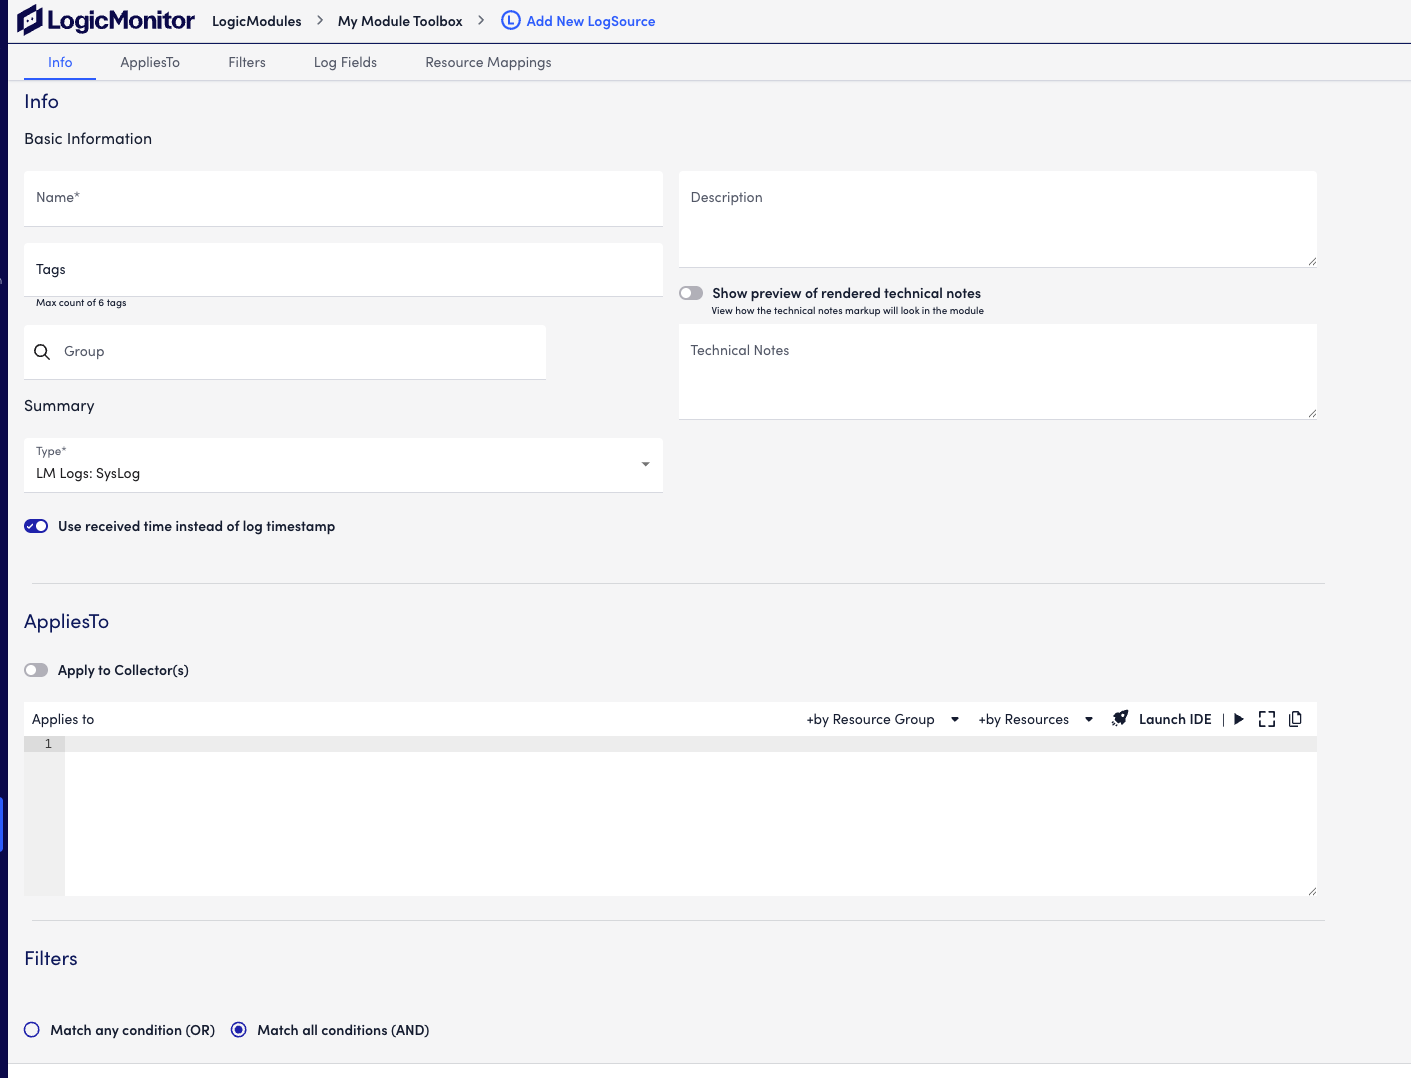
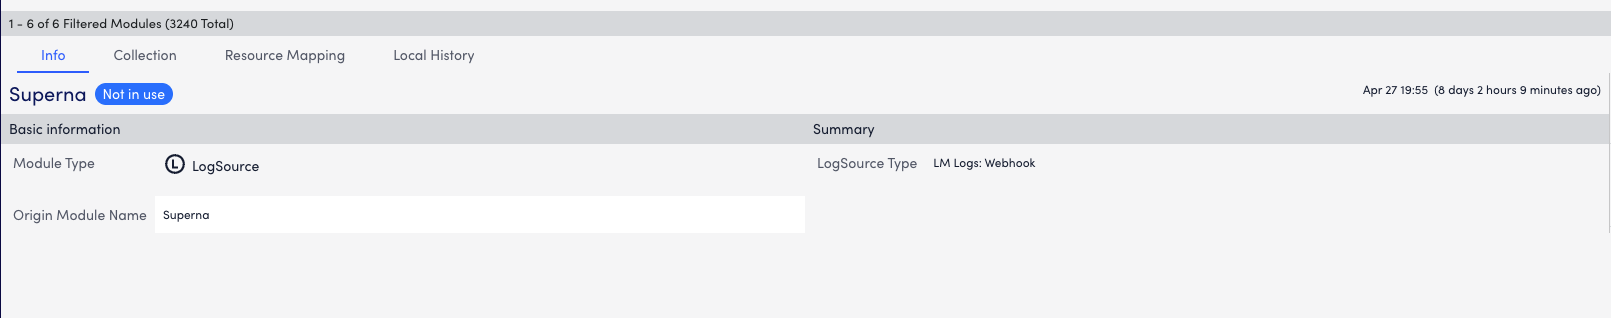
The word Bearer, followed by a single space, must precede the LogicMonitor Bearer Token.Create a log Source with name of Superna
Configuration Steps on Eyeglass Virtual Machine to Install the Feature Pak
- Download the Feature pak from the Superna Support site
- Copy the run file to the vm with winscp or other tool supporting scp
- login over ssh and chmod 777 <feature pak filename>.run
- Execute the run file ./<filename>.run
- Enter these into the Text User Interface, press esc after entering inputs, press v to validate, press I to install. Follow on screen instructions.
- LM_SOURCE_NAME = "superna" #This matches the log source created above
LM_ACCOUNT = "accountnamehere" # this is your account name visible in your instance url
LM_BEARER_TOKEN = "yy" #This is the bear token following the steps above
Configure Data Security Edition Zero Trust Webhooks
- The next step creates an Zero Trust Webhook URL.
- Configure Zero Trust endpoint in Integrations icon, Webhooks tab.
- Recommended Configuration: Only Critical and Major events and only the webhooks that set lockout or delayed lockout. Customers can customize based on specific requirements. The goal is to send findings versus a list of alarms that do not pinpoint a security incident.
- The endpoint url above will use localhost and will send Webhooks to the application service listening on port 5000. URL to use in the configuration
- http://localhost:5000/webhook
- Add the Content-Type header with value of application/json as shown above to complete the webhook configuration.
- Click save to commit the configuration.
- Click save on the main Webhook configuration page
- Configure Zero Trust endpoint in Integrations icon, Webhooks tab.
- Test the configuration is working following the next section
How to test the Integration with LogicMonitor
- To test the integration follow these steps
- download this curl command template and open with a text editor
- Copy all the text
- ssh to the eyeglass vm as the admin user
- paste the entire cli command to the ssh prompt to send sample data to the running Zero Trust application. This will send test data directly to the application to be processed and sent to LogicMonitor.
- The output of a successfully processed webhook test will return this text in the ssh terminal
- done sending event to abssiem and check for http 200 and success count in response
- How to review the process logs from the web application
- sudo -s
- journalctl -f -u defense
- This allows you to view the logs generated by the application.
- To log to a file and review with nano showing only the most recent 250 lines.
- journalctl -f -n 250 -u defense > /tmp/ztwebhook.log
- nano /tmp/ztwebhook.log
- In the log below the response code from the LogicMonitor api call should show sending status code
- Done
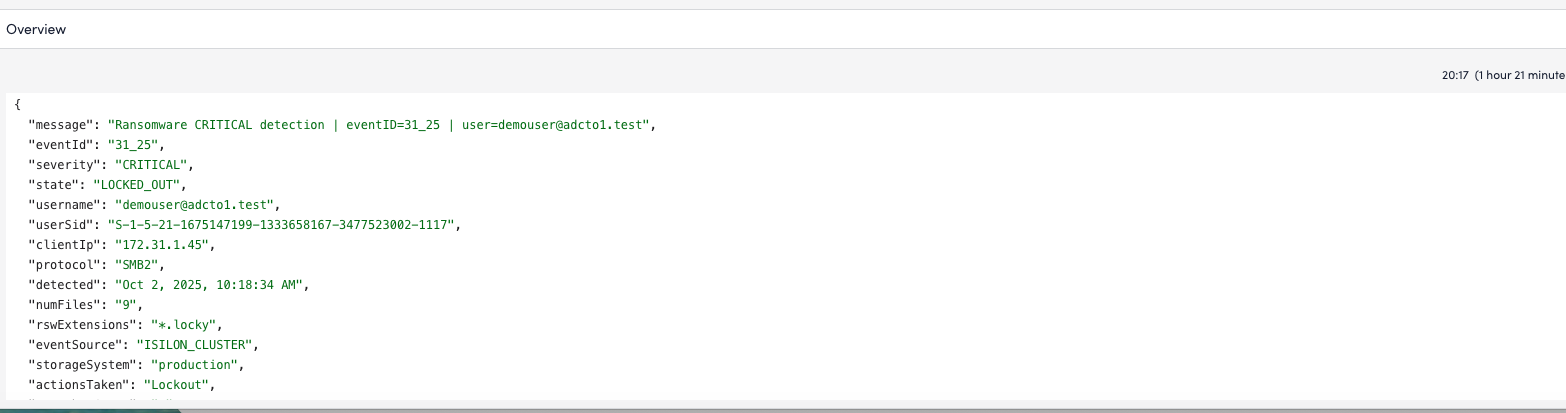
LogicMonitor Administrator Integration Experience
- Searching for Superna log messages

© Superna Inc