Fortinet FortiAnalyzer Zero trust to Incident Sync
- Overview
- Support Statement
- Limitations
- Solution Overview
- What is FortiAnalyzer?
- Integration Architecture
- Solution Configuration in FortiAnalyzer and Defender Zero Trust
- Prerequisites
- Features
- Configuration in FortiAnalyzer
- Configuration Steps on Eyeglass Virtual Machine
- High Level steps
- Configuration Step by Step
- Configure Defender Zero Trust Webhooks
- How to test the Integration with FortiAnalyzer
- FortiAnalyzer SecOps administrators Integration Experience
- FortiAnalyzer Playbook Integration
- Configuration of Connector
Overview
Customers using FortiAnalyzer can leverage this integration to send real time zero trust alerts using webhooks and maintain full payload parsing using json defined fields. The FortiAnalyzer Alert Ingestion Connector capability within the platform allows inbound webhook json payload to be parsed and turned into host status updates.
Support Statement
-
NOTE: This documentation is provided "as is" without support for 3rd party software. The level of support for this integration guide is best effort without any SLA on response time. No 3rd party product support can be provided by Superna directly. 3rd party components require support contracts
Limitations
- Does not lookup endpoint ID to set client ip to endpoint id or end user id to set the end user id. These entities would need to already exist or be created
Solution Overview
Superna Data Security Edition Zero Trust API is the cornerstone technology used to integrate with SIEM and SOAR platforms. This integration offers alerts mapped to a NAS storage host created in the FortiAnalyzer platform.
What is FortiAnalyzer?
FortiAnalyzer provides an AIOps-ready, business-aware IT monitoring platform that offers unified, end-to-end observability across complex, converging infrastructures, from cloud-to-edge, for organizations of all sizes.
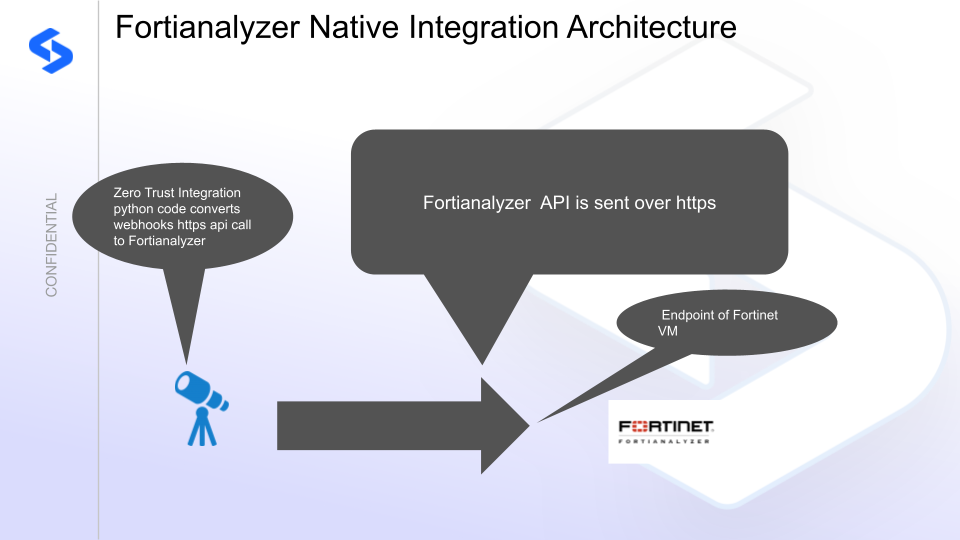
Integration Architecture
Solution Configuration in FortiAnalyzer and Defender Zero Trust
Prerequisites
- Installed Data Security Edition subscription product
- Eyeglass OS appliance version 15.5
- cat /etc/os-release
- License key for the Zero Trust API
- FortiAnalyzer on premise configured with https
Features
- Sends native Incident api calls and severity mapped from Superna to FortiAnalyzer
- Fields are mapped to FortiAnalyzer
- Updates to existing incidents in Superna Data Security Edition will not generate duplicate Incidents in FortiAnalyzer
- Updates are not appended as comments since no api support exists to update with comments.
Configuration in FortiAnalyzer
- Login to the console
- Click the Settings administrators view
- Create an administrator profile with read write permissions to Incident & Events. This is outside the scope of this guide. Consult Fortinet documentation. Example below.

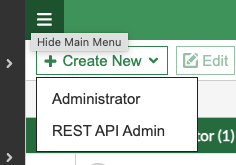
- Create an api admin and assign the profile above
- Create the trusted host ip section and enter the ip address of the Eyeglass VM, Set the admin profile to the one created above and set JSON API Access to Read-Write. NOTE Enter the dame of the Administrative domain you configured and select from the specify list. Example below it is named PROD.
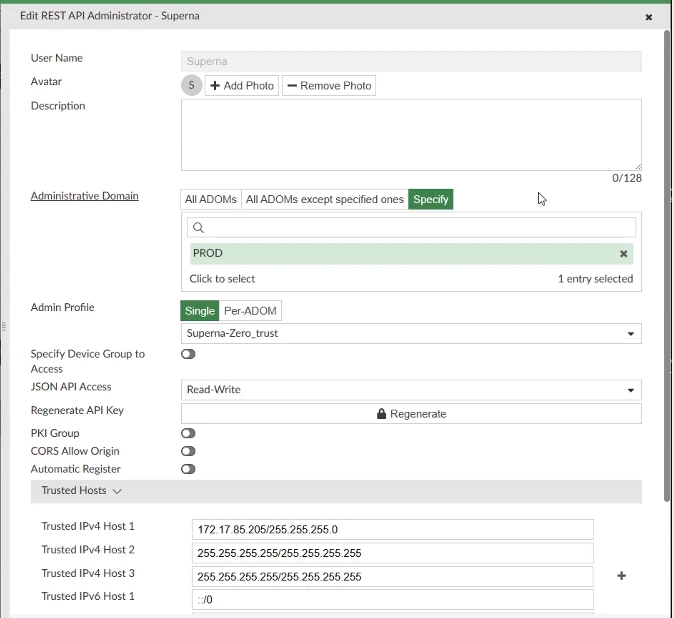
- Record the API token that is generated.
- If the GUI returns ipv6 error then use the CLI to create the user account available within the GUI where the trusthost ip and netmask is the ip address of the eyeglass VM. This assumes the admin profile has already be created and named Superna-Zero-Trust.

Record the api key generated from the last command
Configuration Steps on Eyeglass Virtual Machine
High Level steps
- Create python location to run the application on the Eyeglass vm
- Create python main application script
- Create linux systemd service and set to auto start
- Create Zero Trust configuration in Defender
- Update the main script to customize with FortiAnalyzer python code
- Test the script is running as a service
- Create a test event in Defender to validate the alerts appear as indexed parsed events in FortiAnalyzer
Configuration Step by Step
- Login to the eyeglass VM as admin user
- Follow the steps below
- From the support site download the integration run file
- scp or winscp copy the integration file to the eyeglass vm
- Login as admin over ssh
- sudo -s #enter admin password)
- chmod 777 /path to run file
- ./<integrationname>.run
- Input the configuration values into the TUI (Text User Interface)
- Press V to validate the inputs
- Press I to install
- The installation process should complete, review any errors for support. The last question asks to start the service answer yes
- Complete
Configure Defender Zero Trust Webhooks
- The next step creates an Zero Trust Webhook URL.
- Configure Zero Trust endpoint in Ransomware Defender Zero Trust tab.
- Recommended Configuration: Only Critical and Major events and only the webhooks that set lockout or delayed lockout. Customers can customize based on specific requirements. The goal is to send findings versus a list of alarms that do not pinpoint a security incident.
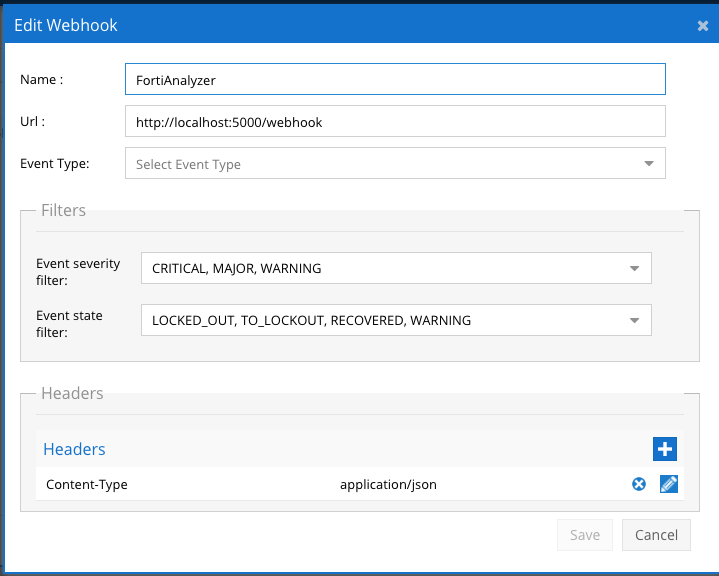
- The endpoint url above will use localhost and will send Webhooks to the application service listening on port 5000. URL to use in the configuration
- http://localhost:5000/webhook
- Add the Content-Type header with value of application/json as shown above to complete the webhook configuration.
- Click save to commit the configuration.
- Click save on the main Webhook configuration page
- Configure Zero Trust endpoint in Ransomware Defender Zero Trust tab.
- Test the configuration is working following the next section
How to test the Integration with FortiAnalyzer
- To test the integration follow these steps
- download this curl command template and open with a text editor
- Copy all the text
- ssh to the eyeglass vm as the admin user
- paste the entire cli command to the ssh prompt to send sample data to the running Zero Trust application. This will send test data directly to the application to be processed and sent to FortiAnalyzer.
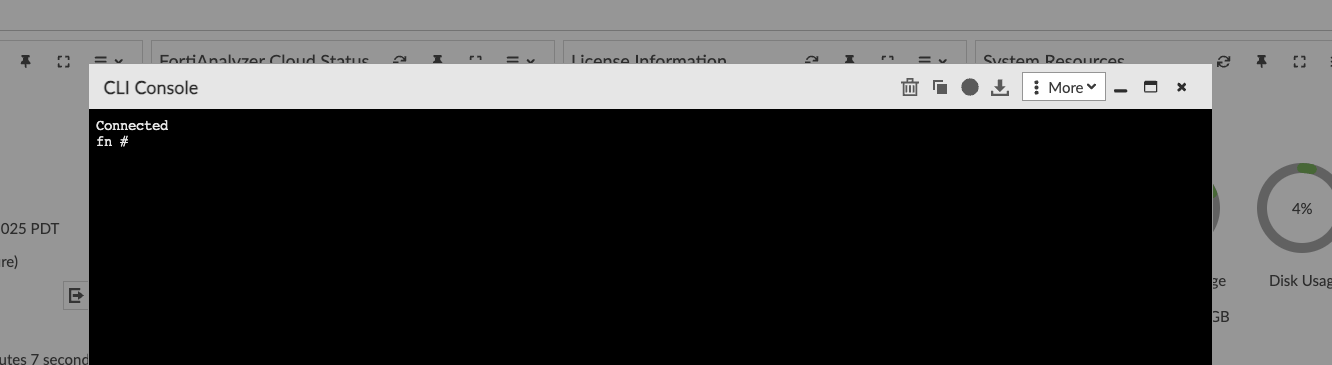
- The output of a successfully processed webhook test will return this text in the ssh terminal
- done sending event to abssiem and check for http 200 and success count in response
- How to review the process logs from the web application
- sudo -s
- journalctl -f -u fortianalyzer
- This allows you to view the logs generated by the application.
- To log to a file and review with nano showing only the most recent 250 lines.
- journalctl -f -n 250 -u fortianalyzer > /tmp/ztwebhook.log
- nano /tmp/.log
- In the log below the response code from the FortiAnalyzer api call should show http 200 status code and successCount 1 to indicate the Finding was successfully created.
- You can also view .log for specific error messages.
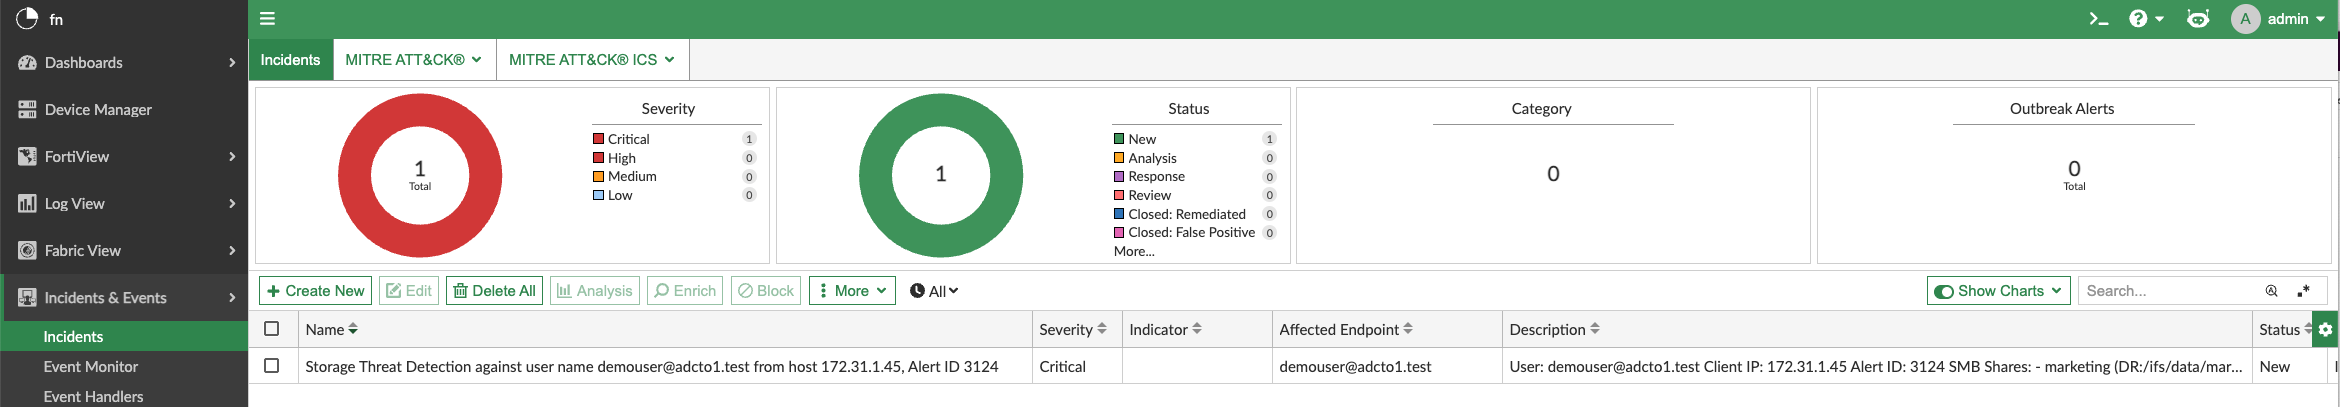
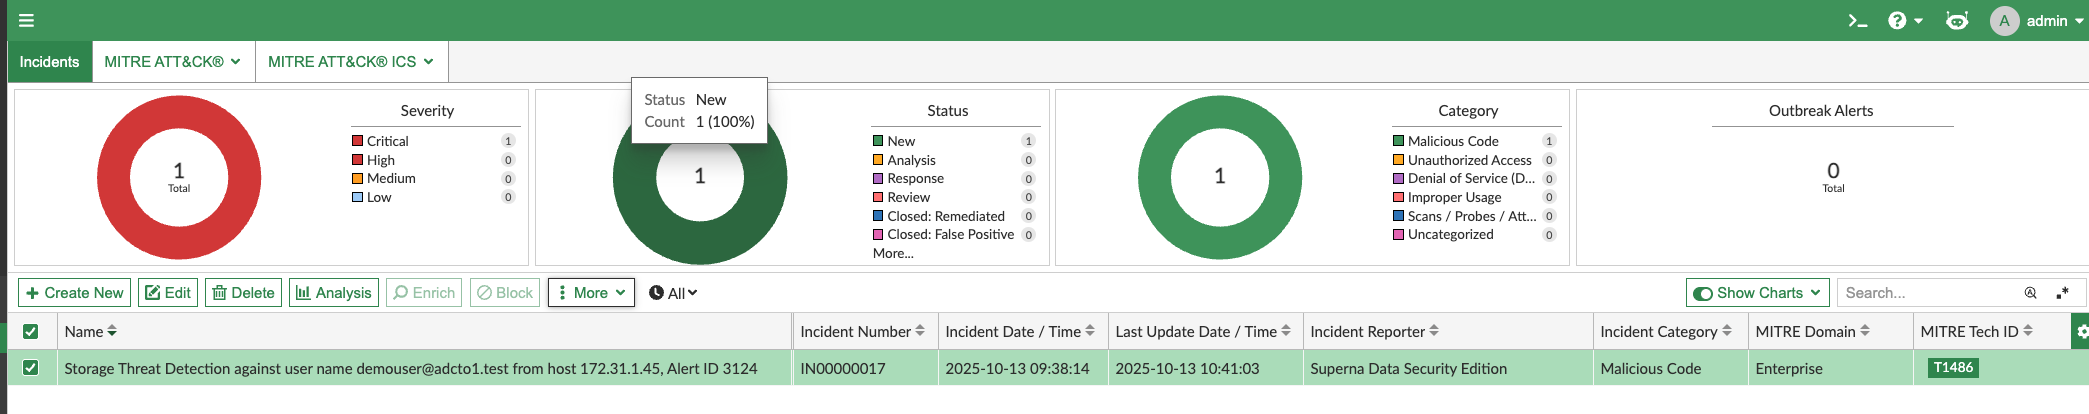
- Login to the FortiAnalyzer Main Dashboard to run a search for all supernaZT source messages. enter a search with sourcetype="supernaZT" to locate events sent from testing.
- Done
FortiAnalyzer SecOps administrators Integration Experience
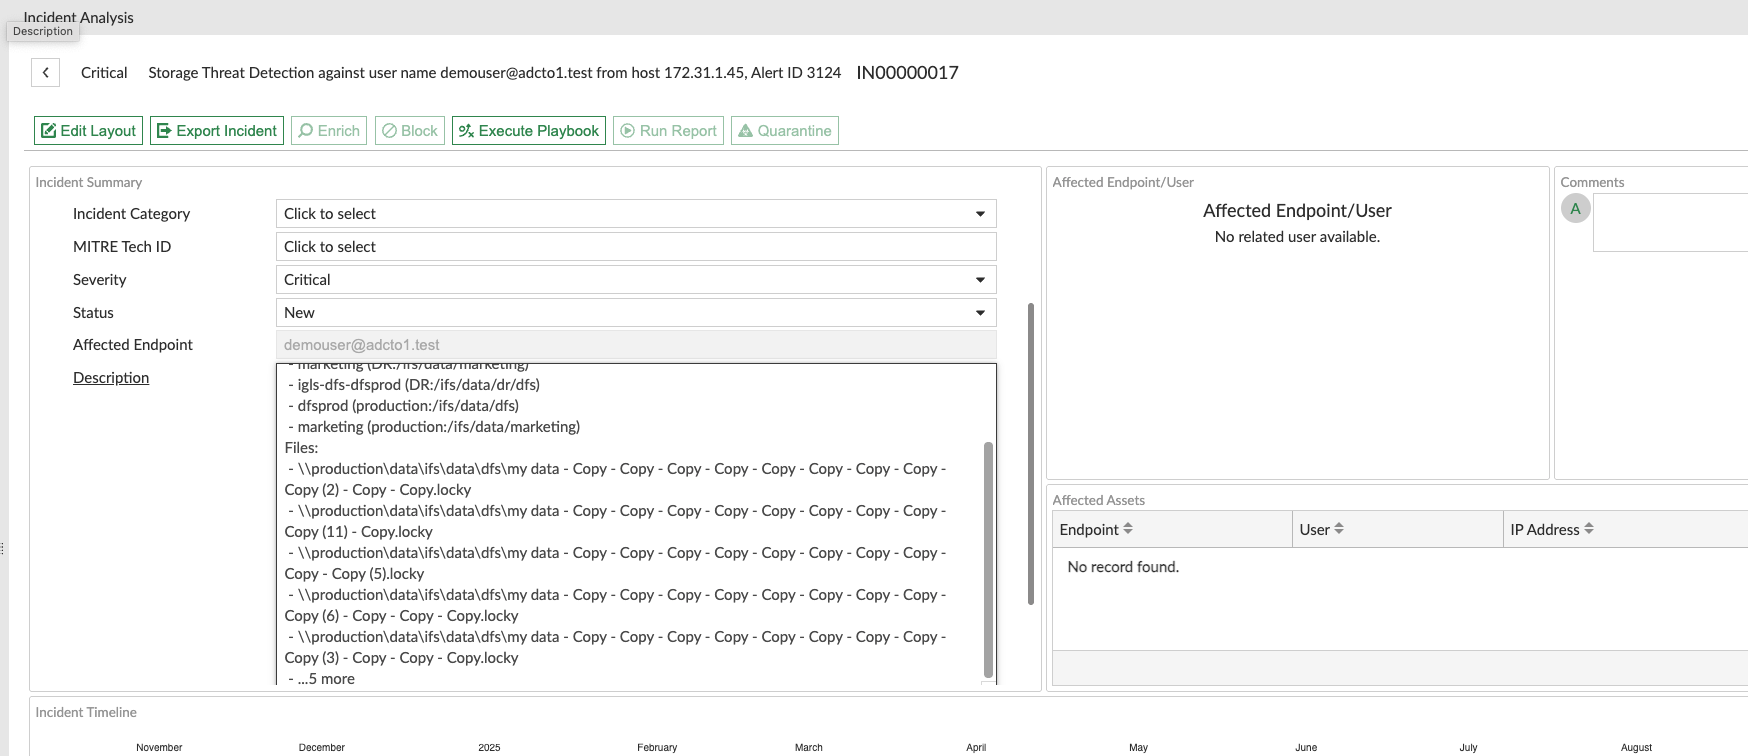
FortiAnalyzer Playbook Integration
Configuration of Connector
- Click Automations
- Create New
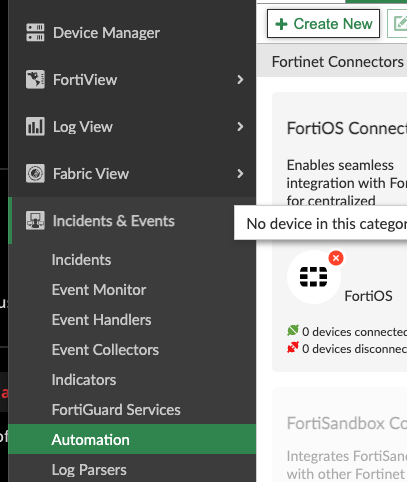
- Select Generic
- Fill in the fields as per below and replace the ip address with the IP of your eyeglass VM,
- Click add custom http header and enter api_key and paste an API token created from Eyeglass Integrations Icon for the value.
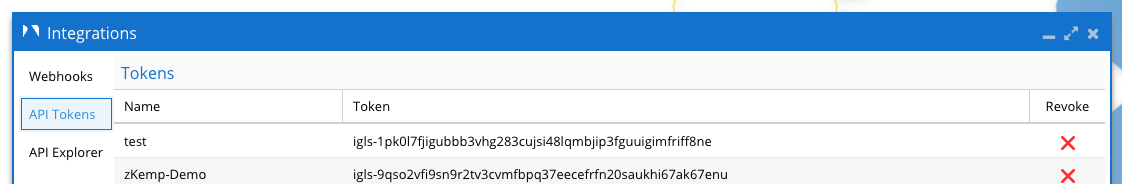
- The url to copy and paste and edit is here https://x.x.x.x/sera/v2/ransomware/criticalpaths
- Click add custom http header and enter api_key and paste an API token created from Eyeglass Integrations Icon for the value.
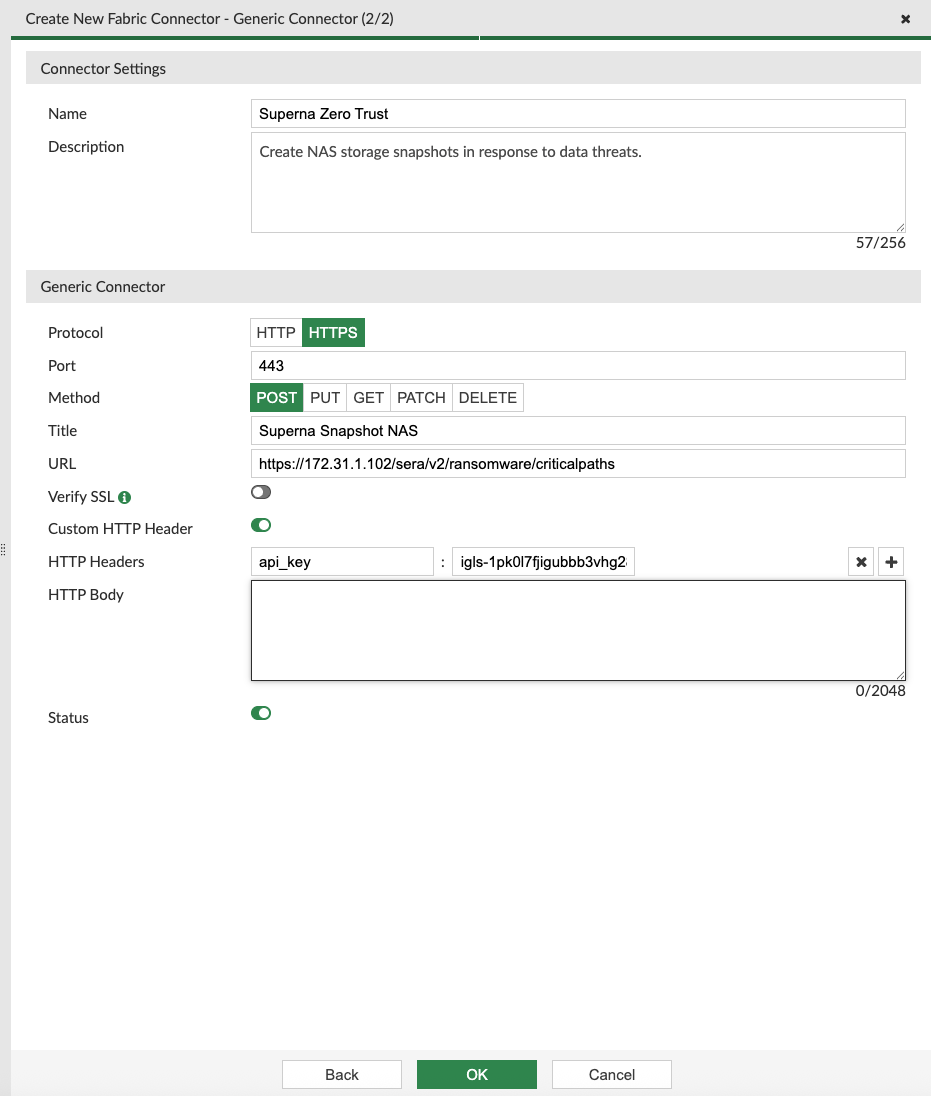
- Click OK to create.
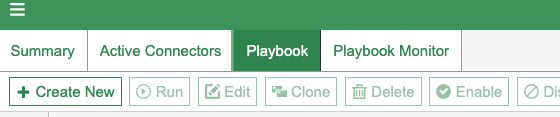
- Click Playbooks and Create new playbook
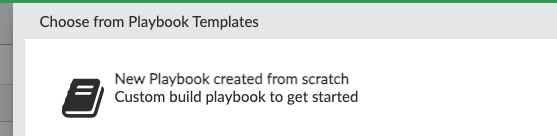
- Select above option and then select on demand
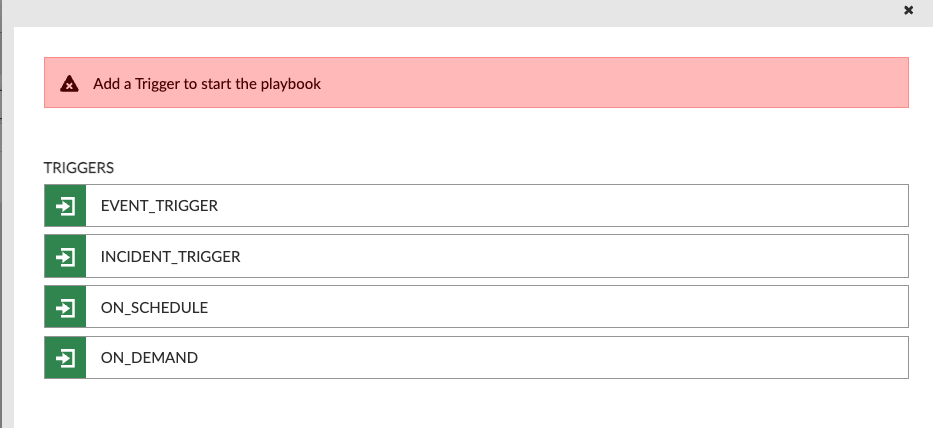
- Then Click Save
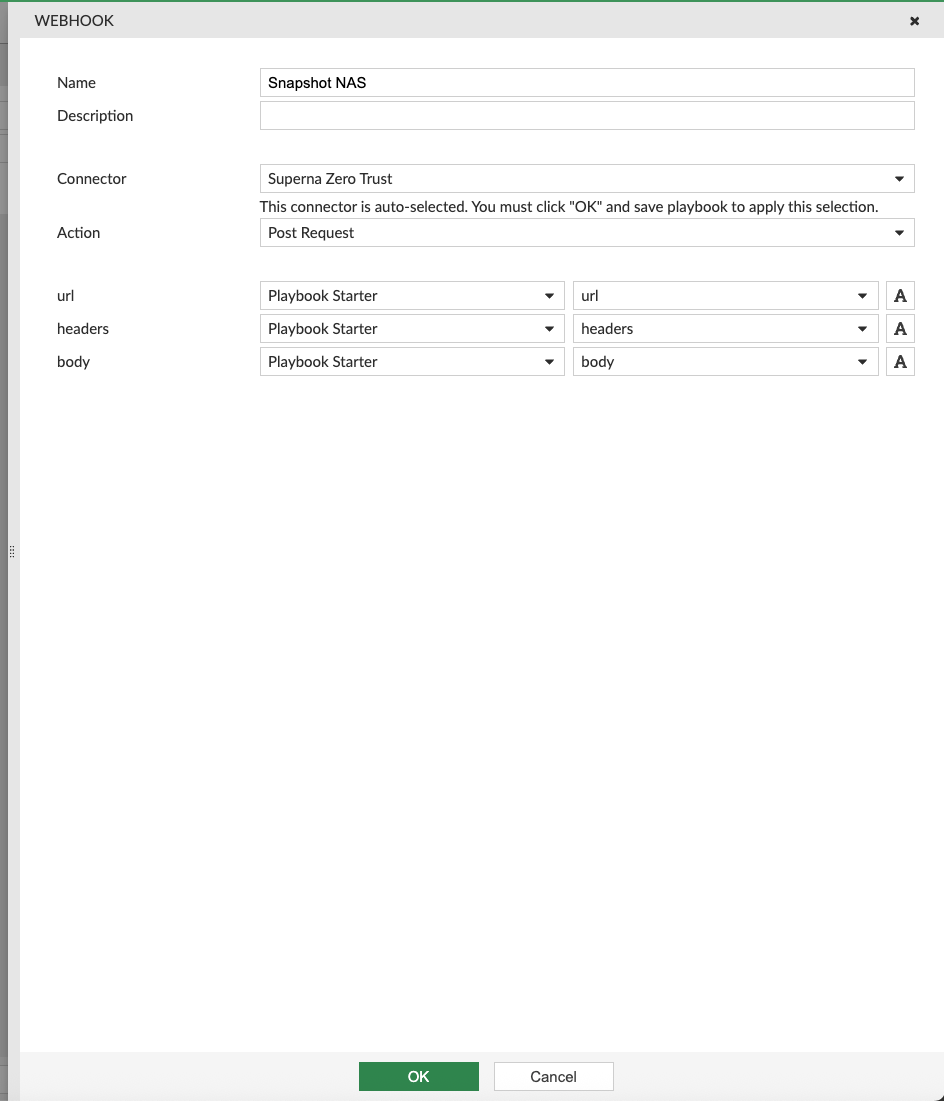
- Now drag an arrow of the on demand block to add an action
- Select Generic webhook and fill in the fields as shown