ElasticSearch SIEM Zero Trust alert integration
- Overview
- Support Statement
- Limitations
- Solution Overview
- Advanced Zero Trust Capabilities
- What is ElasticSearch SIEM?
- Integration Architecture
- Solution Configuration in ElasticSearch SIEM and Data Security Edition Zero Trust
- Prerequisites
- Configuration in ElasticSearch SIEM
- Configuration Steps on Eyeglass Virtual Machine
- High Level steps
- Configuration Step by Step
- Configure the Service start and python integration files
- Configure the python packages and customize the ElasticSearch SIEM integration python code
- Configure Defender Zero Trust Webhooks
- How to test the Integration with ElasticSearch SIEM
- ElasticSearch SIEM SecOps administrators Integration Experience
Overview
Elastic SIEM (Security Information and Event Management) is a powerful security platform built on top of the Elastic Stack, which includes Elasticsearch, Logstash, and Kibana. It provides a centralized way to collect, normalize, and analyze security-related data from various sources, offering real-time threat detection and response capabilities
Support Statement
-
NOTE: This documentation is provided "as is" without support for 3rd party software. The level of support for this integration guide is best effort without any SLA on response time. No 3rd party product support can be provided by Superna directly. 3rd party components require support contracts
Limitations
- None
Solution Overview
Superna Defender Zero Trust API receives webhook alerts and parses the key data into a HTTP API payload events that are sent to ElasticSearch SIEM endpoint url. ElasticSearch SIEM is a modular architecture that provides real-time visibility of your IT infrastructure, which you can use for threat detection and prioritization. The ElasticSearch solution uses the Custom HTTP Endpoint Logs Integration.
Advanced Zero Trust Capabilities
- Webhook to native HTTP endpoint with json custom payload
What is ElasticSearch SIEM?
Integration Architecture
.png)
Solution Configuration in ElasticSearch SIEM and Data Security Edition Zero Trust
Prerequisites
- Installed Security Edition
- Eyeglass OS appliance version 15.5
- cat /etc/os-release
- License key for the Zero Trust API
- ElasticSearch SIEM On premise
- ElasticSearch SIEM SaaS
Configuration in ElasticSearch SIEM
The steps below to create a collector endpoint.
- Login to create the http custom collector
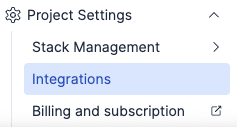 Select Project settings and Integrations
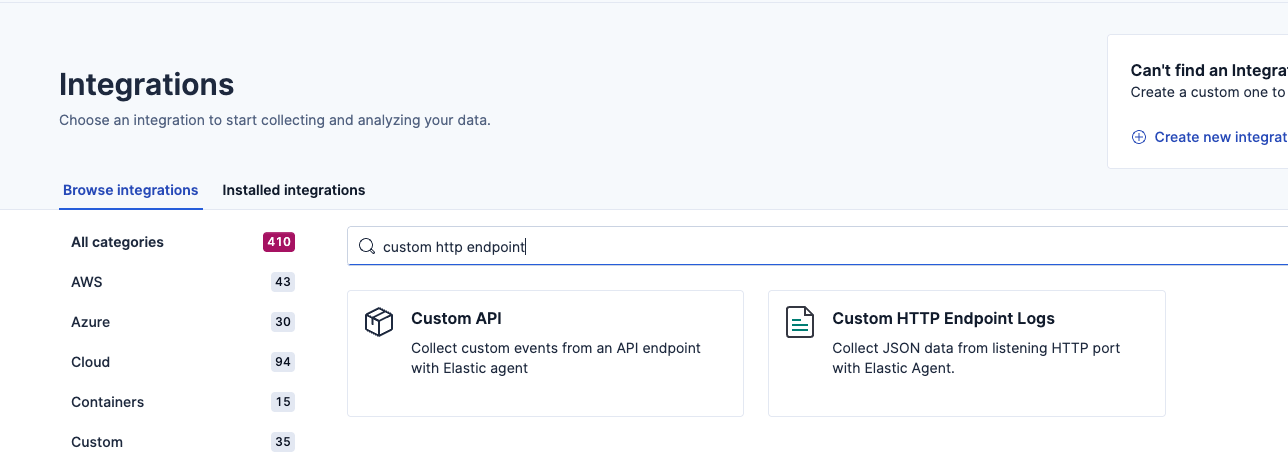
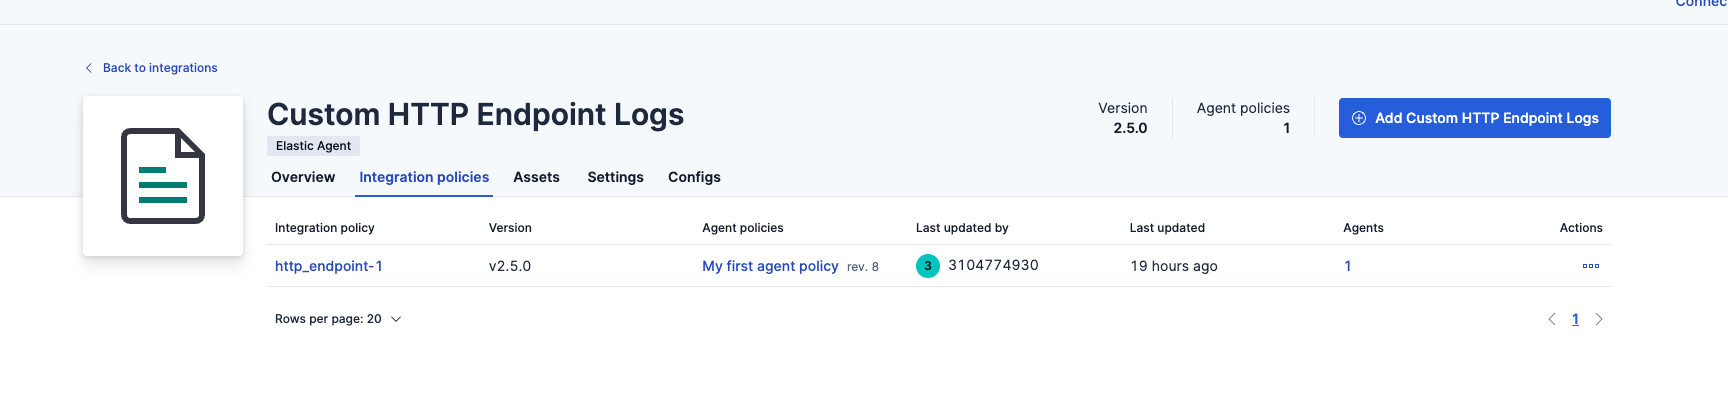
- Select Custom HTTP endpoint logs
- Click install option and follow the guide to install an agent.
- https://www.elastic.co/docs/reference/fleet/install-fleet-managed-elastic-agent
- Once the agent is deployed and registered on an on premise host that has IP reachability to the Eyeglass vm and firewall port eyeglass --> TCP 8080 --> elastic agent host.
- NOTE: Record the IP address of the Elastic Agent, this will be used in the Eyeglass integration code to send formatted json payload alerts to the Elastic agent over port 8080
- Click Add Custom HTTP Endpoint Logs integration
- Change the listening port from local host to 0.0.0.0 for the agent.
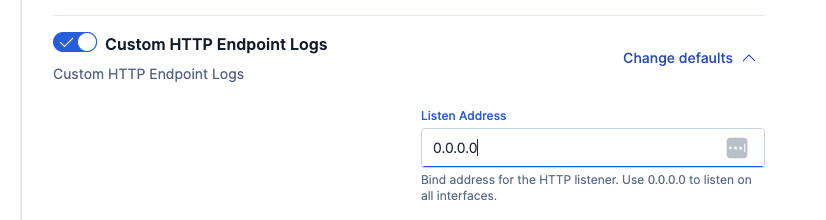
- Leave all other defaults to create the agent and http policy
- Completed integration with agent running.
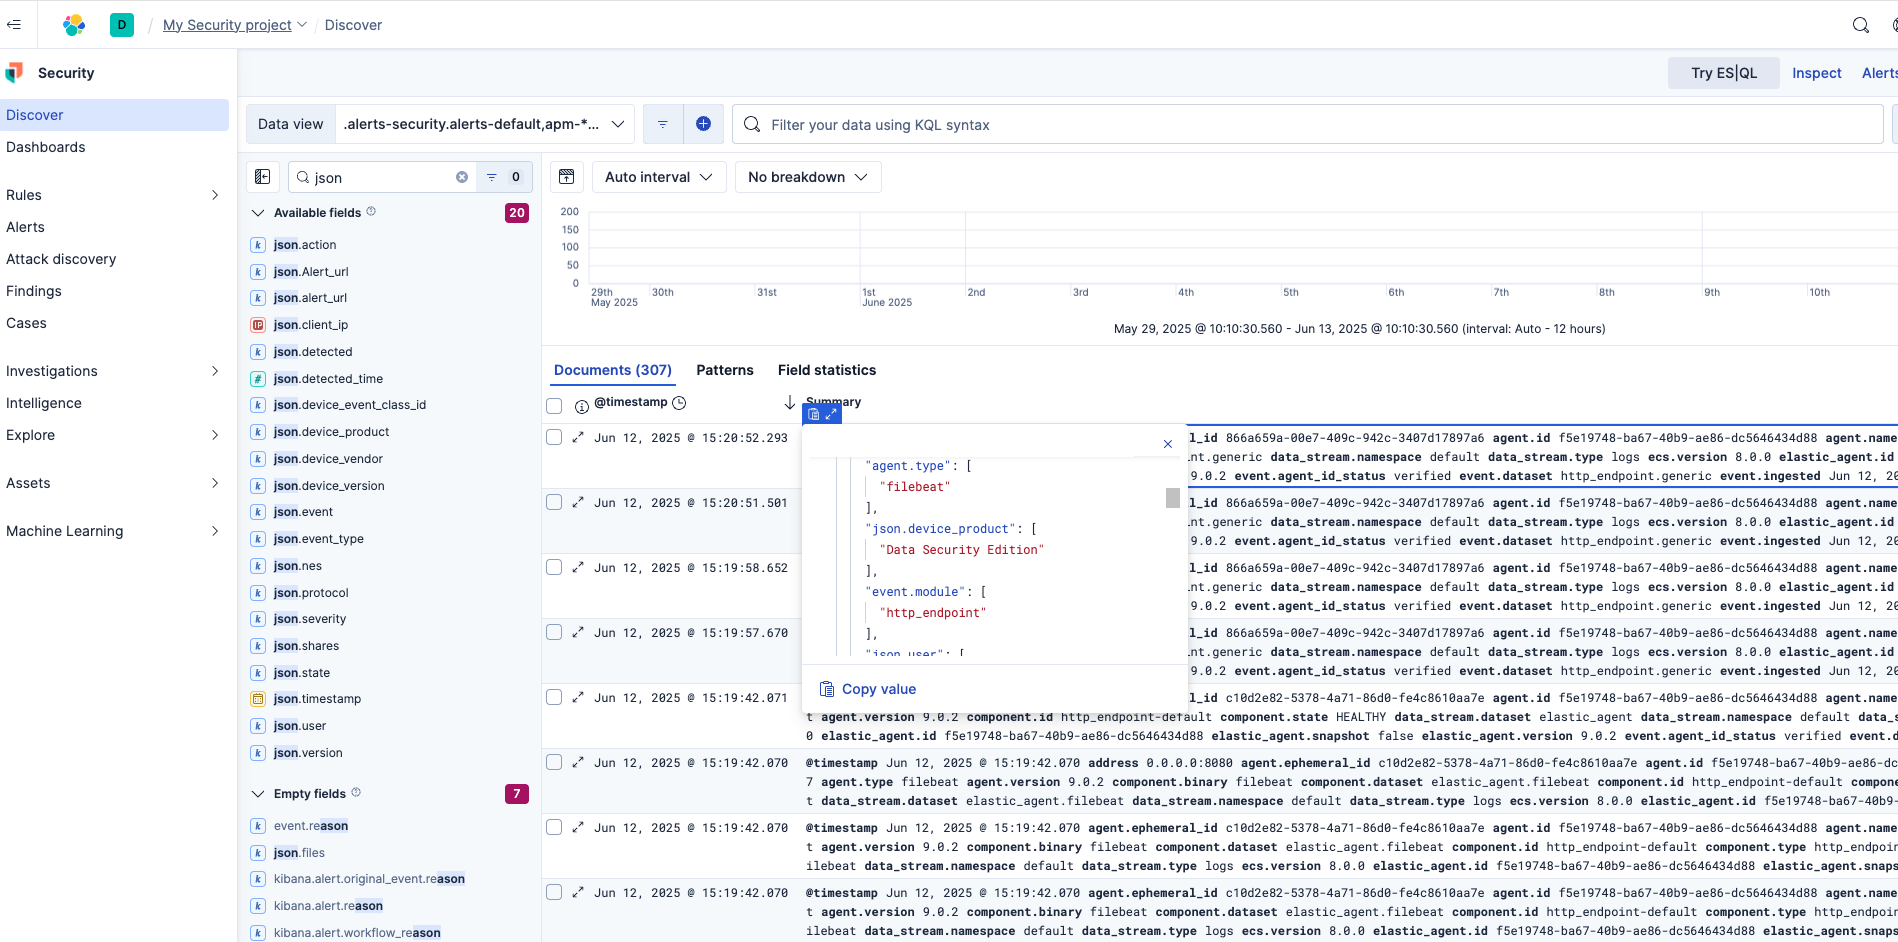
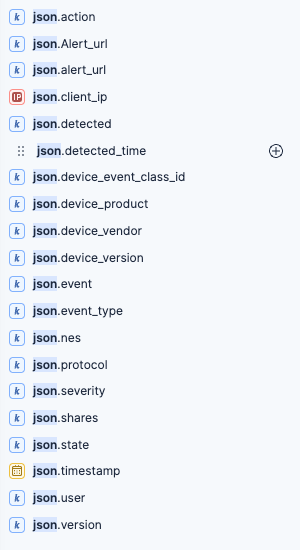
- NOTE: The http endpoint agent accepts http over 8080 port with json payload that is indexed using json.fieldname within the index. The Superna Zero trust field names that are encoded.
- {"@timestamp": ["2025-06-12T19:20:52.293Z"],"agent.ephemeral_id": ["866a659a-00e7-409c-942c-3407d17897a6"],"agent.id": ["f5e19748-ba67-40b9-ae86-dc5646434d88"],"agent.name": ["rapid7"],"agent.name.text": ["rapid7"],"agent.type": ["filebeat"],"agent.version": ["9.0.2"],"data_stream.dataset": ["http_endpoint.generic"],"data_stream.namespace": ["default"],"data_stream.type": ["logs"],"ecs.version": ["8.0.0"],"elastic_agent.id": ["f5e19748-ba67-40b9-ae86-dc5646434d88"],"elastic_agent.snapshot": [false],"elastic_agent.version": ["9.0.2"],"event.agent_id_status": ["verified"],"event.dataset": ["http_endpoint.generic"],"event.ingested": ["2025-06-12T19:21:01.000Z"],"event.module": ["http_endpoint"],"input.type": ["http_endpoint"],"json.action": ["Lockout | Comment | Comment | Comment | Comment | Comment | Comment | Comment | Comment | Comment | Comment | Comment"],"json.Alert_url": ["https://172.31.1.102/rsw/alerts/25:24"],"json.client_ip": ["172.31.1.45"],"json.detected": ["Jan 8, 2025, 10:18:34 AM"],"json.detected_time": [1742410571000],"json.device_event_class_id": ["security"],"json.device_product": ["Data Security Edition"],"json.device_vendor": ["Superna"],"json.device_version": ["V1"],"json.event": ["25:24"],"json.event_type": ["threat_detection"],"json.files": ["\\\\production\\data\\ifs\\data\\dfs\\my data - Copy - Copy - Copy - Copy - Copy - Copy - Copy - Copy - Copy (2) - Copy - Copy.locky; \\\\production\\data\\ifs\\data\\dfs\\my data - Copy - Copy - Copy - Copy - Copy - Copy - Copy - Copy - Copy (11) - Copy.locky; \\\\production\\data\\ifs\\data\\dfs\\my data - Copy - Copy - Copy - Copy - Copy - Copy - Copy - Copy - Copy - Copy (5).locky; \\\\production\\data\\ifs\\data\\dfs\\my data - Copy - Copy - Copy - Copy - Copy - Copy - Copy - Copy - Copy (6) - Copy - Copy - Copy.locky; \\\\production\\data\\ifs\\data\\dfs\\my data - Copy - Copy - Copy - Copy - Copy - Copy - Copy - Copy - Copy (3) - Copy - Copy - Copy.locky; \\\\production\\data\\ifs\\data\\dfs\\my data - Copy - Copy - Copy - Copy - Copy - Copy - Copy - Copy - Copy (10) - Copy.locky; \\\\production\\data\\ifs\\data\\dfs\\my data - Copy - Copy - Copy - Copy - Copy - Copy - Copy - Copy - Copy (4) - Copy - Copy - Copy - Copy.locky; \\\\production\\data\\ifs\\data\\dfs\\my data - Copy - Copy - Copy - Copy - Copy - Copy - Copy - Copy - Copy (11) - Copy - Copy.locky; \\\\production\\data\\ifs\\data\\dfs\\my data - Copy - Copy - Copy - Copy - Copy - Copy - Copy - Copy - Copy (10) - Copy - Copy.locky; \\\\production\\data\\ifs\\data\\dfs\\my data - Copy - Copy - Copy - Copy - Copy - Copy - Copy - Copy - Copy (12) - Copy.locky"],"json.nes": ["production"],"json.protocol": ["SMB2"],"json.severity": ["CRITICAL"],"json.shares": ["marketing; igls-dfs-dfsprod; dfsprod; marketing"],"json.state": ["LOCKED_OUT"],"json.timestamp": ["2025-03-19T18:56:11.000Z"],"json.user": ["demouser@adcto1.test"],"json.version": ["1.0"],"tags": ["forwarded"],"_id": "AZdllgSvSrYFFhOni4Sm","_ignored": ["json.files"],"_index": ".ds-logs-http_endpoint.generic-default-2025.06.12-000001","_score": null}
Configuration Steps on Eyeglass Virtual Machine
High Level steps
- Create python location to run the application on the Eyeglass vm
- Create python main application script
- Create linux systemd service and set to auto start
- Create Zero Trust configuration in Data Security Edition
- Update the main script to customize with ElasticSearch SIEM python code
- Test the script is running as a service
- Create a test event in Defender to validate the alerts appear as indexed parsed events in ElasticSearch SIEM
Configuration Step by Step
Configure the Service start and python integration files
-
Login to the Eyeglass VM via SSH as the admin userssh admin@<your-vm-ip># Become rootsudo -s
mkdir -p /opt/superna/cgi-bin
chown -R sca:users /opt/superna/cgi-binchmod -R u+rwX,g+rwX /opt/superna/cgi-bin# become SCA user
sudo -u sca -s
cd /opt/superna/cgi-bin
python3 -m venv venv-elasticsearch
source venv-elasticsearch/bin/activate
pip install flask requests
deactivate
# Create required filestouch elasticsearch.pytouch elasticsearch.sh# Make scripts executablechmod +x elasticsearch.pychmod +x elasticsearch.sh# Create the elasticsearch.sh launch scriptnano /opt/superna/cgi-bin/elasticsearch.sh# past contents below into the file
#!/bin/bashexport PATH="/opt/.pyenv/bin:$PATH"source /opt/superna/cgi-bin/venv-elasticsearch/bin/activateexec python /opt/superna/cgi-bin/elasticsearch.py# Make the launch script executablechmod +x /opt/superna/cgi-bin/elasticsearch.sh## exit from being SCA user
exit
whoami
### make sure you are the root user again for these steps
# Create the systemd service unit filenano /etc/systemd/system/elasticsearch.service#Paste the contents below into the file
[Unit]Description=Webhook listener for Zero Trust API translations and integrationsAfter=network.target[Service]Type=simpleUser=scaGroup=usersWorkingDirectory=/opt/superna/cgi-binExecStart=/bin/bash /opt/superna/cgi-bin/elasticsearch.shRestart=alwaysRestartSec=5[Install]WantedBy=multi-user.target# Reload systemd to recognize the new servicesystemctl daemon-reload# Enable the service to start on boot (do NOT start it yet)systemctl enable elasticsearch
Configure the python packages and customize the ElasticSearch SIEM integration python code
- Customize the application code by downloading the python code from this link to download
- Open the python template file in a text editor. NOTE: make sure to only replace the values and do not delete any of the commas
- Locate this section in the file and replace the yellow sections to match your ElasticSearch SIEM on premise endpoint URL. The endpoint url is unique and can be copied from the console into the variable below.
- # ElasticSearch SIEM HTTP Collector Endpointelastic_URL = "https://x.x.x.x:8080/"
- ElasticSearch SIEM SaaS - can leverage an endpoint on the Internet by making the following change to the headers section. This will require an API token and to modify the headers section by copying this block of text and replacing the existing headers section and replace the yellow with the token created in the ElasticSearch SaaS endpoint.
- ELASTIC_HEADERS = {"Content-Type": "application/json","Authorization": "Basic yyyyyyyyyy"}
- nano /opt/superna/cgi-bin/elasticsearch.py
- Open the file locally in Windows OS notepad and use control-A or select all the text in the python template
- Paste the clipboard into the ssh terminal session with the open nano editor file
- save the file
- press control+x
- Answer yes to save and exit the nano editor
- Start the service and verify it is running
- systemctl start elasticsearch
- systemctl status -l elasticsearch
- Verify the service is started successfully and returns "active and running".
- If the service does not start do not proceed and double check the steps above are completed.
Configure Defender Zero Trust Webhooks
- The next step creates an Zero Trust Webhook URL.
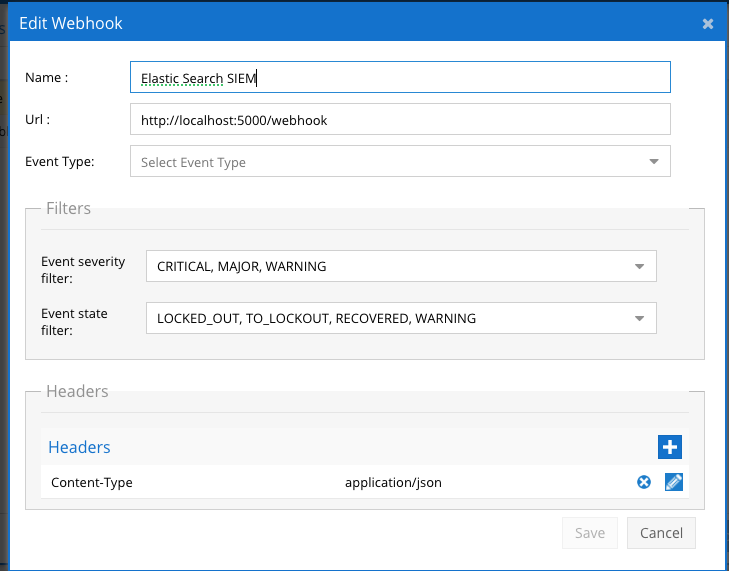
- Configure Zero Trust endpoint in Ransomware Defender Zero Trust tab.
- Recommended Configuration: Only Critical and Major events and only the webhooks that set lockout or delayed lockout.Customers can customize based on specific requirements. The goal is to send findings versus a list of alarms that do not pinpoint a security incident.
- The endpoint url above will use localhost and will send Webhooks to the application service listening on port 5000. URL to use in the configuration
- http://localhost:5000/webhook
- Add the Content-Type header with value of application/json and the content-encoding with value gzip as shown above to complete the webhook configuration.
- Click save to commit the configuration.
- Click save on the main Webhook configuration page
- Recommended Configuration: Only Critical and Major events and only the webhooks that set lockout or delayed lockout.Customers can customize based on specific requirements. The goal is to send findings versus a list of alarms that do not pinpoint a security incident.
- Configure Zero Trust endpoint in Ransomware Defender Zero Trust tab.
- Test the configuration is working following the next section
How to test the Integration with ElasticSearch SIEM
- To test the integration follow these steps
- Prerequisites In ElasticSearch SIEM and Eyeglass:
- Get the ip address of the Eyeglass vm
- download this curl command template and open with a text editor and locate the ip address of eyeglass at the very end of text and replace the ip address with the IP address of your eyeglass vm.
- Copy all the text in the text editor
- ssh to the eyeglass vm as the admin user
- Paste the entire cli command text to the ssh prompt to send sample data to the running Zero Trust application. This will send test data directly to the application to be processed and sent to ElasticSearch SIEM SIEM Integration service that is running on the Eyeglass VM.
- The output of a successfully processed webhook test will return this text in the ssh terminal
- done sending event to ElasticSearch SIEM and check for http 200 and success count in response
- How to review the process logs from the web application
- sudo -s
- journalctl -f -u ElasticSearch SIEM
- This allows you to view the logs generated by the application.
- To log to a file and review with nano showing only the most recent 250 lines.
- journalctl -f -n 250 -u elasticsearch > /tmp/elasticsearch.log
- nano /tmp/elasticsearch
- In the log below the response code from the ElasticSearch SIEM api call should show http 200 status code and successCount 1 to indicate the Finding was successfully created.
- You can also view ElasticSearch SIEM.log for specific error messages.
- Done
ElasticSearch SIEM SecOps administrators Integration Experience
Example case created but the integration.