DASM Administration Guide
- Administration and Feature Usage
- Typical Use Cases
- Data Attack Surface Manager Main Dashboard
- Data Attack Surface Manager Offensive Actions
- Dynamic DataShield Policy Operations
- Overview Video
- Data Classification - How it Works
- Data Classification Categories
- Identity & Demographics (6)
- Medical - Healthcare (3)
- Sensitive Numbers & Codes (7)
- Digital Identifiers & Network Data (6)
- Location-Based Identifiers (2)
- Professional & Organizational (2)
- National IDs (Non-US) (1)
- Summary Table
- Data Classification Exposure Analytics
- SMB/NFS PII Exposure Detection
- How this capability helps reduce risk
- Permission vs. Usage Over-Exposure Analysis
- How This Capability Helps Reduce Risk
- Data Risk & Exposure Dashboard
- Data Integrity Dashboard
- Overview
- How it Works
- Why Traditional Defenses Fall Short
- Dashboard with Data Integrity Scores
- Operations
- Local Login
- Active Directory Login
- AD Authentication Configuration
- 2FA with Google Authenticator
- Alert and Webhook Configuration with Data Security Edition
- Sample DVM webhook Json payload for Data Containment policy Enforcement
- Sample Json payload for missing or stale Vulnerability Scans
- Software Start/Stop
- Log Gather For Support
- Data Classification Configuration
Administration and Feature Usage
Typical Use Cases
- Identify high risk hosts for rapid remediation, patching and hardening.
- Features needed: The base feature that produces an AI predicted data attack surface
- High Security Data Risk. Set security baseline for hosts or users to access data
- Features needed: Dynamic DataShield autonomous enforcement policies
Data Attack Surface Manager Main Dashboard
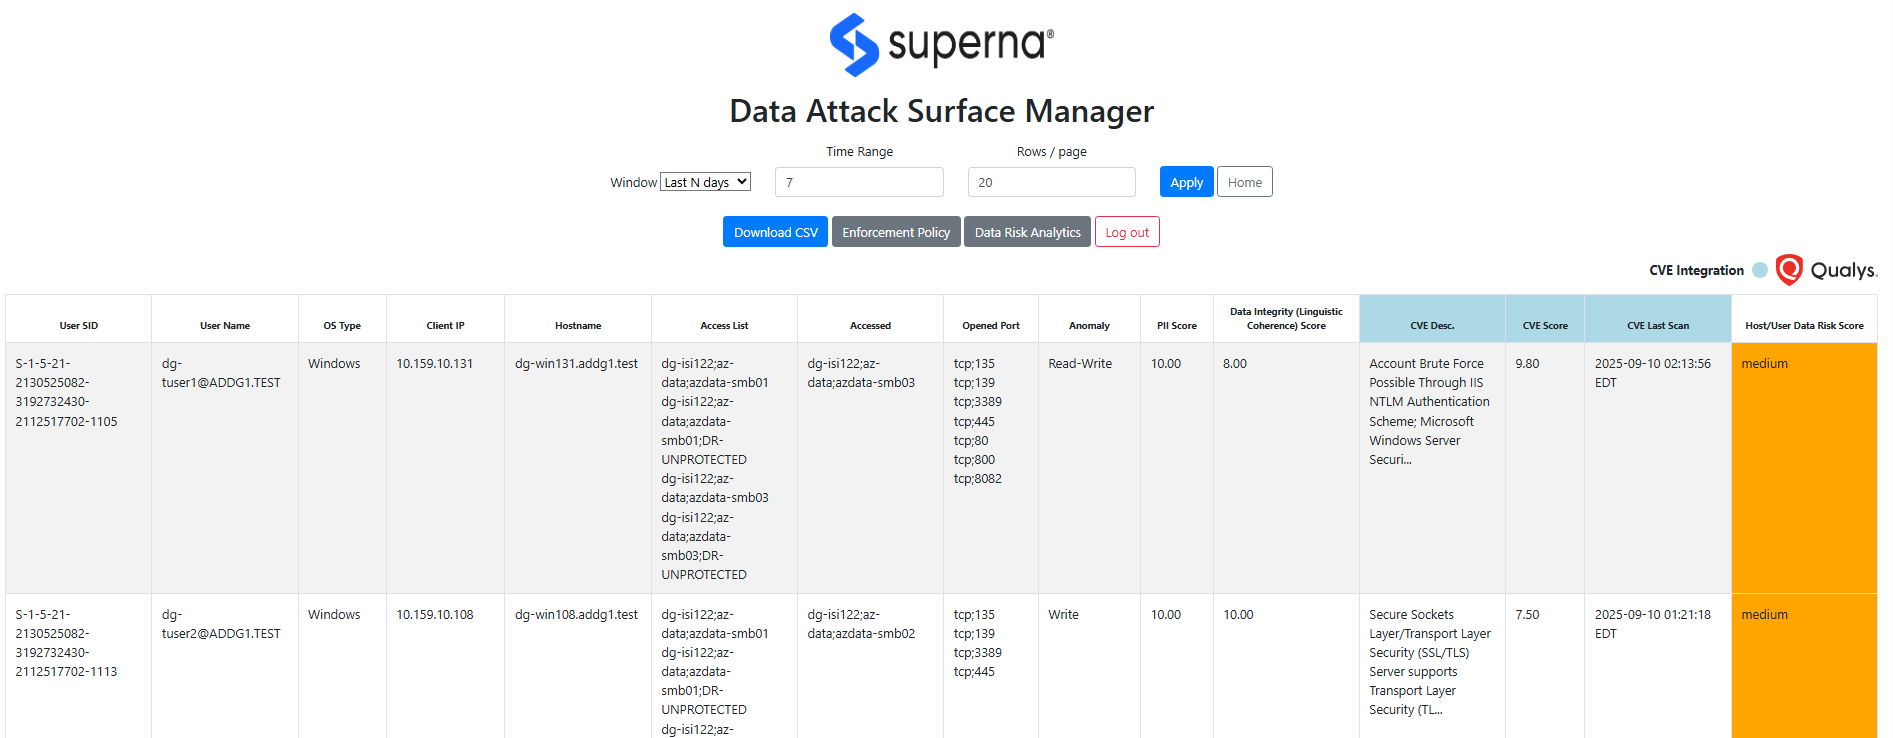
- The main dashboard shows the data attack surface.
- The columns indicate the contributing factors to the Data Risk Score shown the Vulnerability Level.
- If Data Classification is enabled. The PII score rates the level of PII data that was detected from this host and user combination.
- OS Type - The OS of the client machine indicates what OS is accessing the storage.
- The Access list shows the number of SMB or NFS exports the host has access to by user or by ip address
- The list of SMB/NFS shares that have been accessed in the last 7 days shows the usage view along side the permissions view. This provides a data overexposed view of data that allows remediation to focus on users and hosts where a lot of permissions exist with very little usage.
- Open ports indicates the listening ports on the client that could be used by an attacker to compromise the host.
- The Anomaly column indicates if the user behavior profile indicates any abnormal deviations of reads or writes to data that would indicate suspicious user behavior.
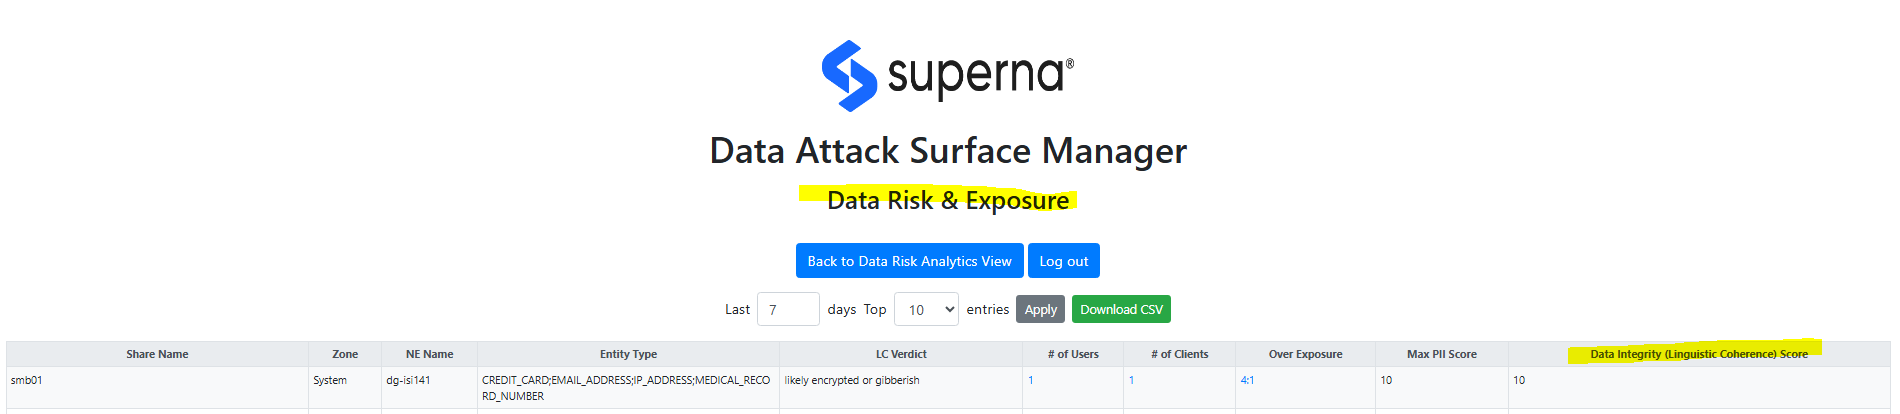
- Data Integrity score (linguistic coherence) - shows the linguistic coherence of the file. This technology reads the content of files and can detect subtle data encryption of a slow attack or GenAI attack on the meaning of the data. It scores the probablity the content is low quality or modified and has lost it's semantic meaning.
- The CVE score is an average of all CVE found in the scan results.
- The CVE description shows a list of some of the CVE's found on the host.
- The CVE last scan indicates how current the scan results are when used to predict the Data Risk Score
Data Attack Surface Manager Offensive Actions
- Offensive Remediation:
- DVM supports remediation for high risk hosts and users with host level blocking. This allows high risk hosts to be blocked from accessing data until remediation can be completed and unblocking allows the host to access data.
- Risk Discovery
- Identify Data Attack Surface hosts with no vulnerability scan results exposing data and user accounts to breach from zero day or malicious actor that has joined a machine to the network.

- SOC Analysts can chose to block hosts without a completed vulnerability scan assessment.
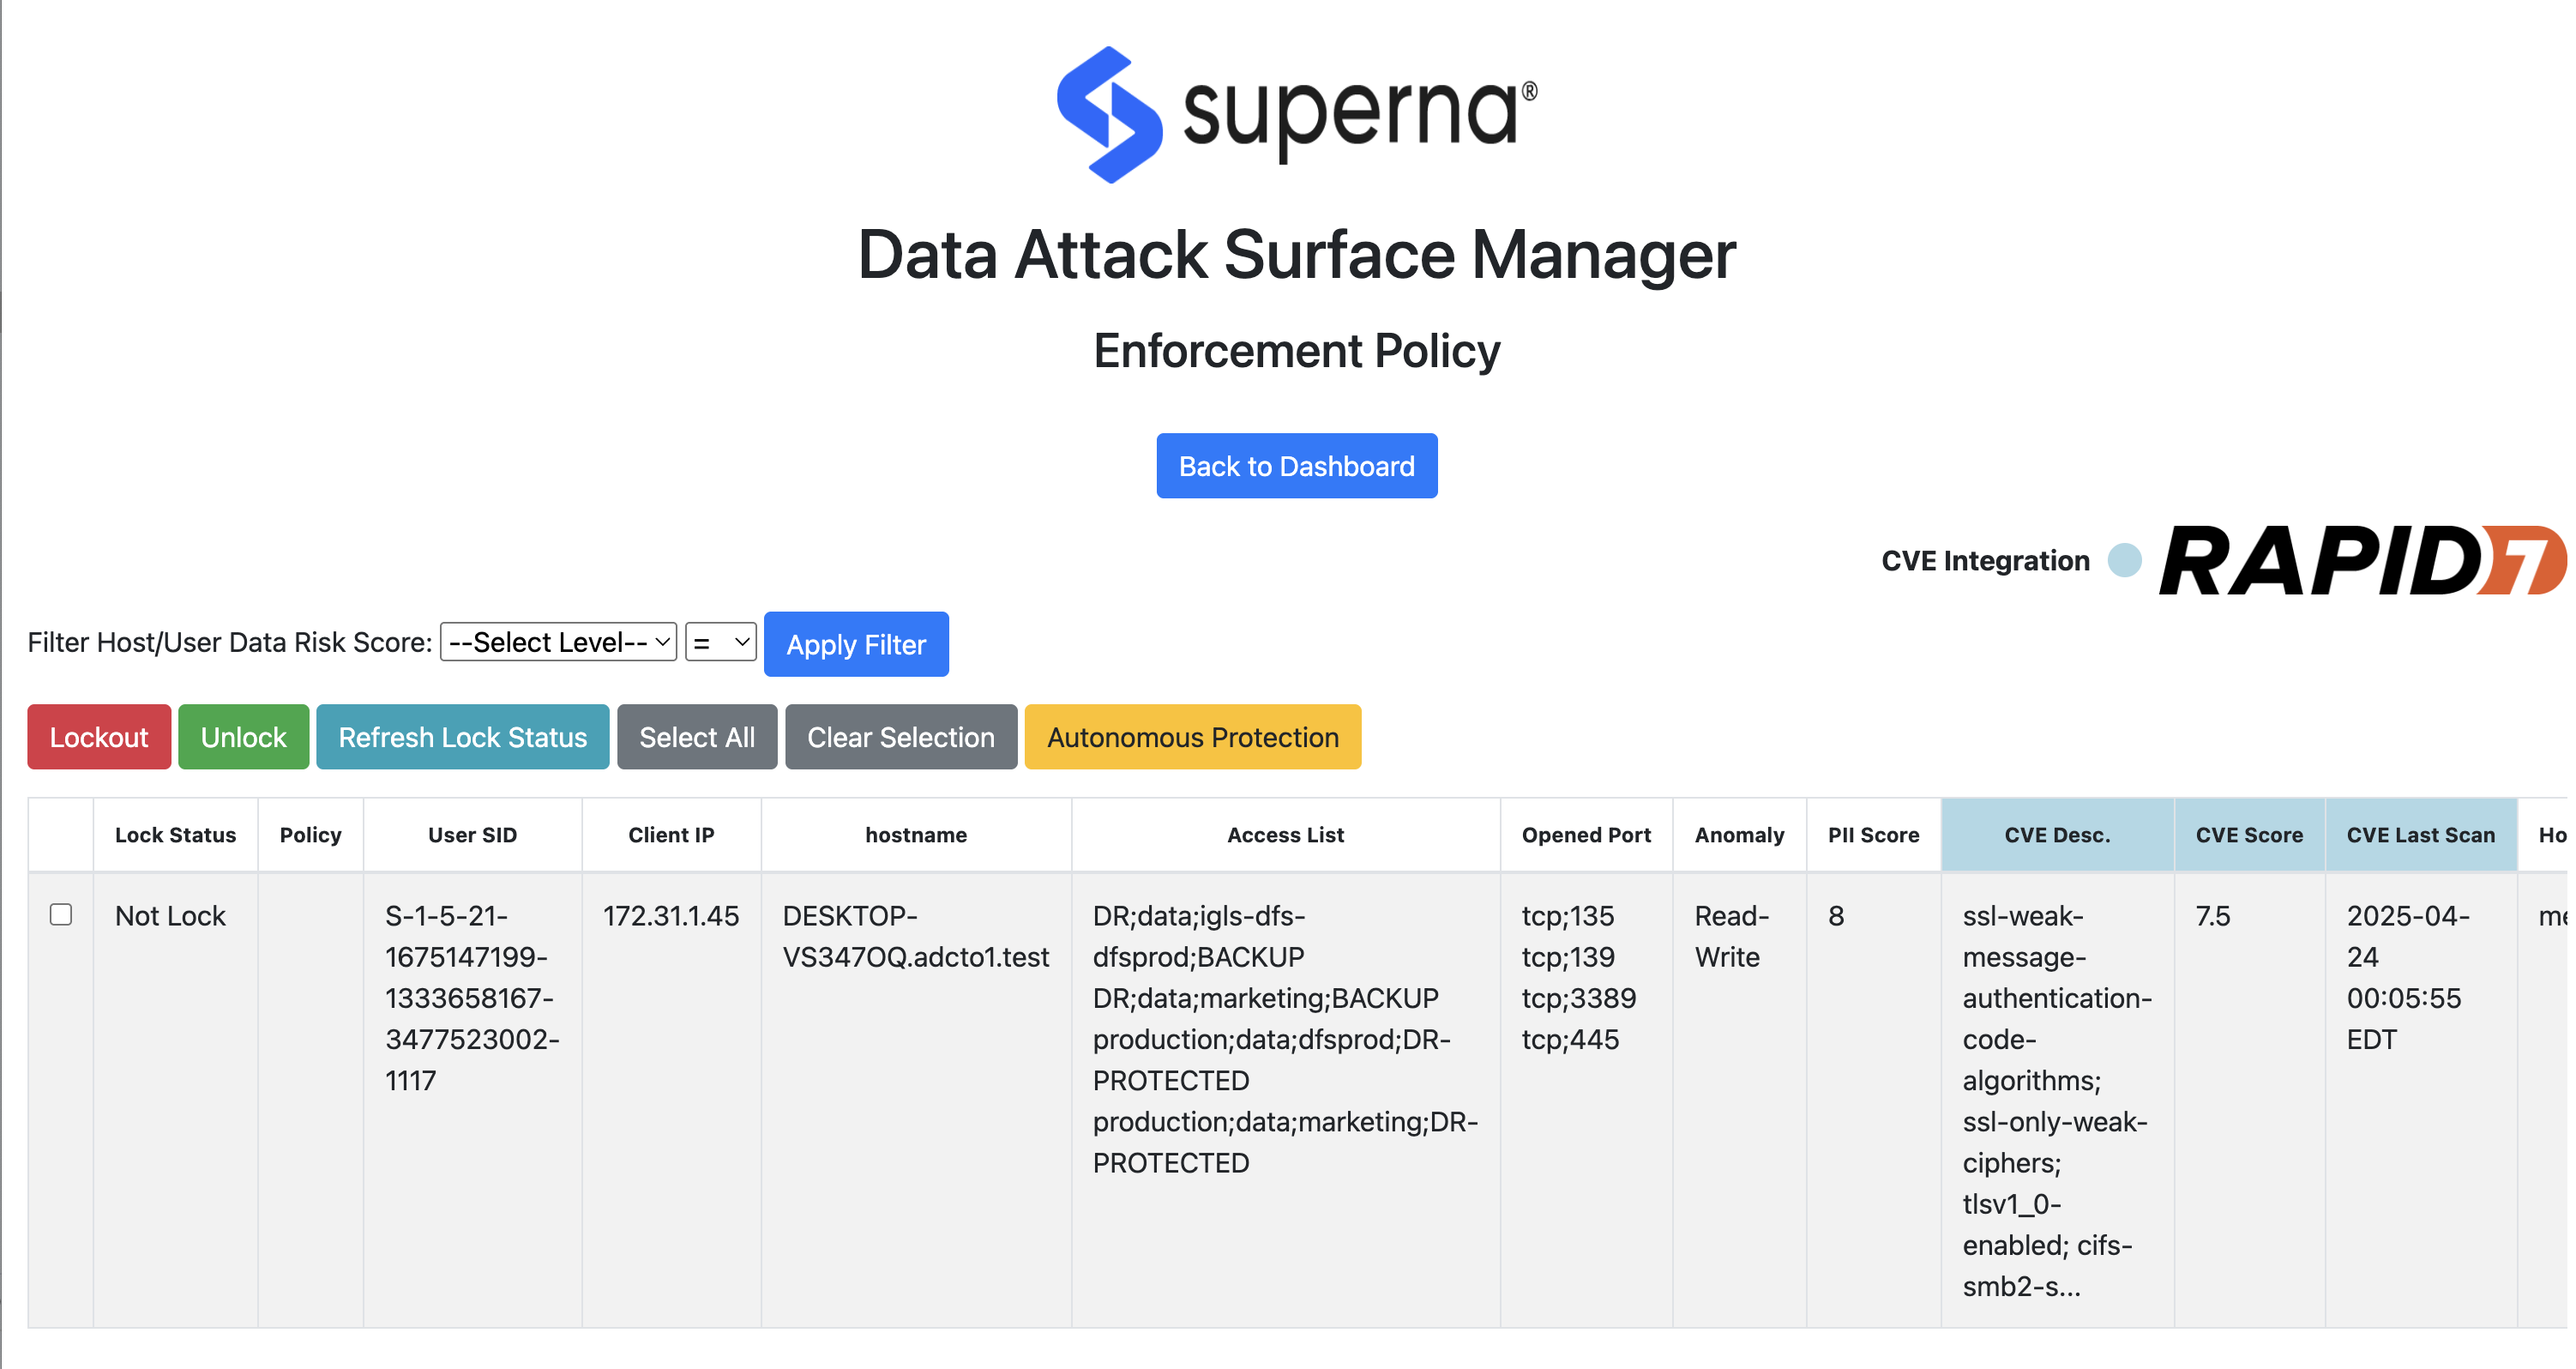
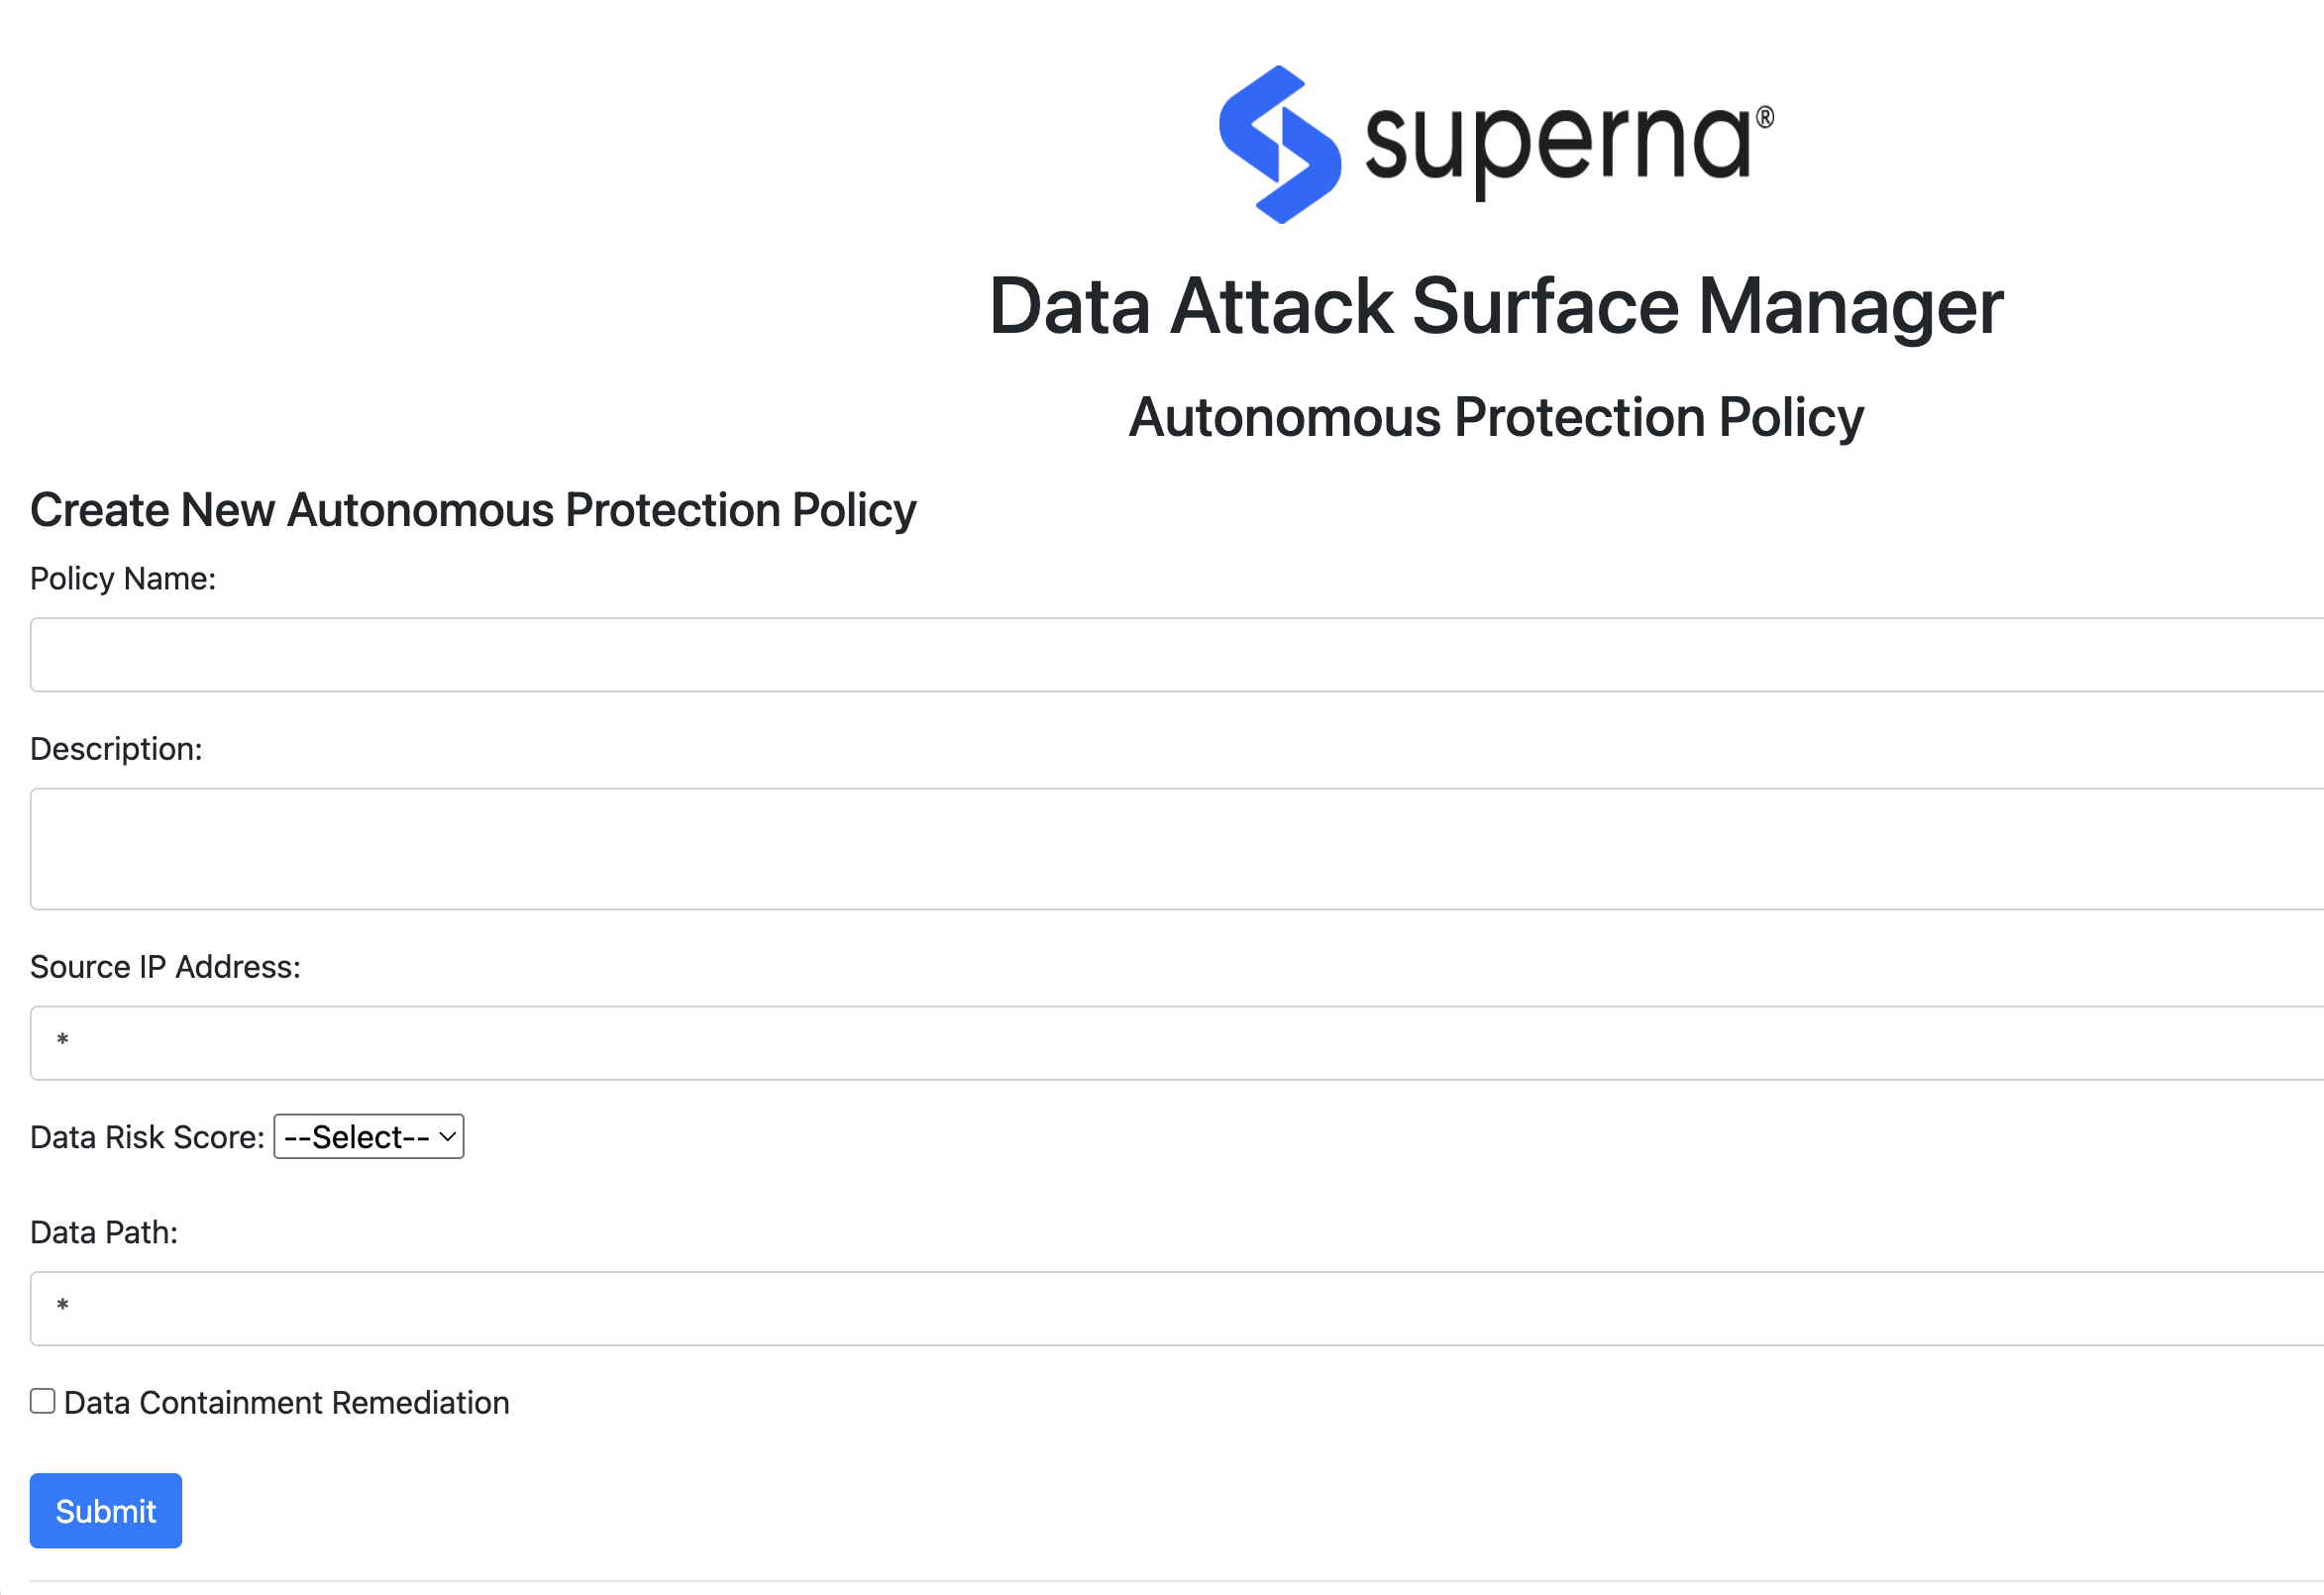
- Autonomous Data Shield (DDS) Policies
- The DDS policies allows creation of policies that automate the remediation of high risk data score hosts and users from accessing data until minimum security assessment is complete or the DRS (Data Risk Score) drops below a specific threshold.
- Create policy will require the following fields (Matching criteria will use AND logic for all 3 fields to match)
- name - text field - describes the policy purpose.
- source host IP - IP address range - x.x.x.x/yy syntax to identify source computers by network, default “*” which means any source ip
- Data Risk Score (mandatory field) - drop down of risk scores => greater and equal to. example medium means medium and above DRS (Data Risk Score)
- Path - absolute path , input will be absolute path example /ifs/marketing (which will be treated as /ifs/marketing/* all paths under the marketing folder. NOTE: we will ignore device name for now so this means a path can apply to any device under management, the risk of path overlap is low
- default will be any path
- Action
- Once a policy is created DDS monitors incoming audit data to match criteria and enforce host lockouts.
- Unblock logic - DDS will reassess on an hourly basis, if the AI model assessment of the DRS (Data Risk Score) indicates the the threat level has dropped equal to or Less than < DRS score, the host level unblock logic is executed and a webhook alert is sent.
- Host lockouts will update the policy dashboard to display status.
- The main dashboard in DVM will show column for policies in the dashboard under the “Autonomous data protection policy name”.
- Alerting
- Each time a policy acts with a lockout response. The following will occur happen:
- A webhook using the superna Zero Trust payload schema will be sent so that Incident Response teams will be informed that autonomous security policies have been activated or deactivated.
- Each time a policy acts with a lockout response. The following will occur happen:
- Create policy will require the following fields (Matching criteria will use AND logic for all 3 fields to match)

Dynamic DataShield Policy Operations
Overview Video
- When DDS policies activate the dashboard will show locked status and the policy name that triggered the lockout on the host
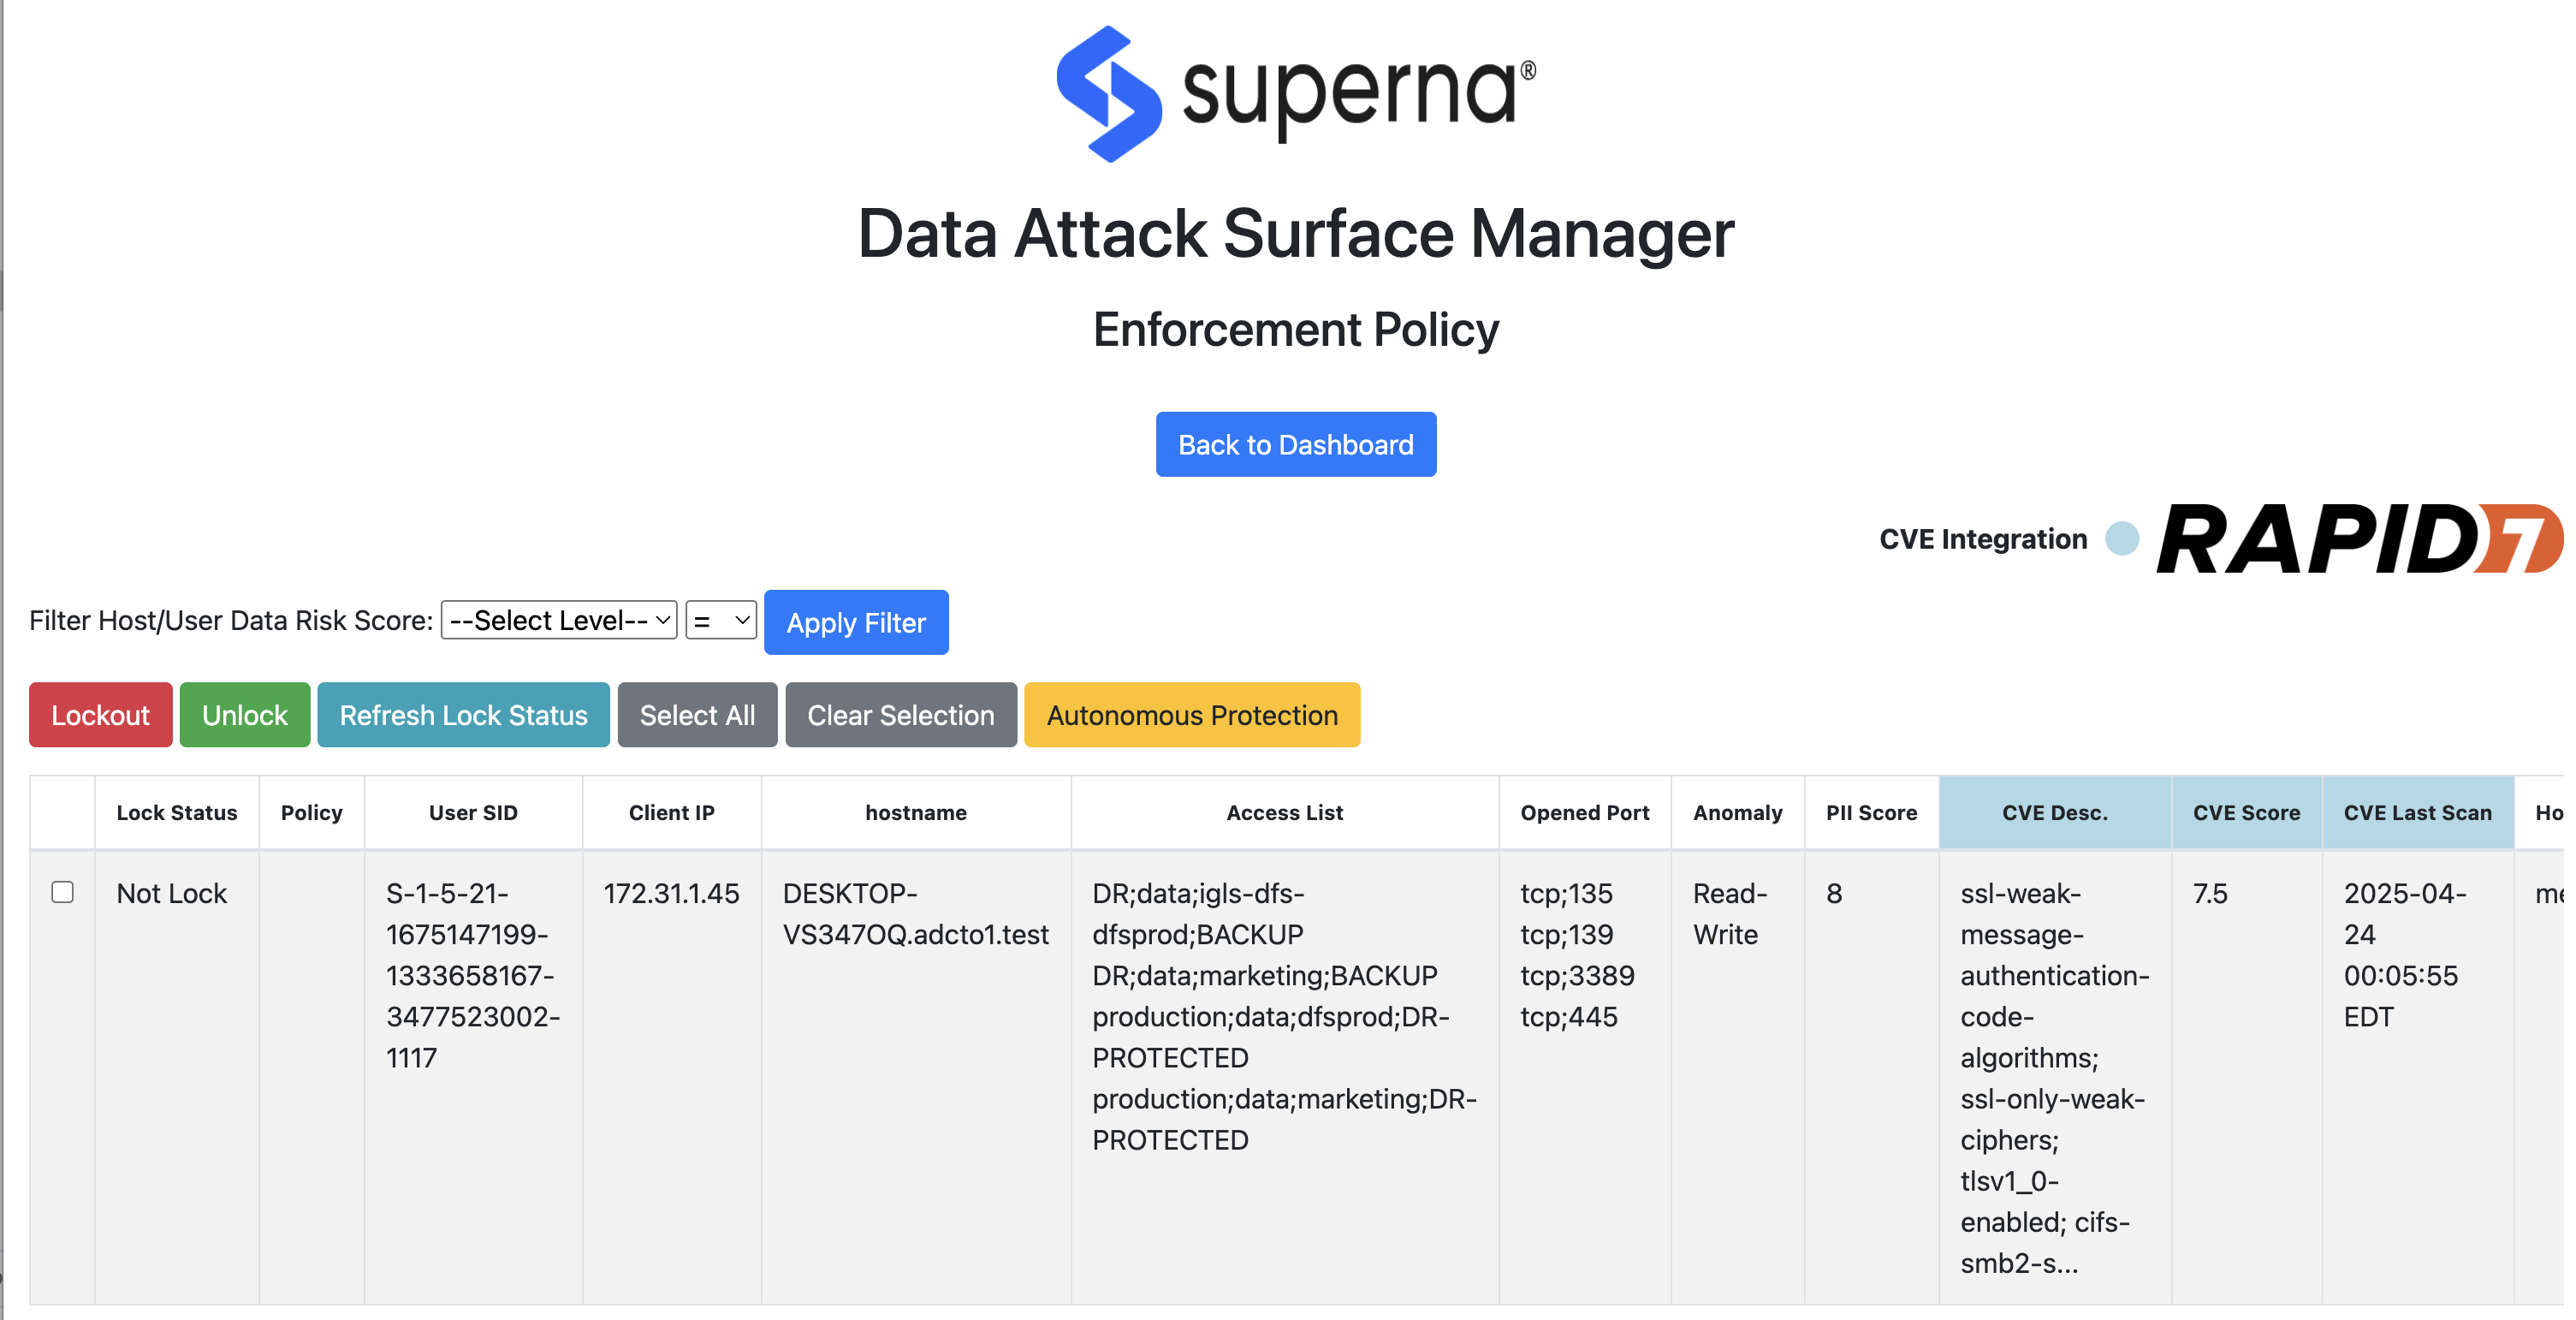
- Each hour the Superna Data AI inferencing runs to re-evaluate the Data Risk Score of the attack surface including any hosts that a lockout has been applied. If the DRS score falls below the policy definition the lockout is removed.
Data Classification - How it Works
- Overview: This feature adds valuable data to the Superna AI model to influence the Data Risk Score based on the type of data a user is accessing. The classification can can detect and classify using NLP (Natural Language Processing) and pattern-matching techniques. The methods of classification support the following methods.
- Pretrained spaCy models (for names, locations, etc.)
Regex patterns (e.g., SSNs, credit card numbers)
Checksum validation (for entities like credit cards and IBANs)
How it works
Users that are detected on high risk data attack surface hosts have their most recent activity sampled with a default of 10% of the files touched by a user. The results are leveraged to compute a PII score between 0 to 10 with 10 being the highest and this influences the AI model predictions.
The current solution uses snapshots on file systems that are NFS mounted to read any data over a read only NFS mount. The snapshot is deleted after the processing of user files is completed. This ensures the snapshot will not consume space when it is not required.
How To Configure Classification Modes
Edit the environment variable called CLASSIFICATION_MODE
set the variable on the host export CLASSIFICATION_MODE= x
Where is x is 1 or 2 or 3
1 = regex classifiers only
2 = Mode 2: spaCy with en-core-web-sm (spaCy small model)
person entity classifiers
3 = Mode 3: spaCy with en-core-web-lg (spaCy large model)
- person entity classifiers
- person entity classifiers
Data Classification Categories
Identity & Demographics (6)
| Entity Type | Description |
| PERSON | Full names or identifiable persons |
| AGE | Age mentions |
| GENDER | Gender expressions |
| DATE_TIME | Date and time values |
| US_PASSPORT | U.S. passport numbers |
| US_DRIVER_LICENSE | U.S. drivers license numbers |
Medical - Healthcare (3)
Custom Superna classifiers.
| Entity Type | Description |
| MRN - Medical Record Number | A Medical Record Number (MRN) is a unique identifier assigned to a patient's medical record within a specific healthcare organization. |
National Provider Identifier (NPI) | Detects National Provider Identifier (NPI) numbers, which are 10-digit numeric identifiers used in U.S. healthcare for uniquely identifying providers.
|
Detects Universally Unique Identifiers (UUID), | 128-bit identifiers used to uniquely tag objects. In your healthcare data, UUIDs represent PATIENT_ID values. |
Sensitive Numbers & Codes (7)
| Category | Count |
| Identity & Demographics | 6 |
| Sensitive Numbers & Codes | 7 |
| Digital Identifiers & Network | 6 |
| Location-Based Identifiers | 2 |
| Professional & Organizational | 2 |
| National IDs (Non-US) | 1 |
| Total | 24 |
Digital Identifiers & Network Data (6)
| Entity Type | Description |
| IP_ADDRESS | IPv4 or IPv6 addresses |
| EMAIL_ADDRESS | Email addresses |
| URL | Web URLs |
| DOMAIN_NAME | Domain names |
| AWS_ACCESS_KEY | Amazon Web Services access key |
| AZURE_STORAGE_KEY | Microsoft Azure storage keys |
Location-Based Identifiers (2)
| Entity Type | Description |
| LOCATION | Cities, countries, etc. |
| US_ZIP_CODE | U.S. postal codes |
Professional & Organizational (2)
| Entity Type | Description |
| ORGANIZATION | Company or org names |
| MEDICAL_LICENSE | Medical license identifiers |
National IDs (Non-US) (1)
| Entity Type | Description |
| NRP | Singapore National Registration ID |
Summary Table
| Category | Count |
| Identity & Demographics | 6 |
| Sensitive Numbers & Codes | 7 |
| Digital Identifiers & Network | 6 |
| Location-Based Identifiers | 2 |
| Professional & Organizational | 2 |
| National IDs (Non-US) | 1 |
| Total | 24 |
Data Classification Exposure Analytics
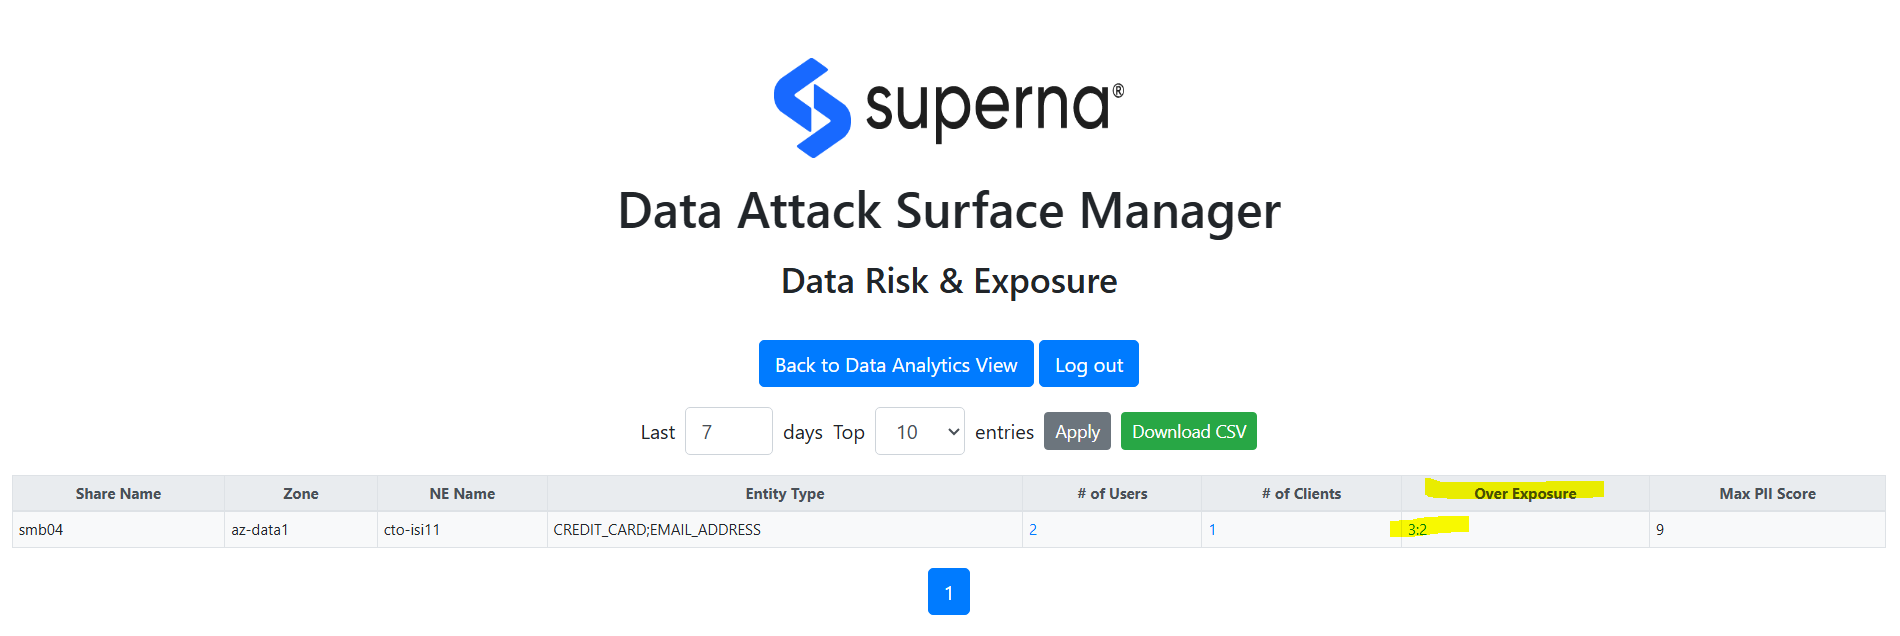
This reporting dashboard offers insight to your PII exposure with 2 different dashboards that summarize where your risks lie, which users and computers are connected to this risk.
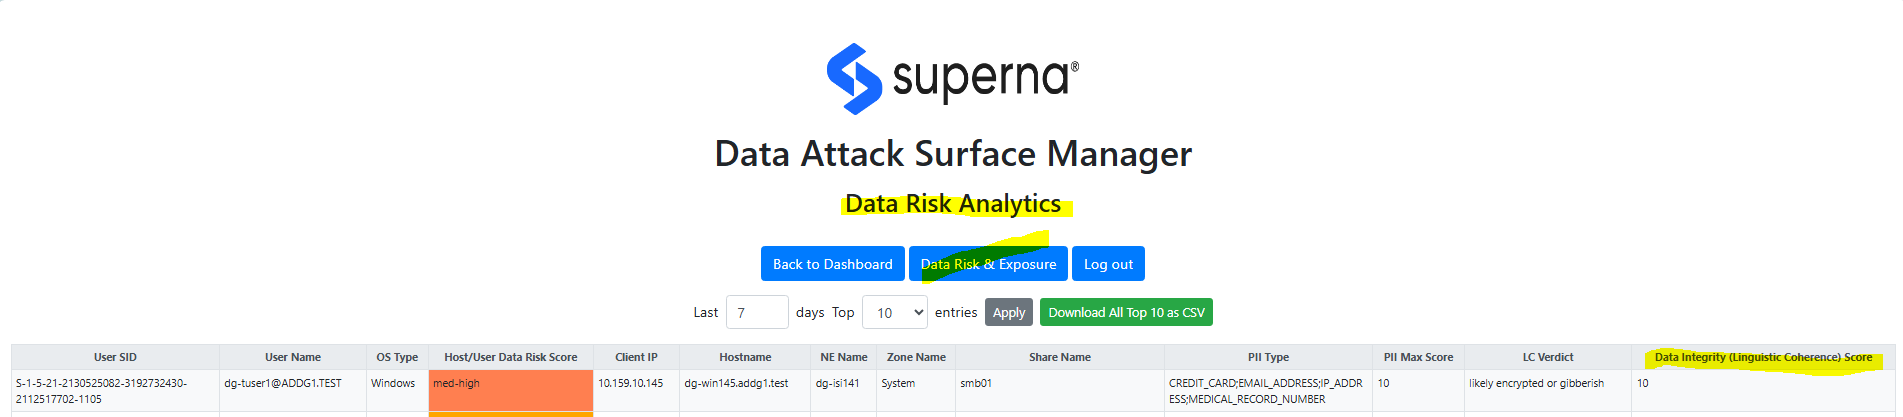
SMB/NFS PII Exposure Detection
This dashboard shows users that create PII content and which host they use , along with a summary of the types of PII found for this users activity, along with a score between 1 - 10 , where 10 represents the a high level of PII exposure. The Data Risk Score for the host/user is also shown to help prioritize remediation on the hosts and users found on this dashboard.
How this capability helps reduce risk
- Pinpoint Risk Hotspots
- Discover where sensitive data is most vulnerable by mapping actual user interactions with PII across SMB shares and NFS exports. Prioritize protection efforts based on real usage, not assumptions.
- Quantify Exfiltration Risk in Real Terms
- Move beyond generic risk scoring by measuring the true threat: who accessed what, when, and how much sensitive data was involved. Turn unstructured data sprawl into a targeted risk profile.
- Enable Targeted Remediation
- Focus remediation efforts on shares or exports with high PII concentration and high user interaction, reducing false positives and maximizing the impact of security operations.
- Bridge Data Security with Compliance Monitoring
- Deliver auditable insights into how and where sensitive data is exposed—empowering compliance teams with contextual, actionable evidence tied to user behavior.
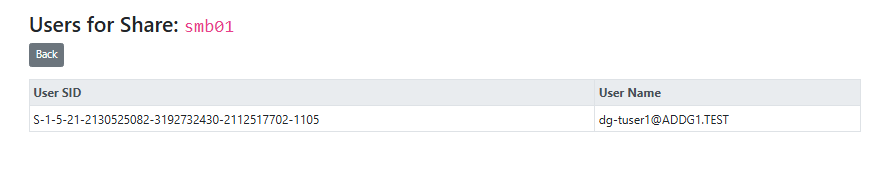
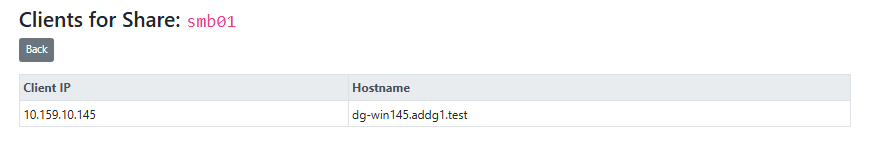
This dashboard provides an SMB/NFS view of where PII data is concentrated and shows the number of users and hosts involved with PII data.
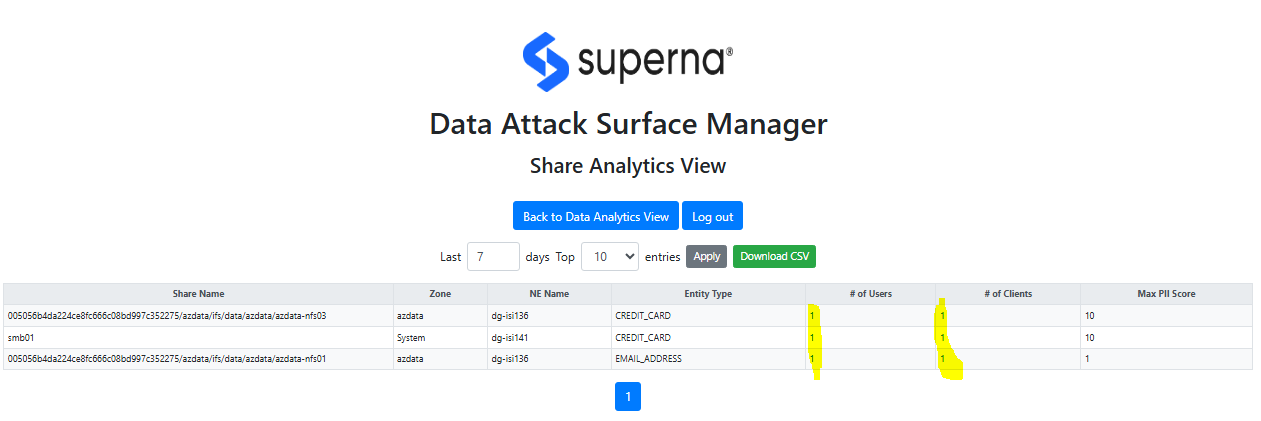
Clicking the user or client number will drill in to show the users or clients that touched PII data on this SMB share in the last 7 days.
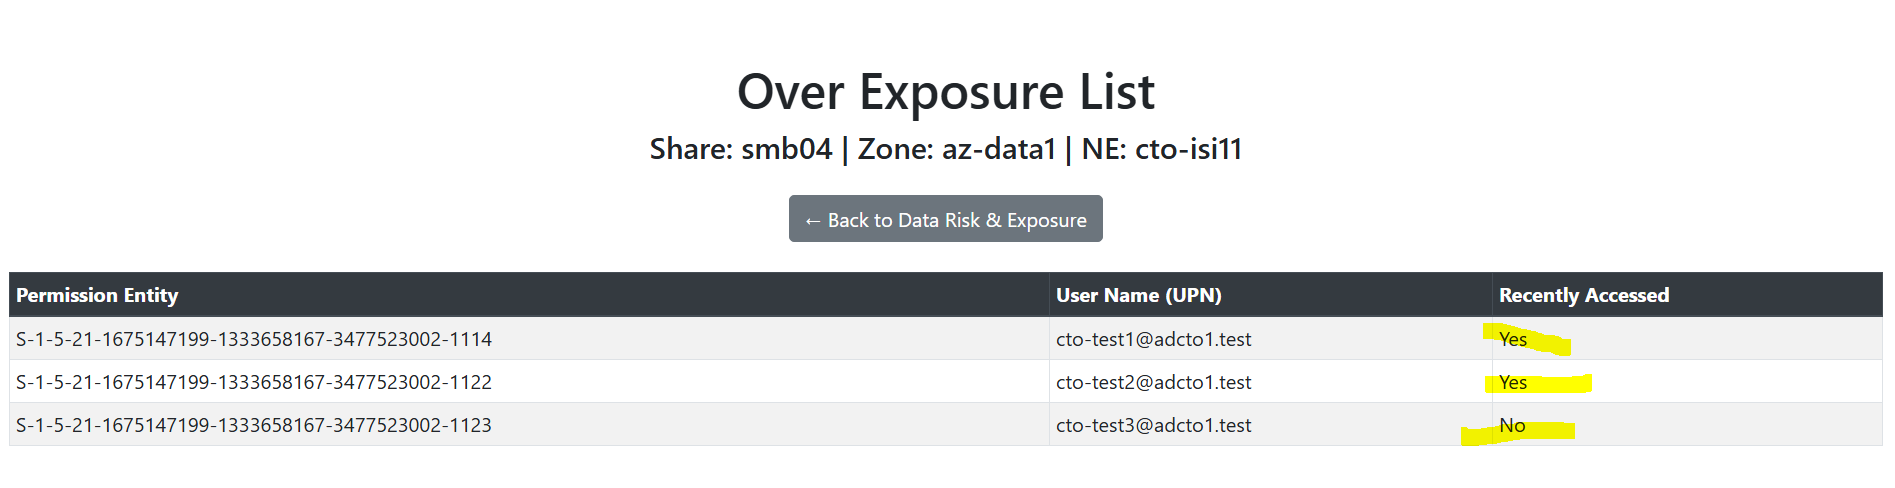
Permission vs. Usage Over-Exposure Analysis
This dashboard monitors user activity and expands share level permissions to build a ratio of access vs permissions. In order to reduce risk and data exposure, the least privilege model requires users that do not access data to have it removed from the ACL or share level permissions to shrink the Data Attack Surface.
How This Capability Helps Reduce Risk
Shrink the Data Attack Surface with Precision
Identify users who have access to data they don’t use. Reduce risk exposure from dormant or excessive permissions and enforce least-privilege access policies intelligently.
Operationalize Zero Trust at the File System Layer
Go beyond static access control lists—use real-world activity to justify or revoke access. DASM aligns with Zero Trust principles by validating actual need-to-know.
Turn Audit Logs into Proactive Access Governance
Convert audit trails into actionable access intelligence. Automate the detection of access drift and help teams surgically close privilege gaps before they’re exploited.
Drive Access Reviews with Usage Context
Equip IT and security teams with usage-based insights that make access reviews faster, smarter, and more defensible—especially in regulated environments.
Data Risk & Exposure Dashboard
Data Integrity Dashboard
Overview
This guide provides administrators with the information needed to configure, operate, and maintain Superna’s linguistic coherence technology for real-time content security. Unlike traditional classification tools, which identify and label sensitive data, this solution extends protection by validating the integrity and authenticity of content.
The system uses advanced linguistic analysis and entropy-based detection to identify subtle changes that may indicate:
- Unauthorized content modification
- Hidden or encrypted data insertion
- Semantic shifts introduced by attackers or AI-driven tools
By continuously monitoring files, audit logs, and structured content, the platform delivers early warning of potential tampering and provides actionable signals for Content Threat Exposure Management (CTEM).
How it Works
The technology samples created or modified data throughout the day and checks the data integrity with a multi layer assessment of the files contents. This includes a basic entropy test which checks the randomness of the data which is a weak indicator of encryption but when combined with Superna ground breaking linguistic coherence test that scores the meaning the data as being high quality ,low quality or Indicator of tampering. This technology is multilingual and can detect sparse encryption of data.
The assessment is computed into score between 1 to 10 with 10 indicating a high confidence of data tampering has been detected. This is mapped to users and computers that were used to originate the attack. The Dashboard allows reporting on the rollup of all data modifications under SMB shares and drill down to user or computers responsible for the data modifications.
Why Traditional Defenses Fall Short
Detecting modern content attacks is increasingly difficult because traditional security tools were not designed for the age of GenAI.
Entropy-based detection, for example, measures randomness and is effective at spotting obvious obfuscation like encryption, compression, or malware hidden in binary form. But GenAI-driven attacks don’t need to raise entropy. They can generate fluent, natural-looking text that blends seamlessly into business documents, logs, or emails. Entropy scores remain normal—even though the meaning has been manipulated to mislead, hide fraud, or insert malicious instructions.
At the same time, backup-oriented defenses assume that restoring data from a “known good” copy will resolve an incident. This model fails against semantic attacks, where the attacker hasn’t destroyed or encrypted data but has instead altered its meaning. In these cases:
• The document looks normal.
• The file opens without errors.
• Backups faithfully preserve the corrupted content—because the “change” isn’t corruption in the technical sense, but a subtle shift in semantics.
The result: restoration simply re-introduces the compromised version, leaving the organization blind to the integrity breach.
The Implication
GenAI and semantic manipulation bypass both entropy-based detection and backup-centric recovery. To counter these threats, organizations need content-aware security that can evaluate not just the structure of data, but also its coherence and integrity of meaning. Without this layer of defense, attackers can operate undetected—quietly changing the story your data tells.
Dashboard with Data Integrity Scores
Operations
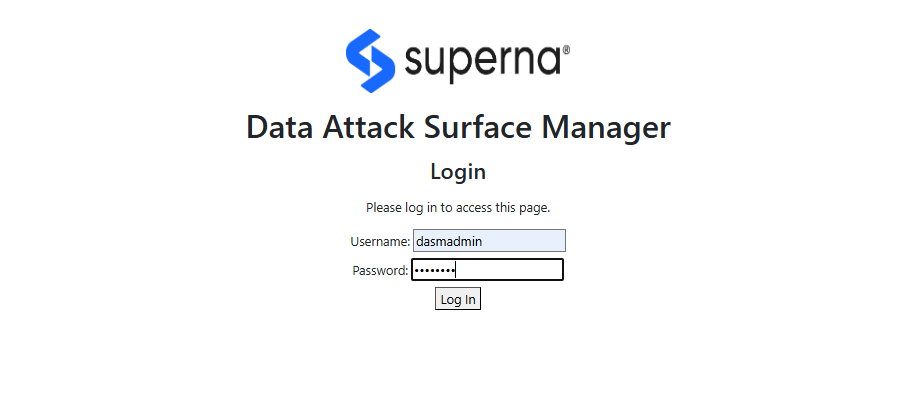
Local Login
- Open a new Browser tab and point to this URL https://<ip-address-of-dvm-vm>:5001/. It will open the initial login page
- The default user login is dasmadmin default password Vuln3r@b1l1ty!
Active Directory Login
- The steps below configure AD authentication with Role based group support. This allows an AD group to control which users can login to the Data Attack Surface Manager console.
- Edit the file below and enter the AD service account, key for session cookie , AD domain and remaining fields.
AD Authentication Configuration
We need to update this config file cvm_config.py with the variables based on our environment
# cvm_config.py
# Configuration for DASM WebUI Login Authentication application
# ---------------------------
# Flask Application Settings
# ---------------------------
# A long, random secret key used by Flask to sign session cookies,
# CSRF tokens, and any other data stored client-side.
# Generate once (e.g. using Python's secrets.token_urlsafe) and keep it secret.
SECRET_KEY = "YOUR_FLASK_SECRET_KEY_HERE"
# -----------------------
# Local Admin Credentials
# -----------------------
# A simple in-memory store of local usernames and passwords for quick admin access.
# Format: 'username': {'password': 'plain_text_password'}
# Replace with secure values The default is given here.
LOCAL_USERS = {
'dasmadmin': {'password': 'Vuln3r$b1l1ty!'}
}
# ---------------------------
# Active Directory (AD/LDAP)
# ---------------------------
# The hostname or IP of your AD server.
AD_HOST = "ad.example.com"
# Whether to use LDAPS (True for port 636 implicit SSL) or StartTLS on port 389.
AD_USE_SSL = True
# Port for the LDAP connection (636 for LDAPS, 389 for StartTLS).
AD_PORT = 636
# The NetBIOS domain name (used for NTLM binds as DOMAIN\\user).
AD_DOMAIN = "EXAMPLE"
# Whether to require certificate validation when using LDAPS/StartTLS.
# Set False for dev (self-signed certs), True in production.
AD_VALIDATE_CERT = True
# Path to your CA bundle (PEM file) to verify AD server certificate.
AD_CA_BUNDLE = "/path/to/ca_chain.pem"
# ---------------------------
# Service Account for AD Lookup
# ---------------------------
# A dedicated AD account allowed to search users and groups.
# Format: r"DOMAIN\username"
AD_SERVICE_ACCOUNT = r"EXAMPLE\ldap-reader"
# Password for the service account. Keep secret!
AD_SERVICE_PASSWORD = "service_account_password"
# ---------------------------
# LDAP Search Bases
# ---------------------------
# Base DN for user searches (e.g. the root of your domain).
AD_BASE_DN = "DC=example,DC=com"
# Distinguished Name of the AD group whose members are allowed
# to log in to the WebUI. Only users in this group will be granted access.
AD_ALLOWED_GROUP_DN = "CN=WebUI Users,OU=Security Groups,DC=example,DC=com"
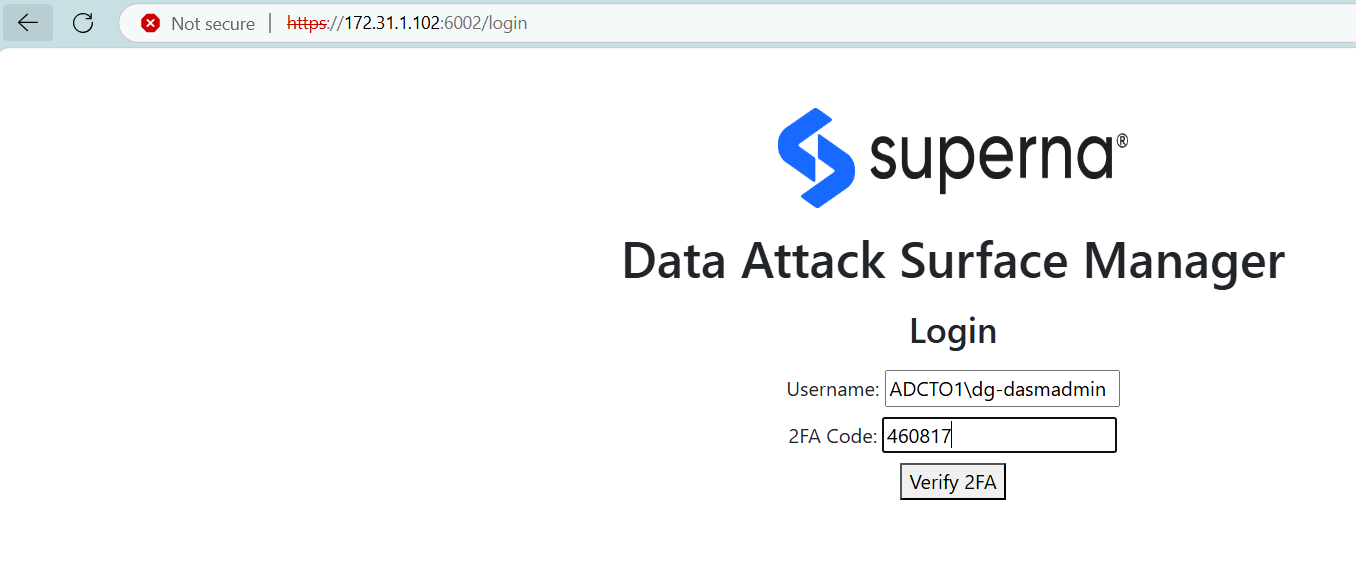
- Login with domain\user or user@domain syntax

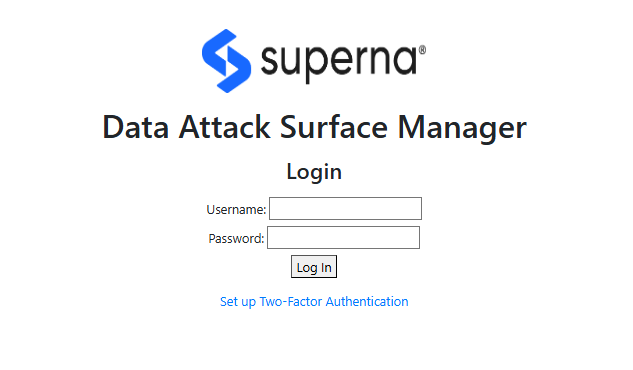
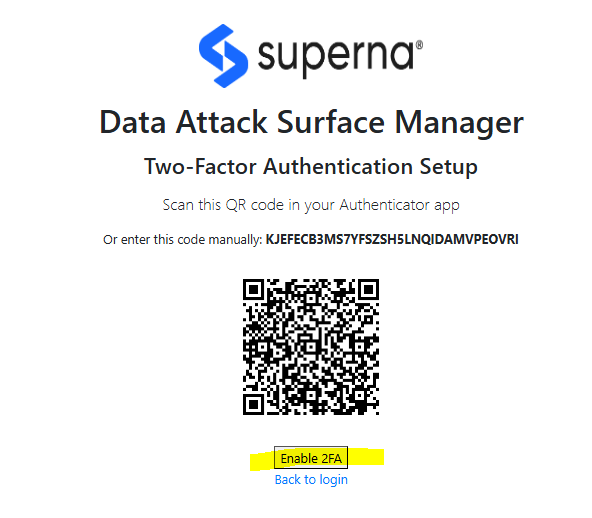
2FA with Google Authenticator
- This solution will support login to a local user account or AD account + the addition of the One time Password provided by the Google authenticator application. The login requires setup of the key pair for the user account with Google Authenticator
Alert and Webhook Configuration with Data Security Edition
- To configure DVM to send webhooks to Eyeglass to leverage the integrations listed here. The configuration steps below can be followed. It is also possible to send webhooks directly to another endpoint assuming the endpoint can parse the payload.
Login to the DVM vm over ssh
- nano /mnt/ml_data/ml-cvm/cvm_webui_rapid7.py
- Locate the section below and set the ip address to the Eyeglass VM ip address, if different than the DVM VM IP address.
- DVM_WEBHOOK_IP = "x.x.x.x" # Specify DVM Webhook Endpoint IP AddressDVM_WEBHOOK_PORT = "5000" # Specify DVM Webhook Endpoint Port NumberDVM_WEBHOOK_ENDPOINT = "/webhook" # Specify DVM Webhook Endpoint route (e.g., "/webhook")
- Create an Eyeglass VM webhook integration to receive the DVM webhook alerts on port 5000 (of the value used if changed), leave the endpoint route /webhook unless directed to change by support.
- Configure the integrations from the link above to configure which integration is used to send DVM alerts.
- NOTE: If Eyeglass integrations already exist you will need to change the port that DVM uses to send webhooks.
- control + x to save and exit.
- Done.
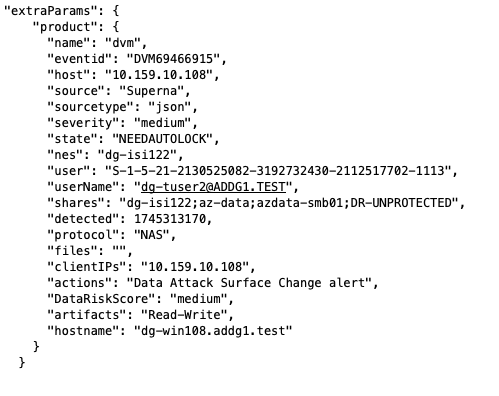
Sample DVM webhook Json payload for Data Containment policy Enforcement
These payloads are sent when a data containment policy blocks or unblocks access to data based on matching criteria to the real time policies.
- The example payloads below
The payload that is application specific is embedded in the extraparams section the zero trust payload
Sample Json payload for missing or stale Vulnerability Scans
This feature monitors the attack surface vulnerability scans to ensure that a current scan exists within the last 7 days to ensure the Data Attack Surface hosts are being scanned at least once per week. This preemptive approach reduces risks that a vulnerability could put critical data at risk and flags this missing scan to the SOC.
The Json payload below are examples of missing scan reports that indicates all the attack surface client ip addresses that are missing. So a single alert provides the details on all hoss that are missing a vulnerability scan.
- Attack surface json payload for missing scan reports on hosts.
- Attack surface has no missing scan reports sample payload.
Software Start/Stop
- To start / restart DVM processes, we can use the following:
- cd /mnt/ml_data/ml-cvm
- ./cvm_check_restart.sh
- To stop DVM processes, we can use the following:
- cd /mnt/ml_data/ml-cvm
- ./cvm_stop_processes.sh
Log Gather For Support
- cd /mnt/ml_data/ml-cvm
- python3 cvm_loggather.py
- This command will generate a zip file that can be uploaded to support cases
Data Classification Configuration
Data Processing
- Files are processed for each user on an hourly basis and the training model is built with this new classification risk data included in the data set.
- Only files < 500 MB will be processed and files on the exclusion list will be skipped.
Sensitive Tuning & file type filtering
- The data classification function will only register a file with a confidence level of greater than 70%. This can be tuned higher to reduce false postivie on low grade classification detections within files.
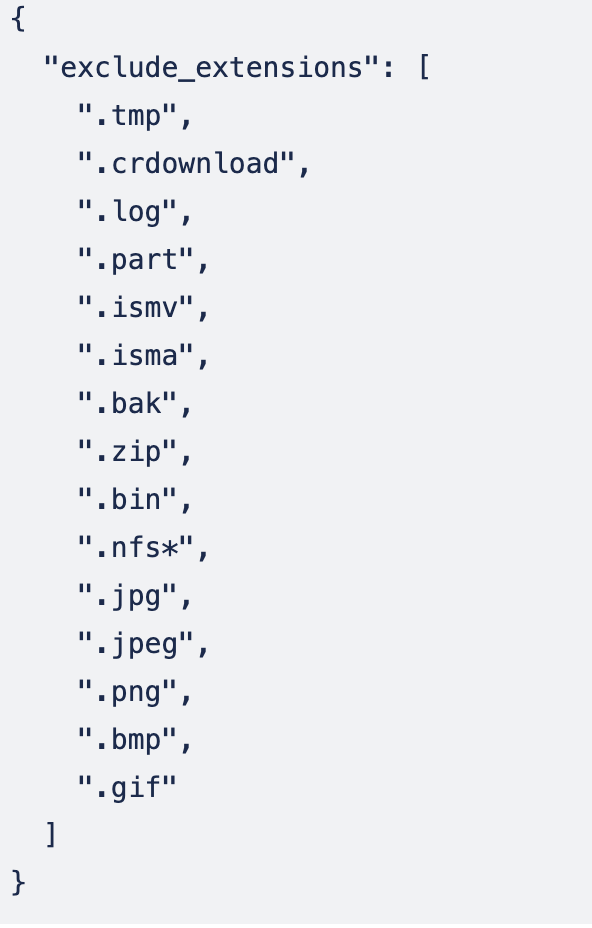
- The data classification feature supports over 1500 file types. No image file types are supported and are filtered out by default. The list of file types that will be ignored can be customized.
- This file can be edited to add additional file extensions the be ignored /mnt/ml_data/ml-cvm/cvm_ext_config.json . You can add * to wild card part of the extension types. The default exclusions are listed below.