Dark Sites - How to Health check Eyeglass and ECA clusters when opening a support case
- Overview
- How to run the the Log Parser Report
- Steps for more detailed Health Check of components (optional)
- ECA Specific Support data in the Support Report
- ECA Health check for Dark-Sites
- Hbase-master Database Health Check
- Kafka-manager Health Check
- Spark-master Health Check
Overview
NEW in 2.5.8.1 or later.
See the Guide here. Older releases see below steps.
This process is for dark sites to generate the log parsing output that provides a summary of information to support. The parsing report can be reviewed for information be for sending to support.
- Step 1 - run the eyeglass log parsing report, review and send as attachment to support case
- Step 2 - if requested more detailed steps to verify component health.
How to run the the Log Parser Report
To determine ECA health from log parser output, first run Eyeglass log parser report.
Login to Eyeglass CLI as admin
See the Guide here.
Steps for more detailed Health Check of components (optional)
Use these steps if support requests additional details after sending the parsing report to support.
Use the Log Parser table of content to browse to sections
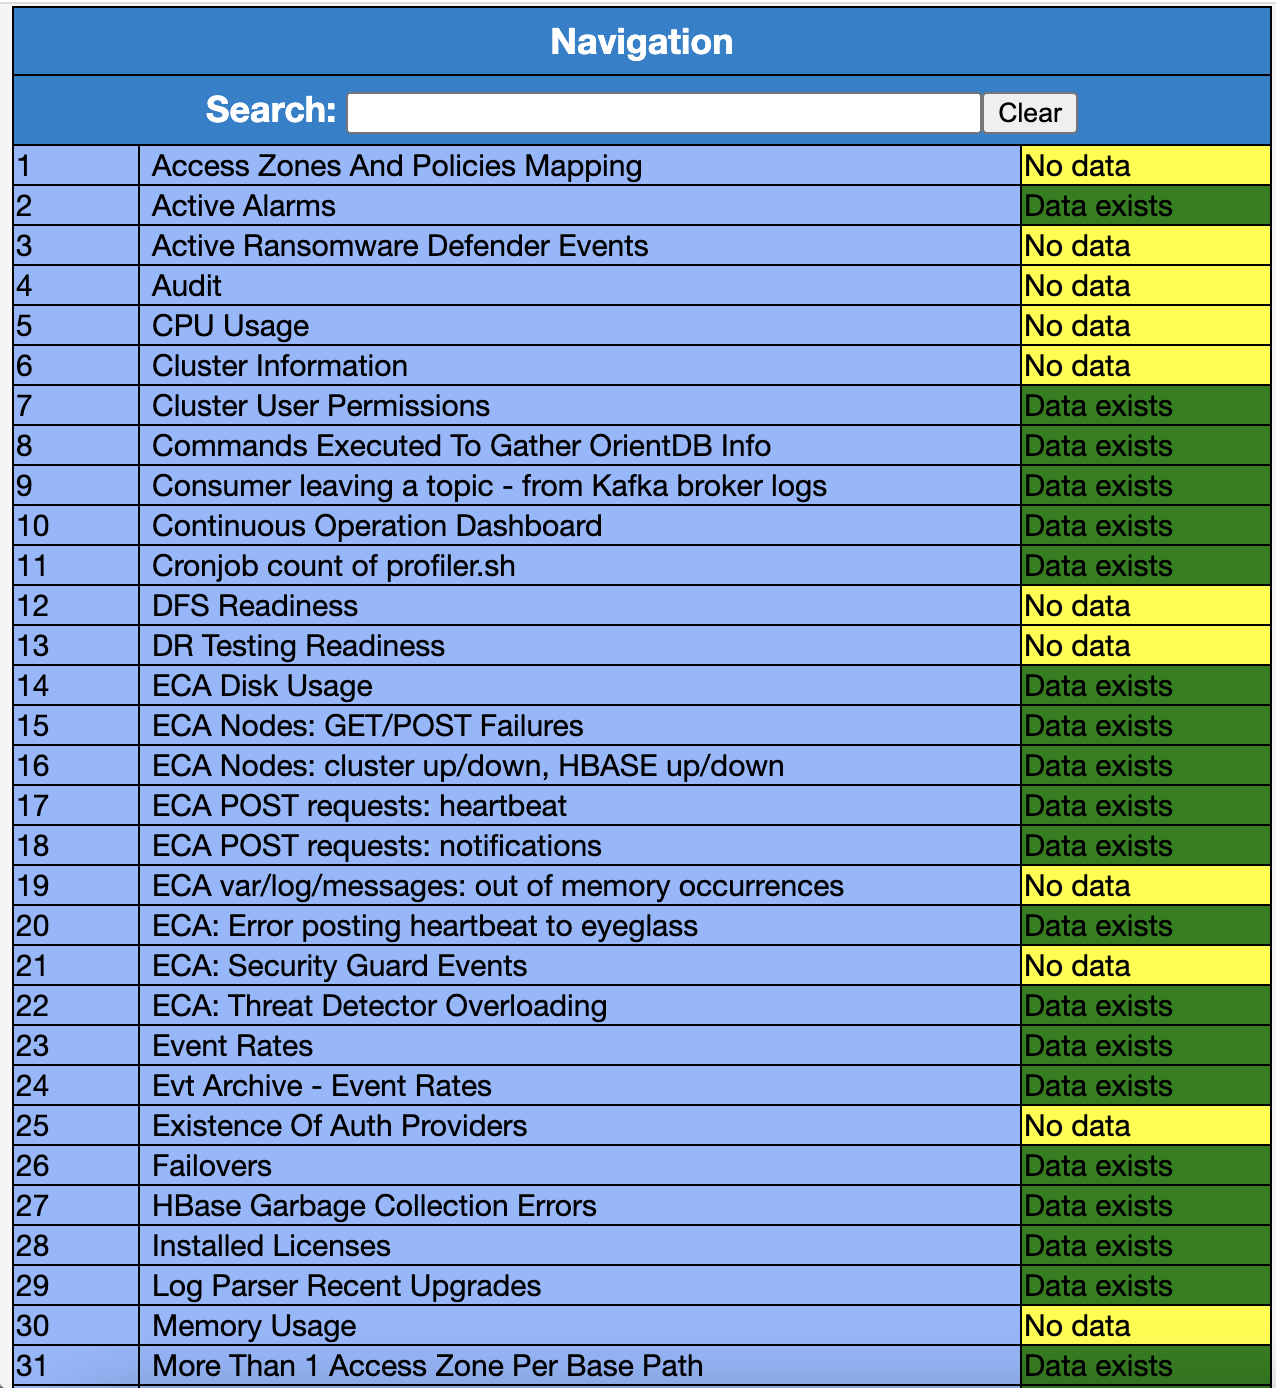
Check Active Alarm for any ECA related issue
Check Remote Services and ensure the Active section states true
Everything under Health section in RemoteServices - Running Containers should be GREEN and OK. When you open support ticket related to ECA containers in Error state, agents will ask for current container state. Most common ones are turboaudit, fastanalysis, evtarchive, spark-worker etc
Support team may ask you to check Remote Services - Running Containers, remote Services - Validation section for ECA troubleshooting
If any ECA node is not in true state, that node is NOT in healthy state.
Check Remote Services - Validation to determine any time skew and/or issue with HBase-scanning
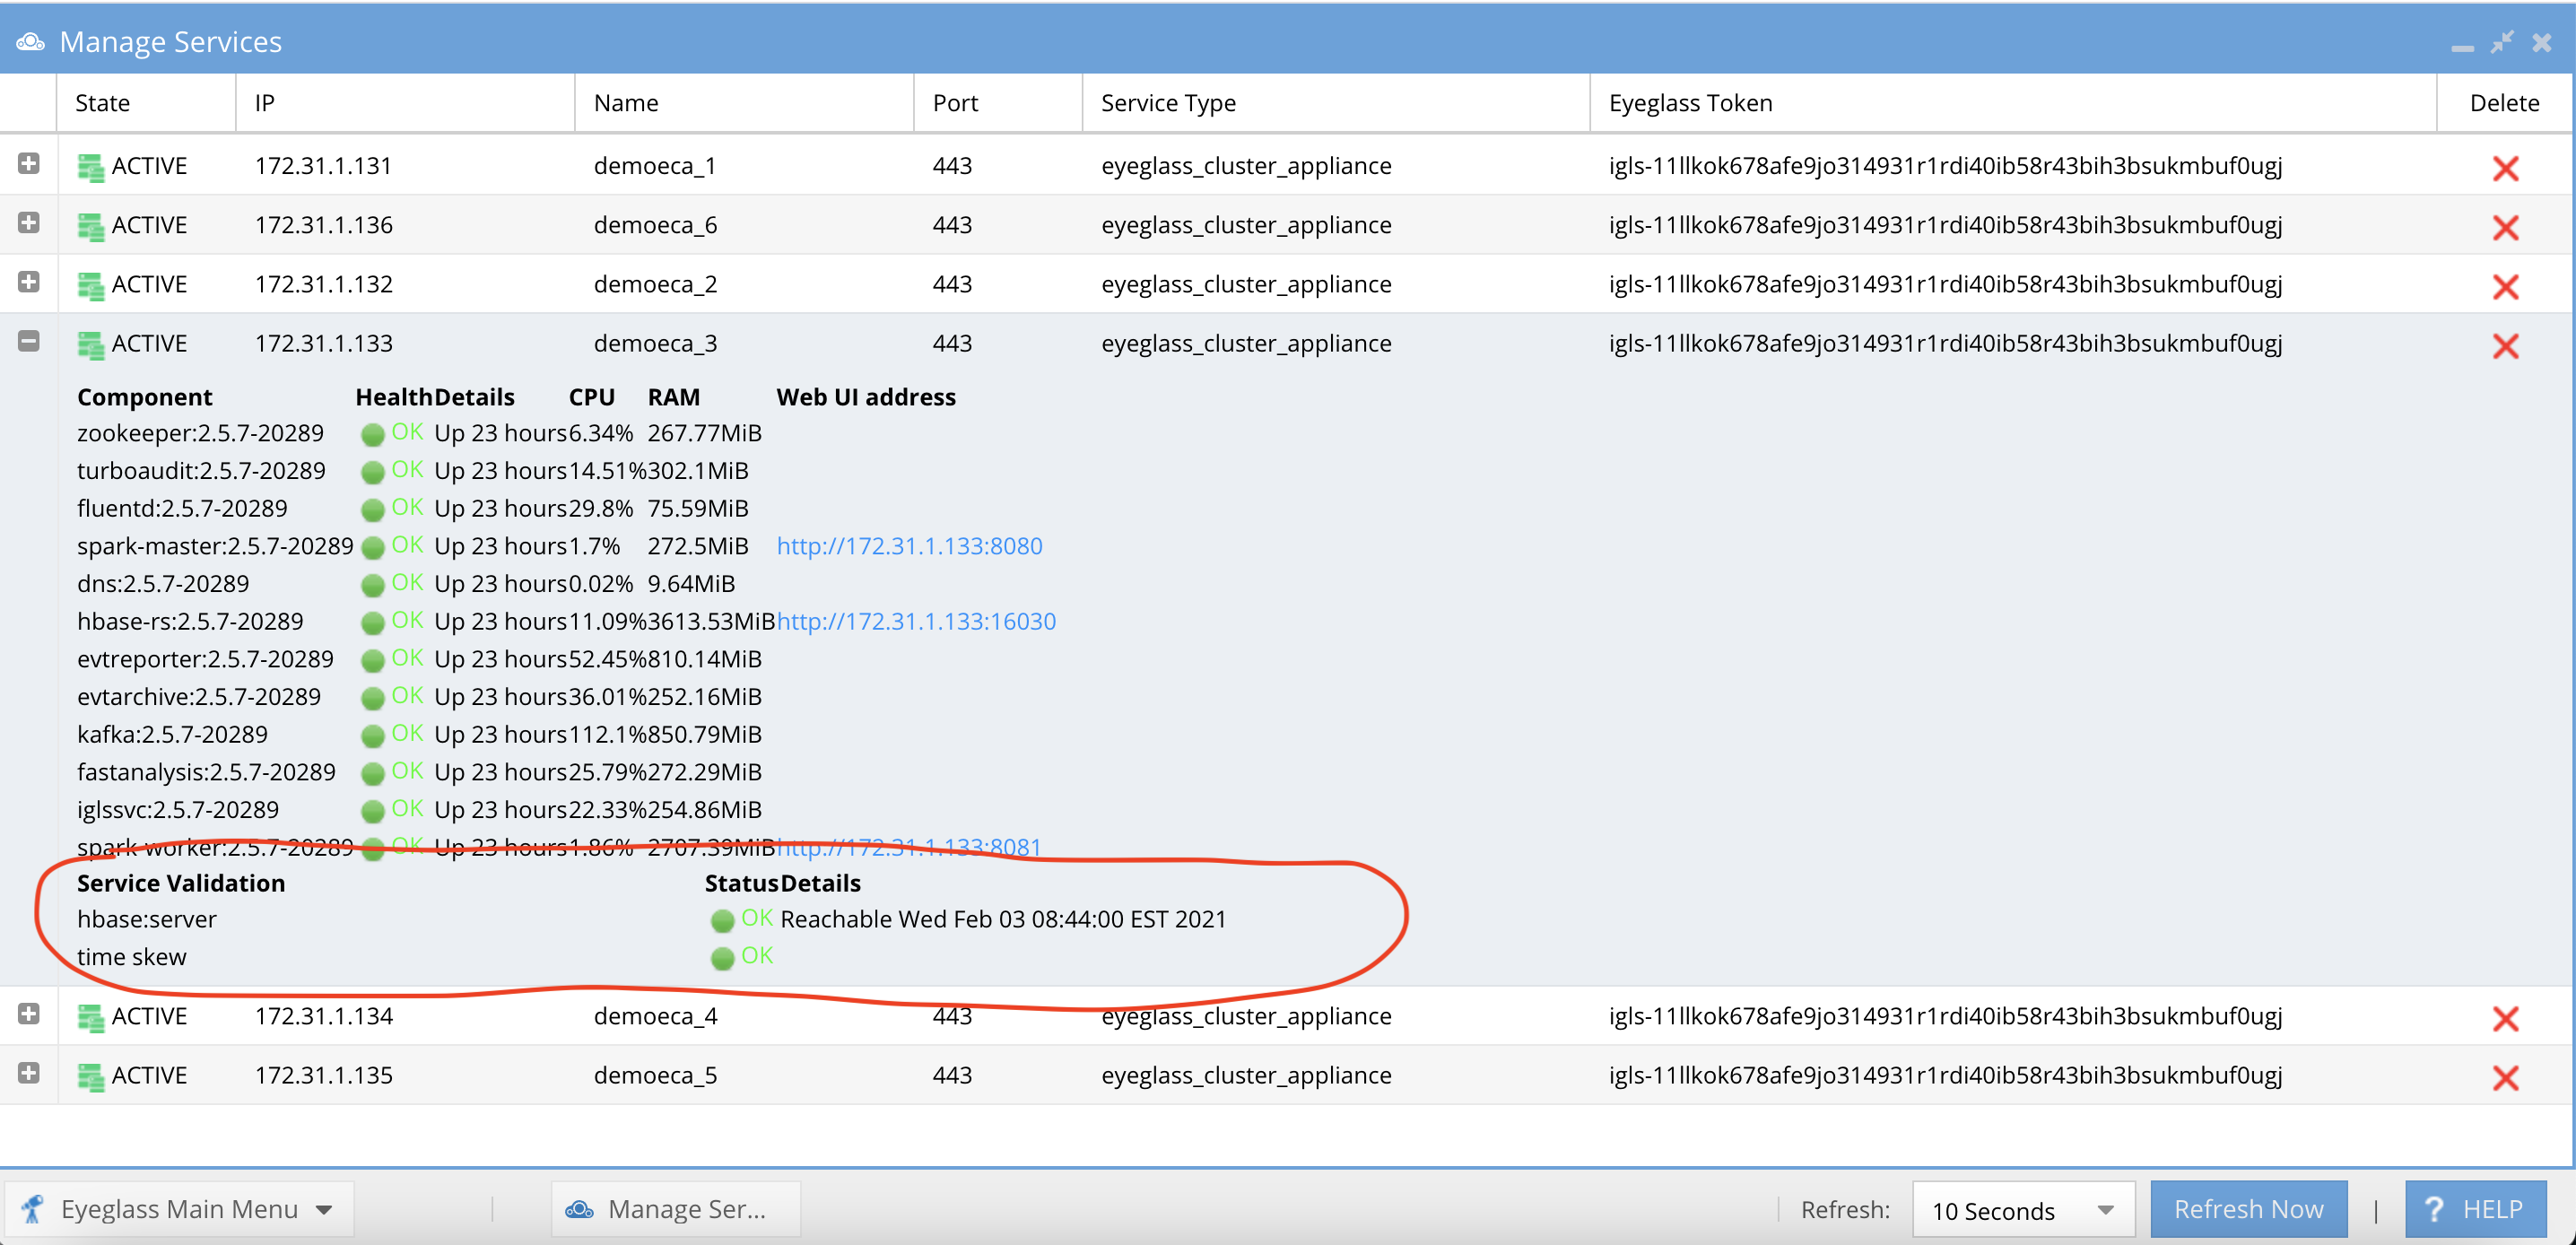
In the picture above, hbase:server Validation is in OK state. Time skew is OK.Check Security Guard for most recent events and provide details. ERROR state indicates an unhealthy ECA environment.
a. From Table of content click on Security Guard Events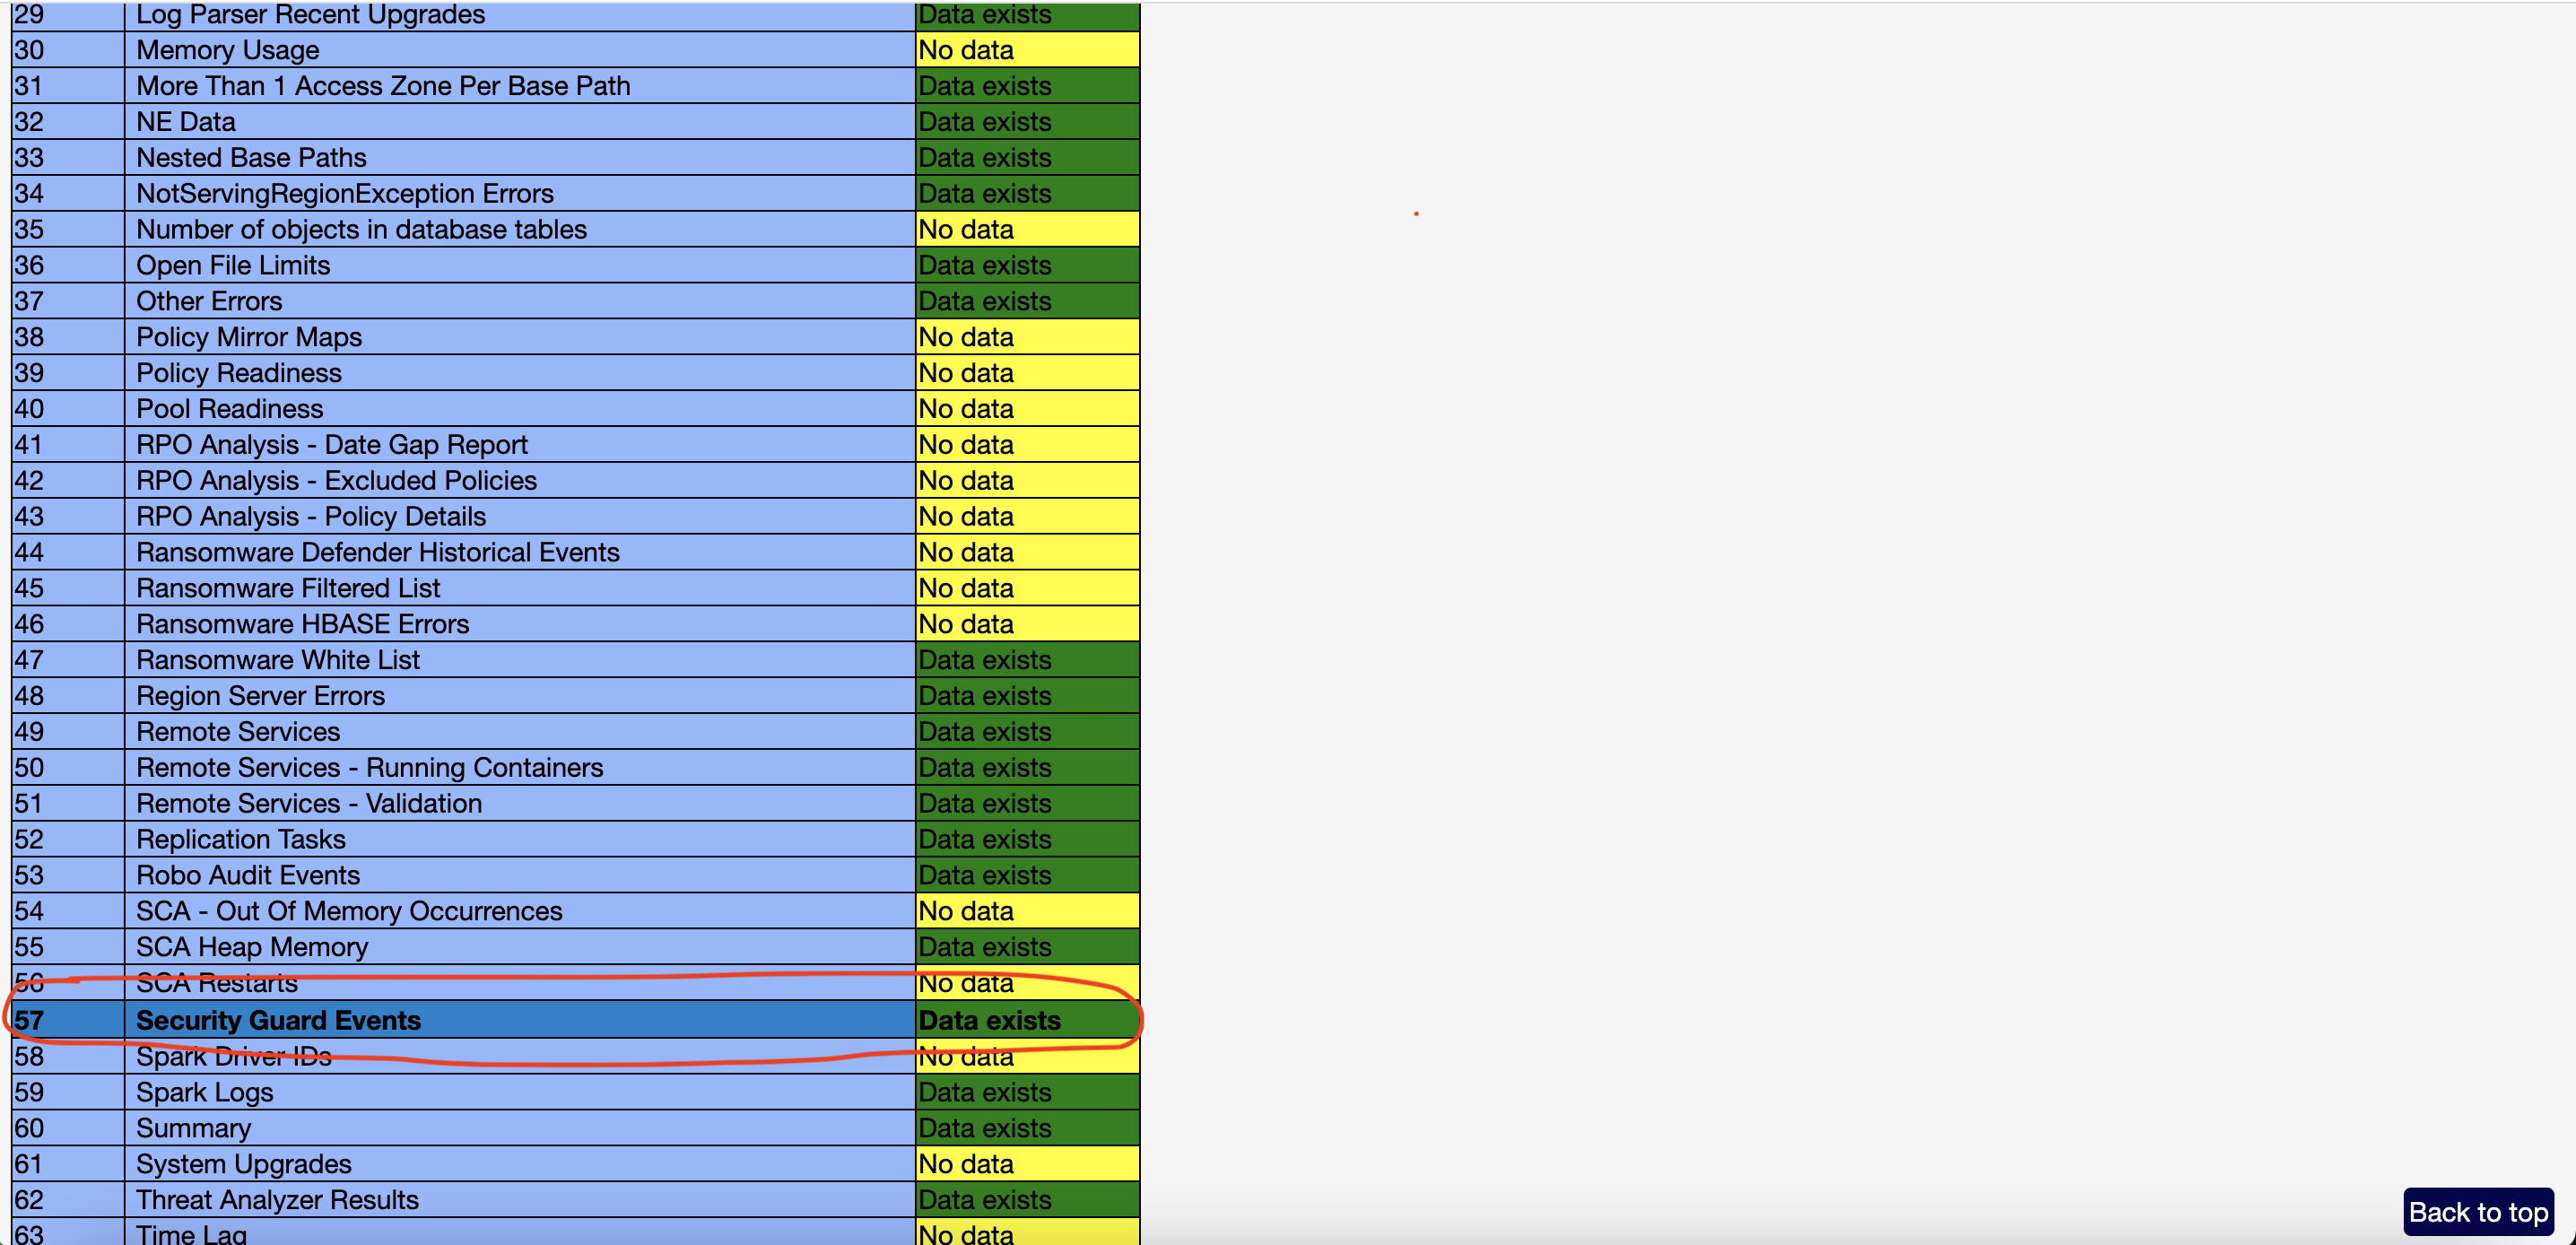
b. Check for most recent events and provide details
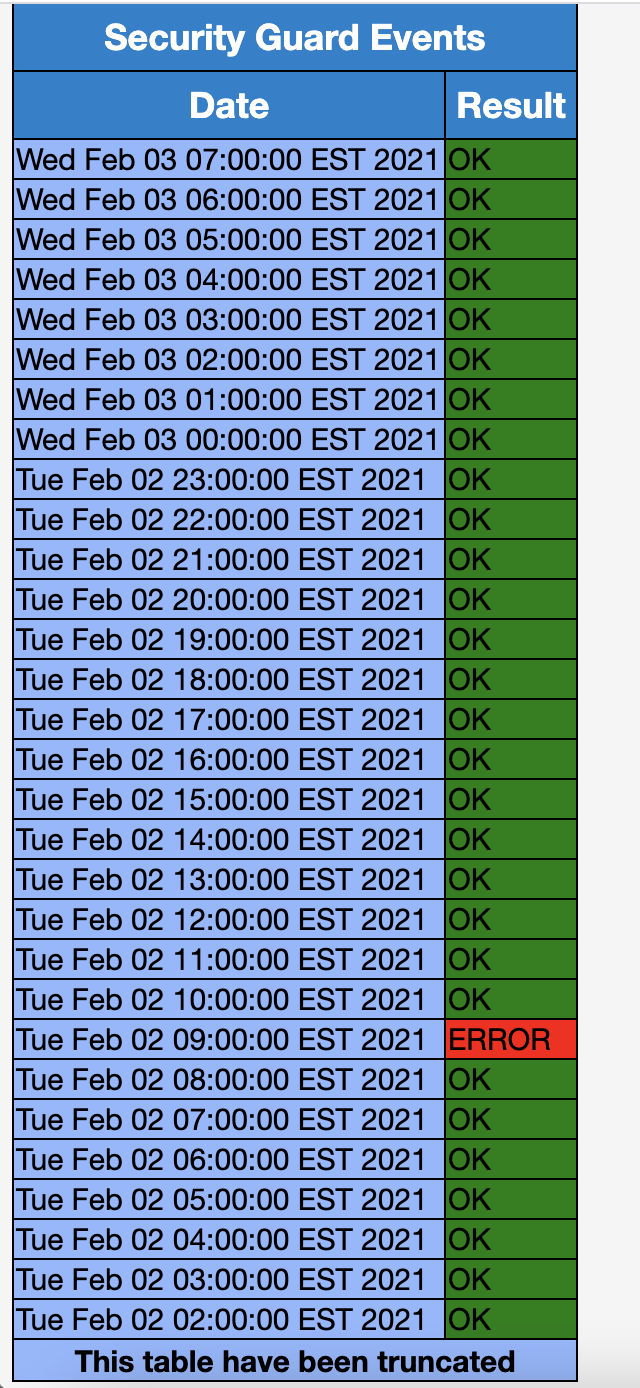
c. If they are in ERROR state, support team will ask you to open Eyeglass Web UI and provide log details to support team.
- Eyeglass Web UI → Ransomware Defender widget → Security Guard → Open failed log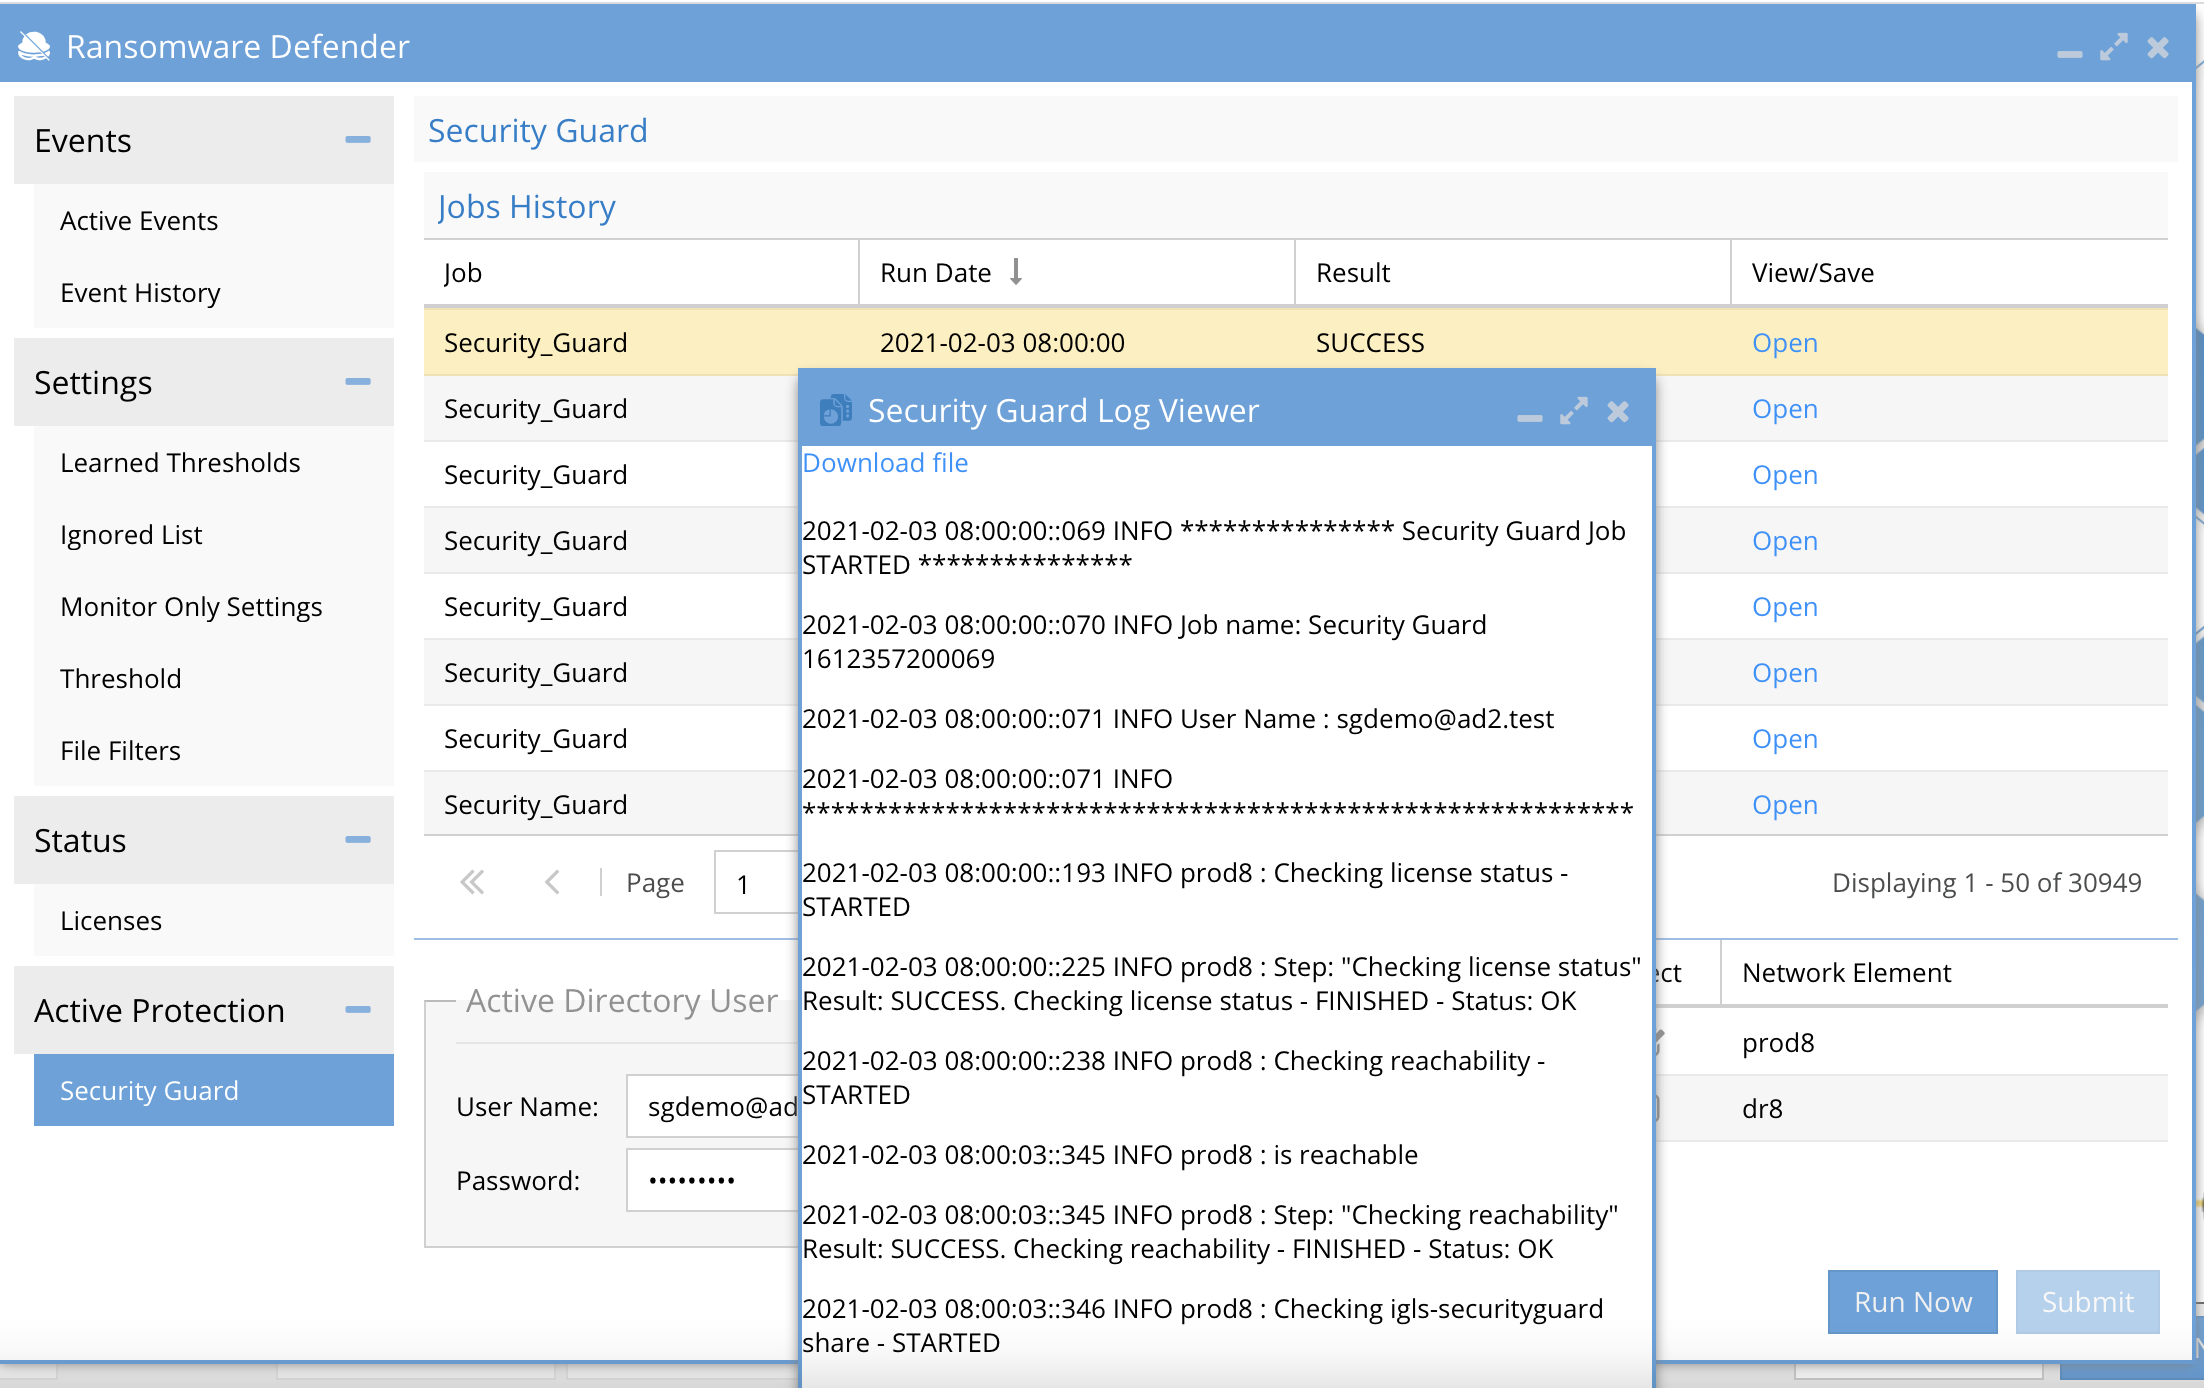
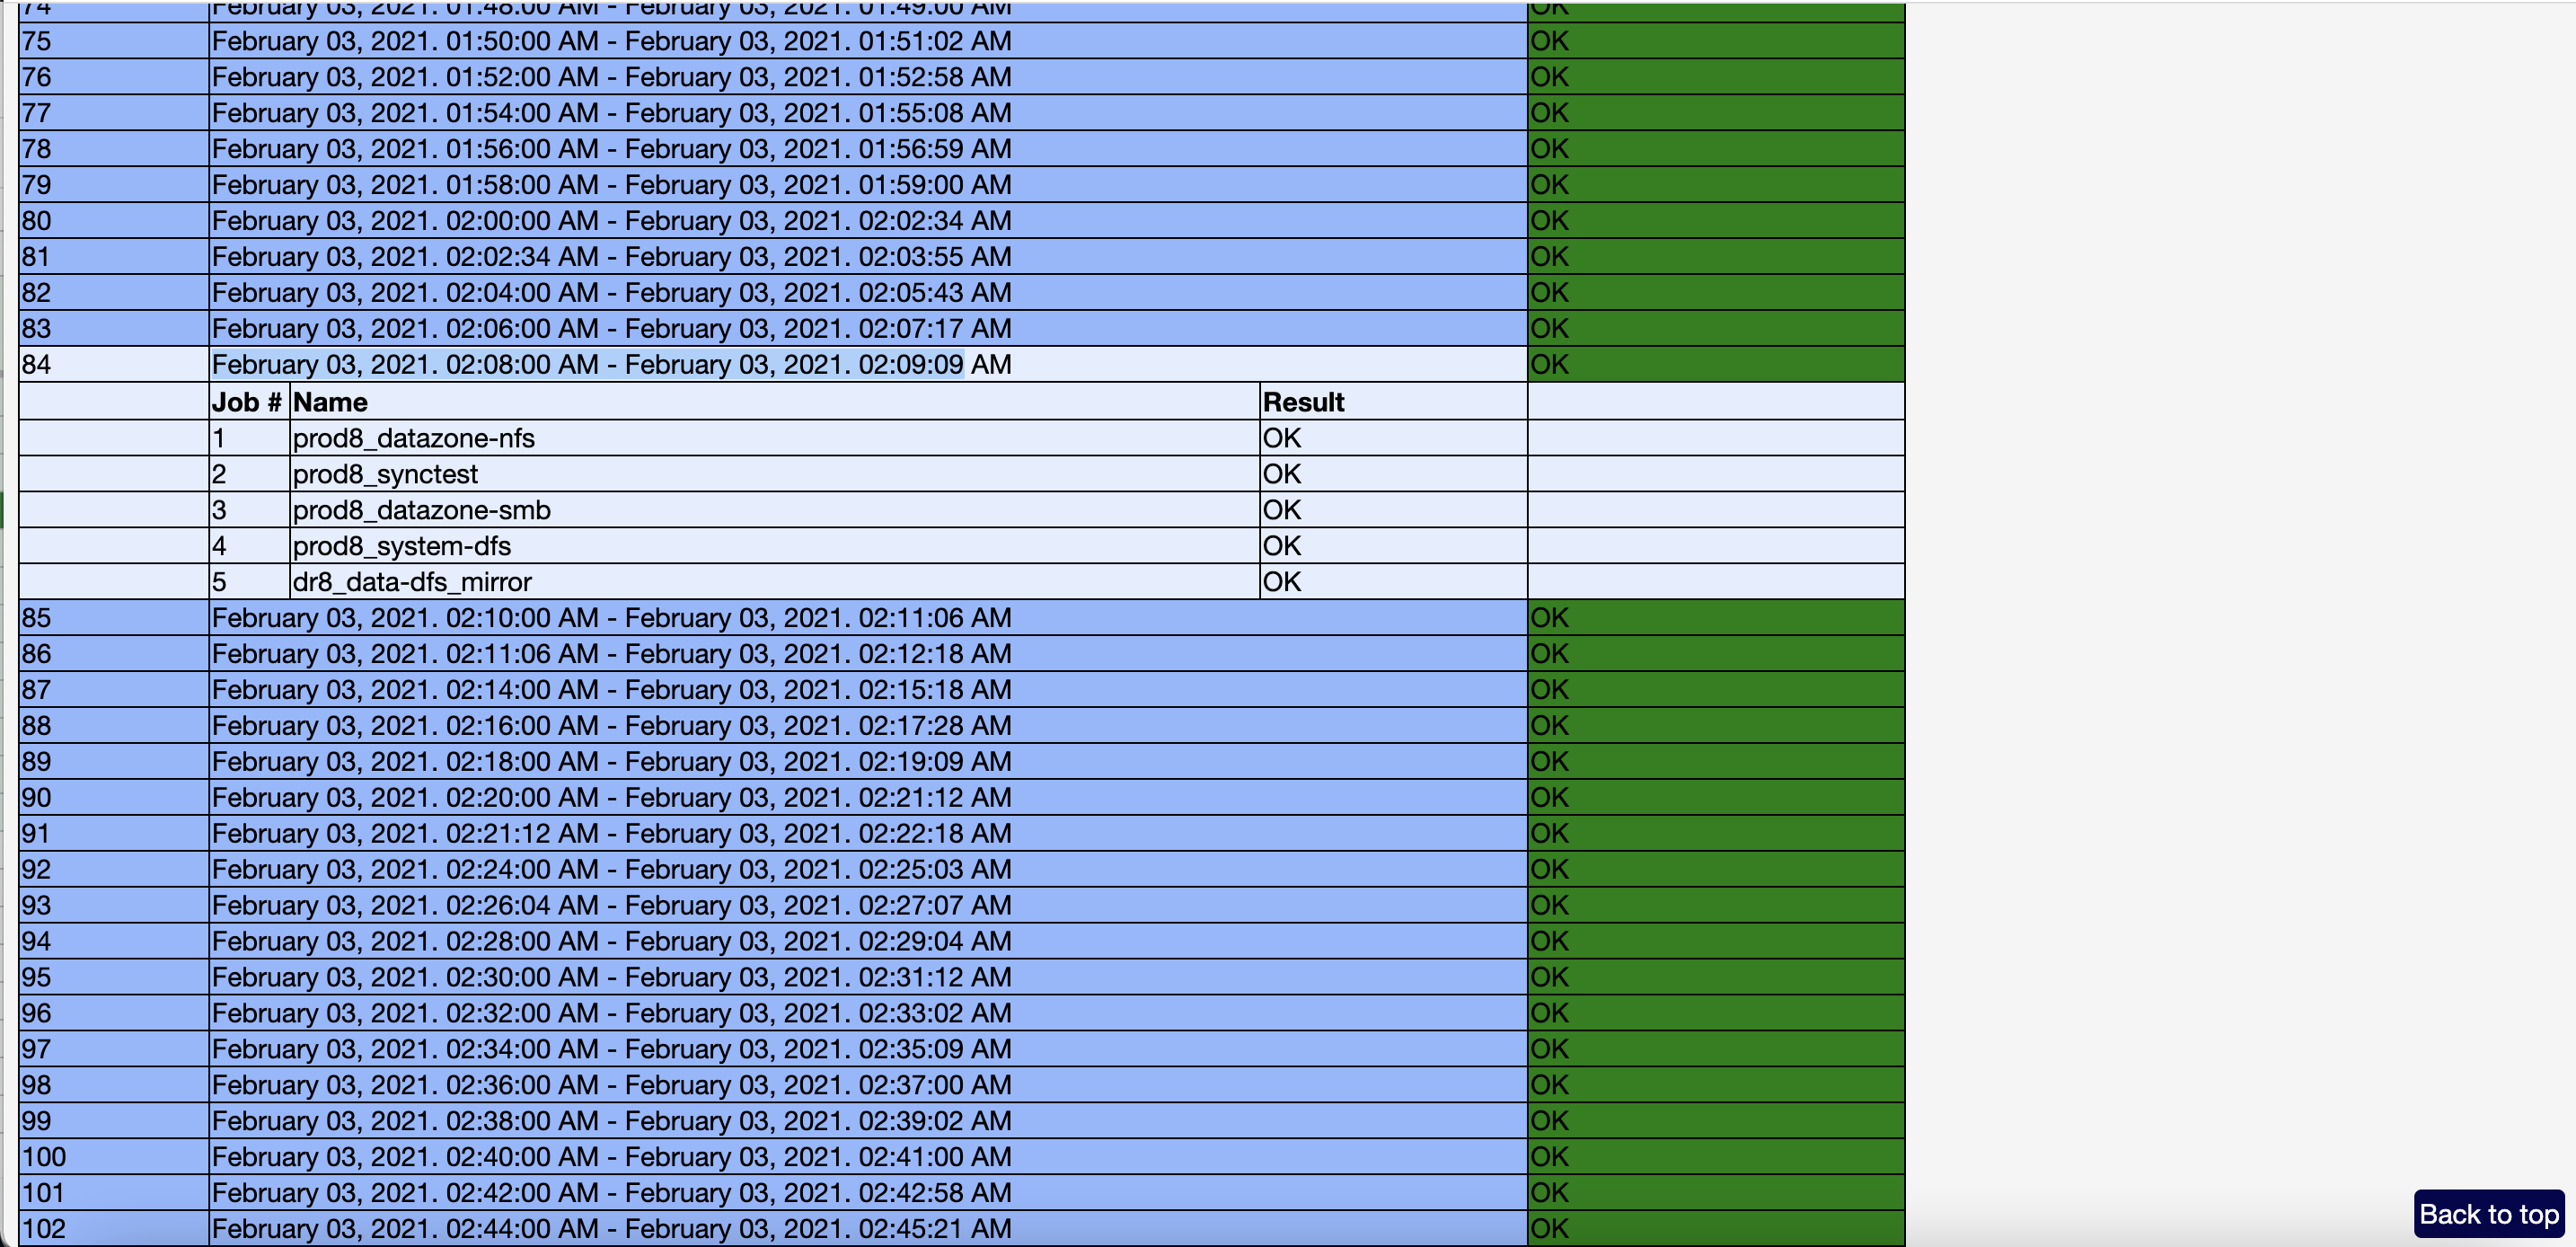
Check turboaudit health and event rates by click the Event Rates/Turbo Audit table of content menu Item number 23 Event rates
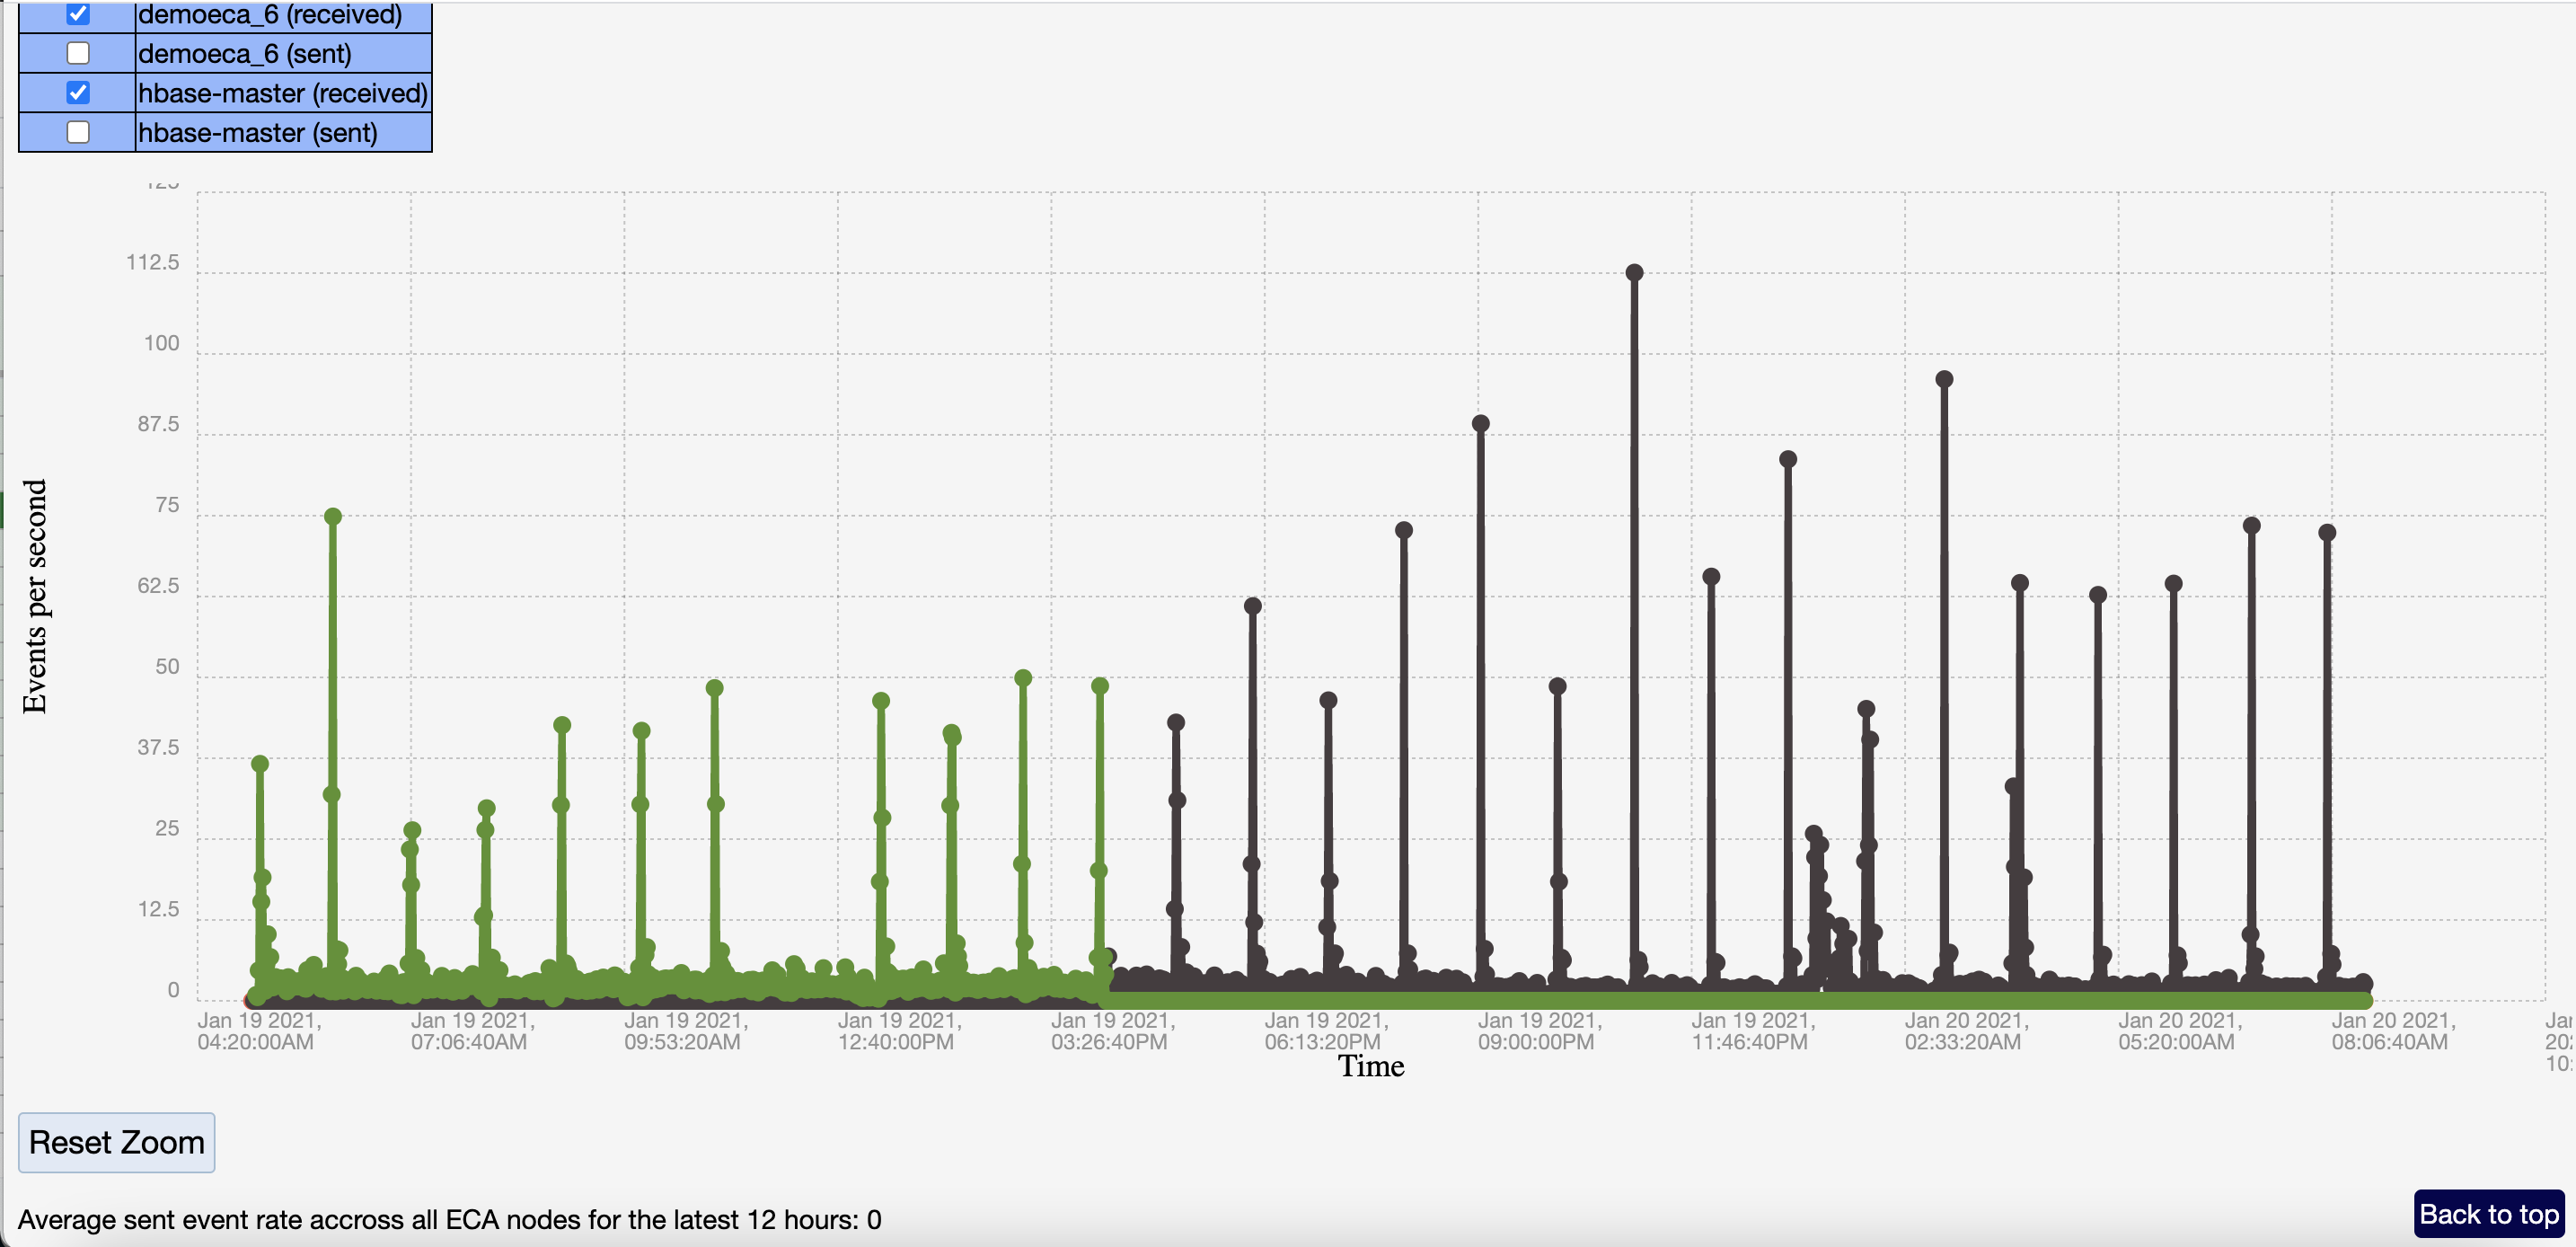
NOTE: Sent and receive Rate for nodes 2-6 ECAs (check sent and received independently).
NOTE: For “Received” MAKE SURE above 0 EVTS all the way to the right side of graph. IF ALL ZERO this is an issue. Flag for case follow upCheck evtarchive container health and event rates by click the Evt Archive Event Rates table of content menu item number 24 "Evt Archive - Event Rates"
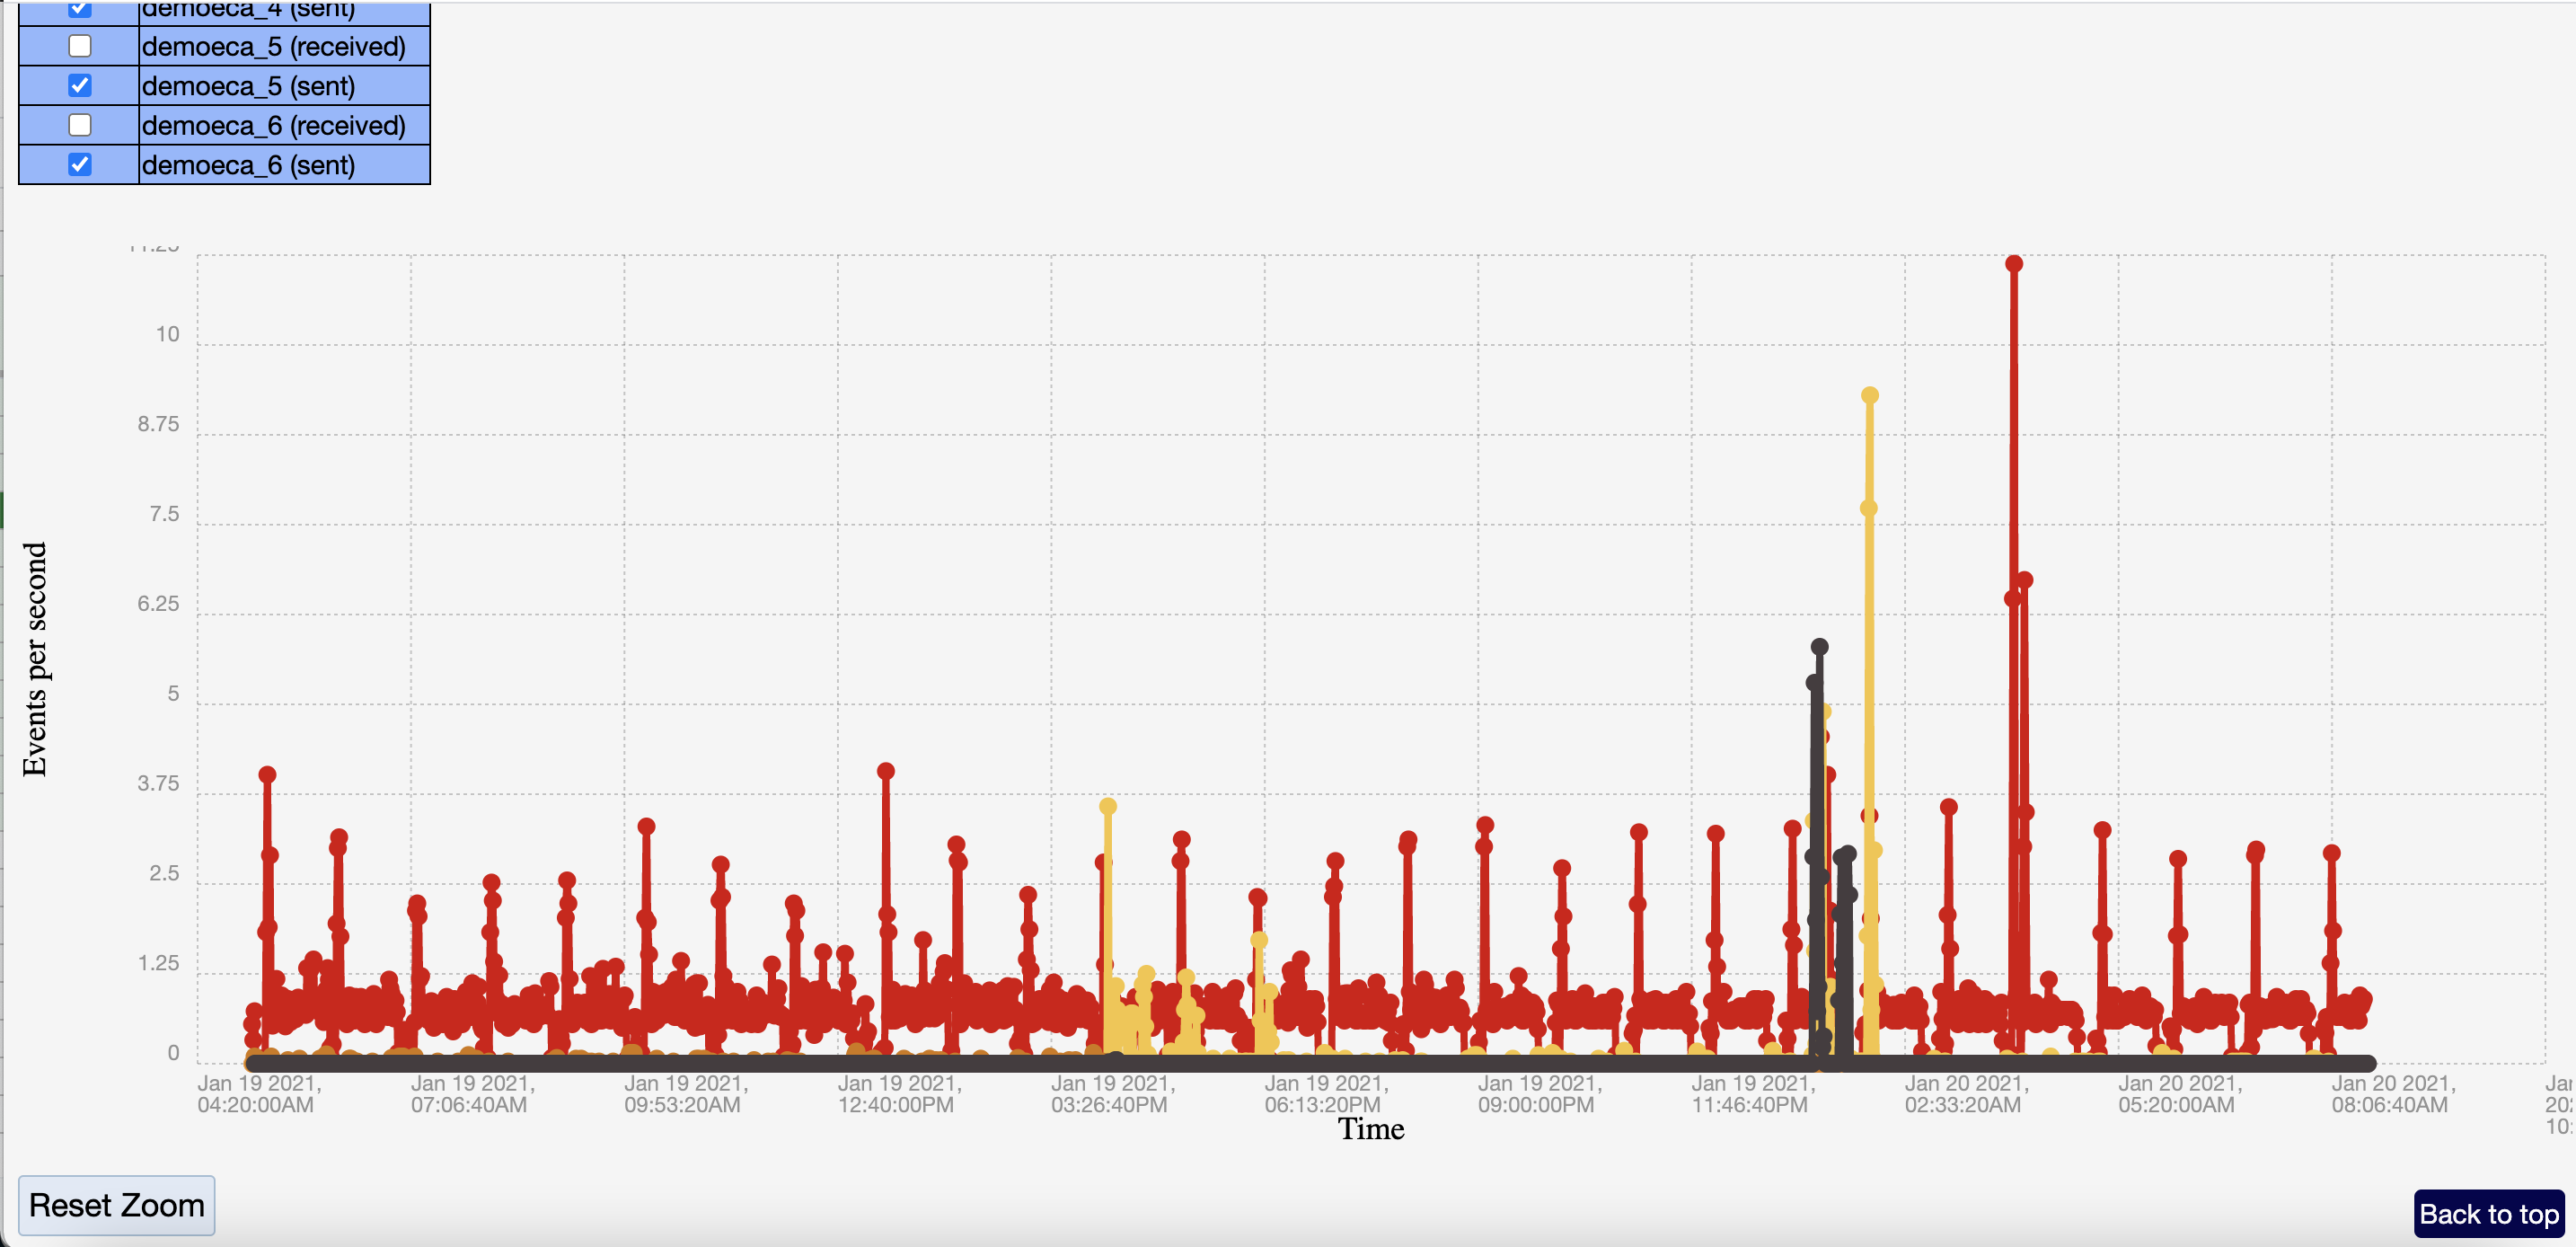
NOTE: MAKE SURE above 0 EVTS all the way to the right side of graph. IF ALL ZERO this is an issue. Flag for case follow upCheck ECA node disk space
You may be asked to check disk space as well as CPU/MEMORY usage for ECA nodes. Select the ECA disk usage TOC to check disk space.
ECA Specific Support data in the Support Report
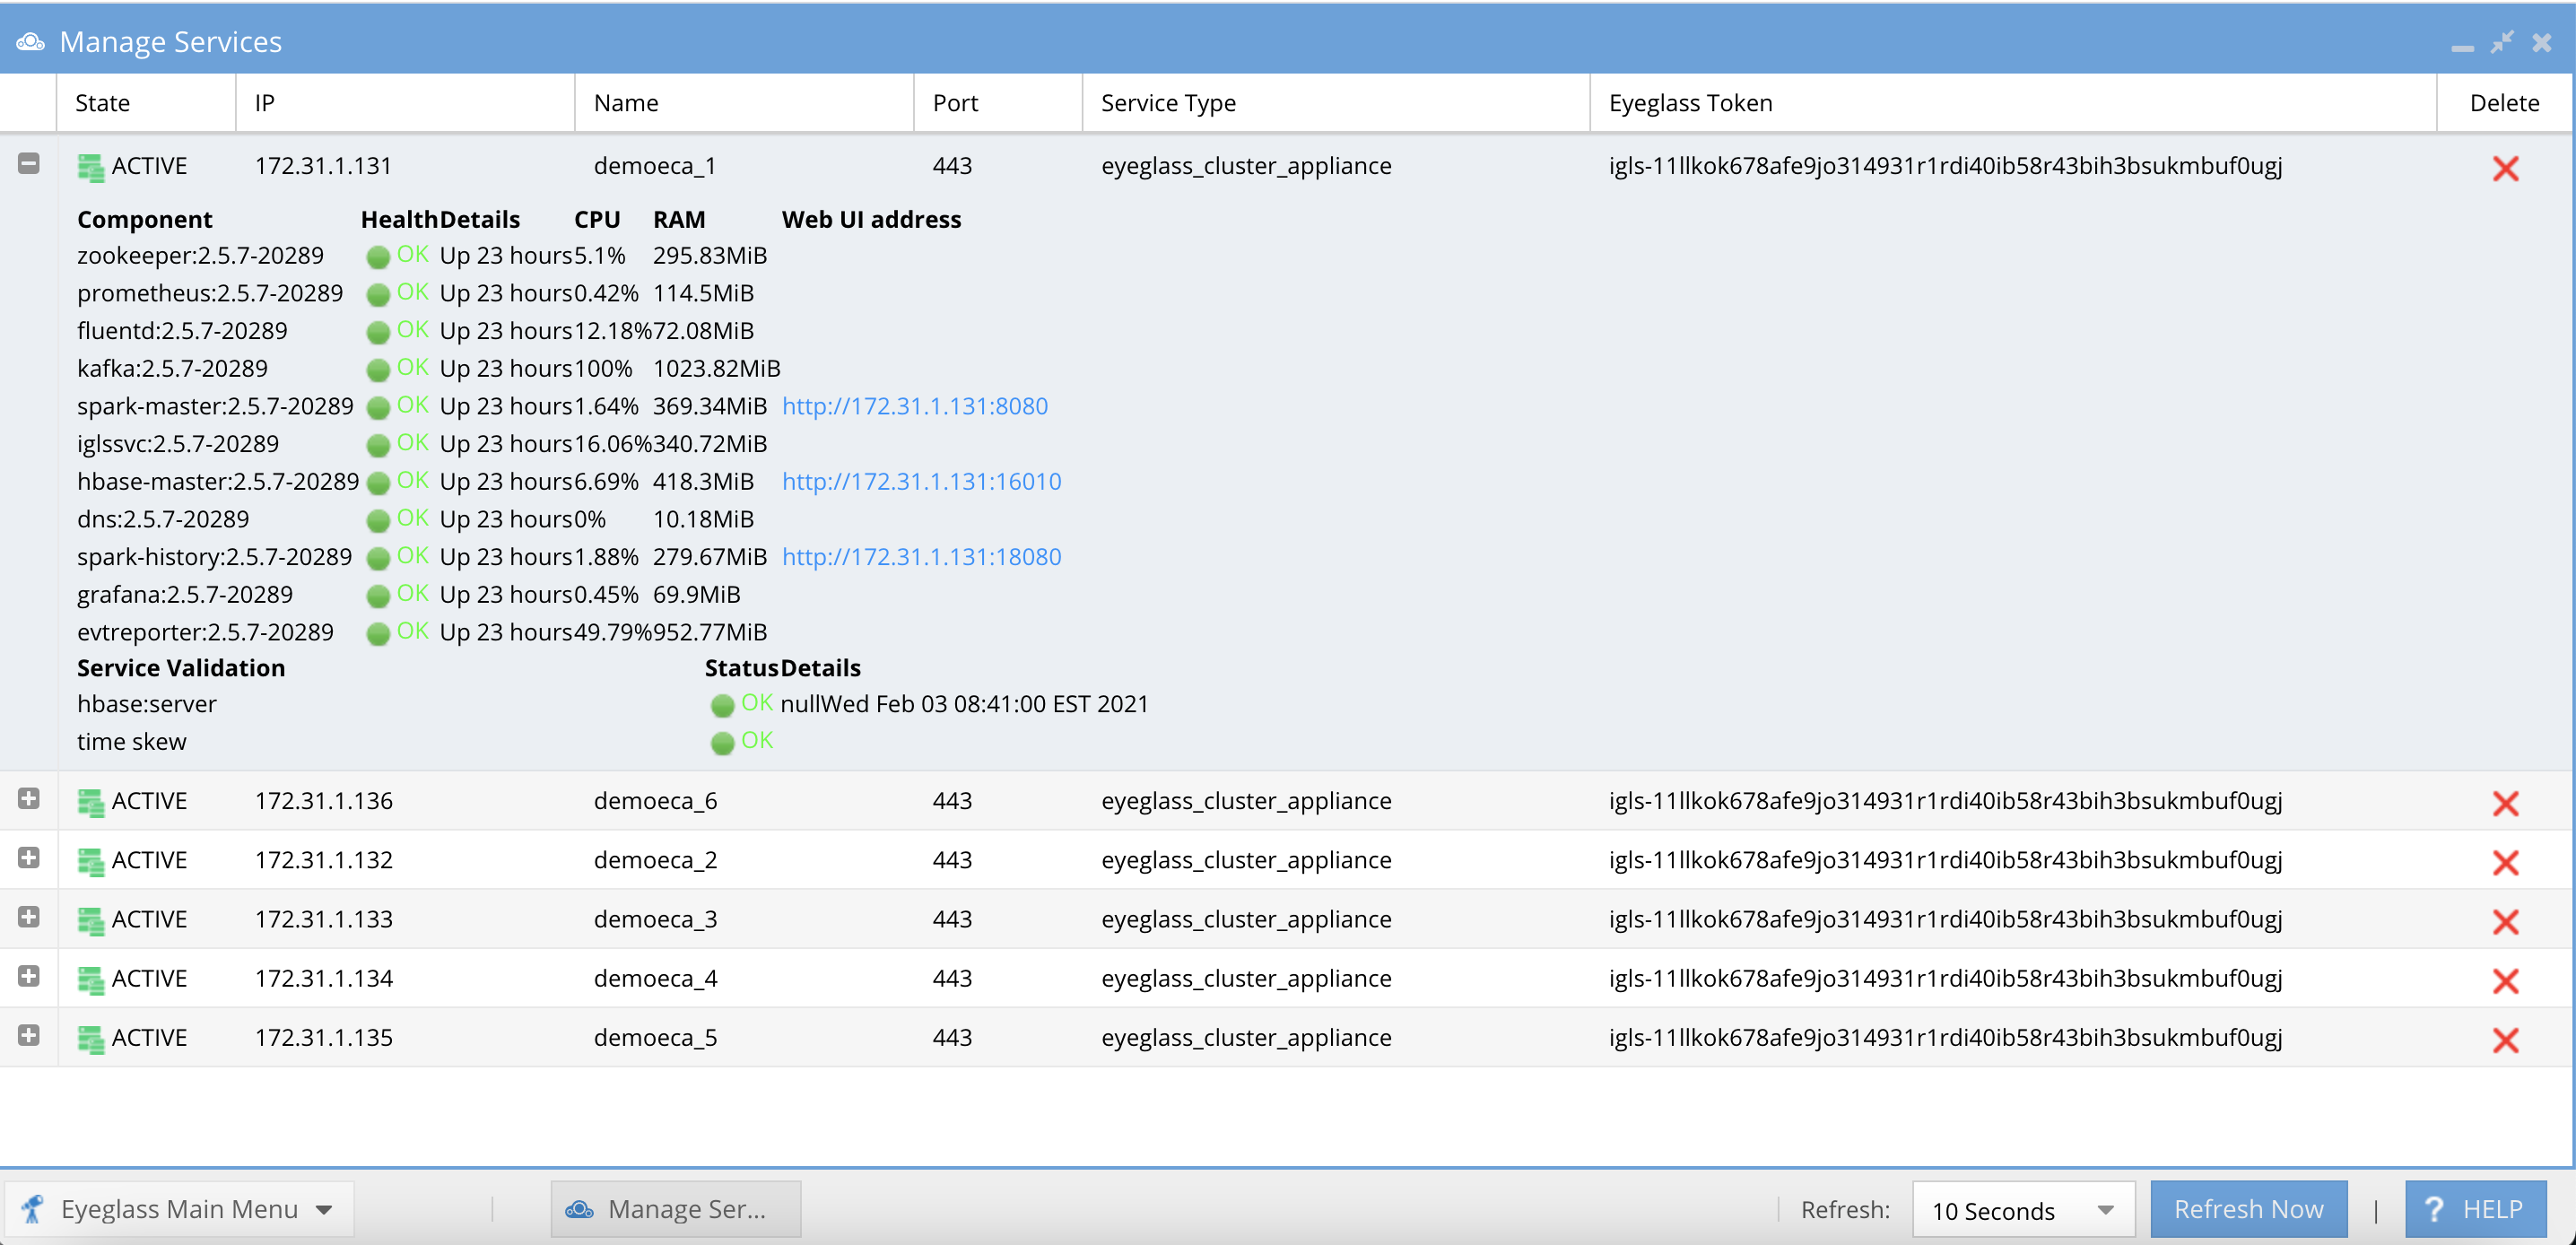
First check Manage Services in Eyeglass. If you notice a red/yellow warning, open the widget
If containers are showing INACTIVE note down the node # and names of the containers
Login to ECA node # using SSH session [Putty]
First thing to check is Eyeglass version and summary. Support team will ask for:
Eyeglass version,
Total RAM,
OS version etc
If you are running EOL version of Eyeglass, support team will request you to upgrade Eyeglass appliance.
If Eyeglass Replication jobs are in ERROR state, click to expand and then hover over to read the ERROR message
Provide the error msg to Eyeglass support team
Support team will ask for additional information such as Active Alarm. Scroll down the page to locate the alarms. Use menu item #2 for active alarms
ECA Health check for Dark-Sites
When Eyeglass support team is asking for health check status please perform the following steps and provide output to agents:
Login to Eyeglass Appliance Web UI
Check for error/warning in Manage Services.
If you have received an Eyeglass alarm - collect the information and provide to support
Open Eyeglass Manage Services widget and check containers state
ECA containers provide Web UI access to collect information. You can locate the Web UI link from Manage Services window
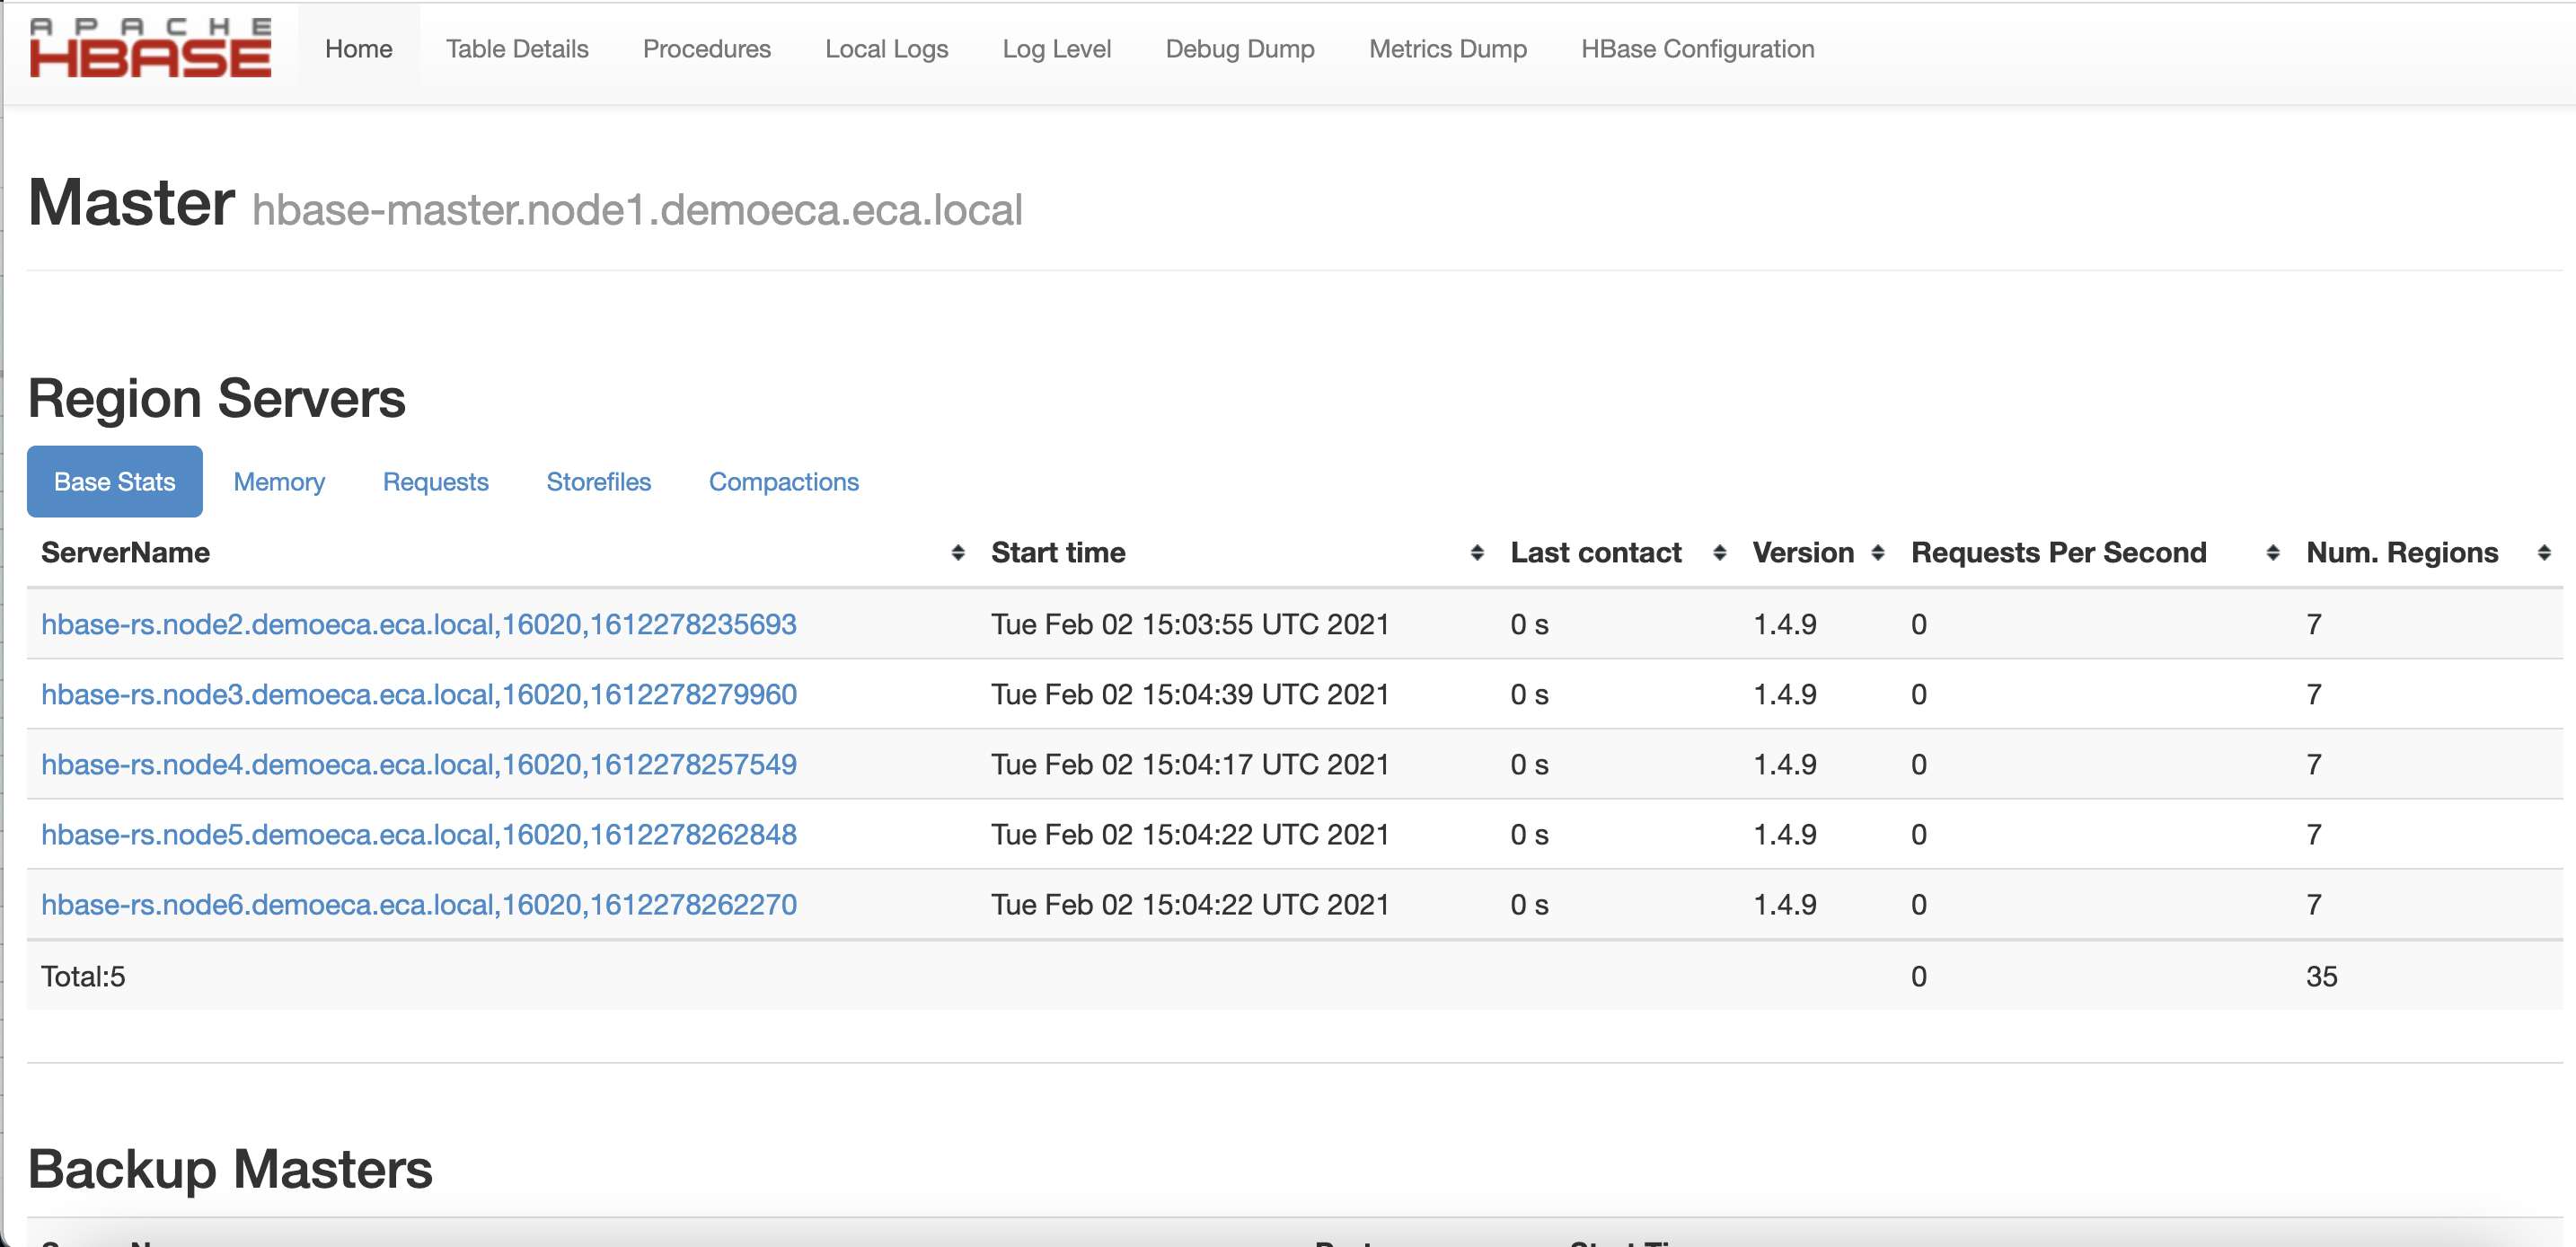
Hbase-master Database Health Check
Support team may ask for hbase-master server status. To collect hbase-master statistics,
a) Browse to http://<ECA_NODE1_IP>:16010
b) Take Screenshot:
c) Check Hbase tables. Look for Offline/Failed regions take screenshot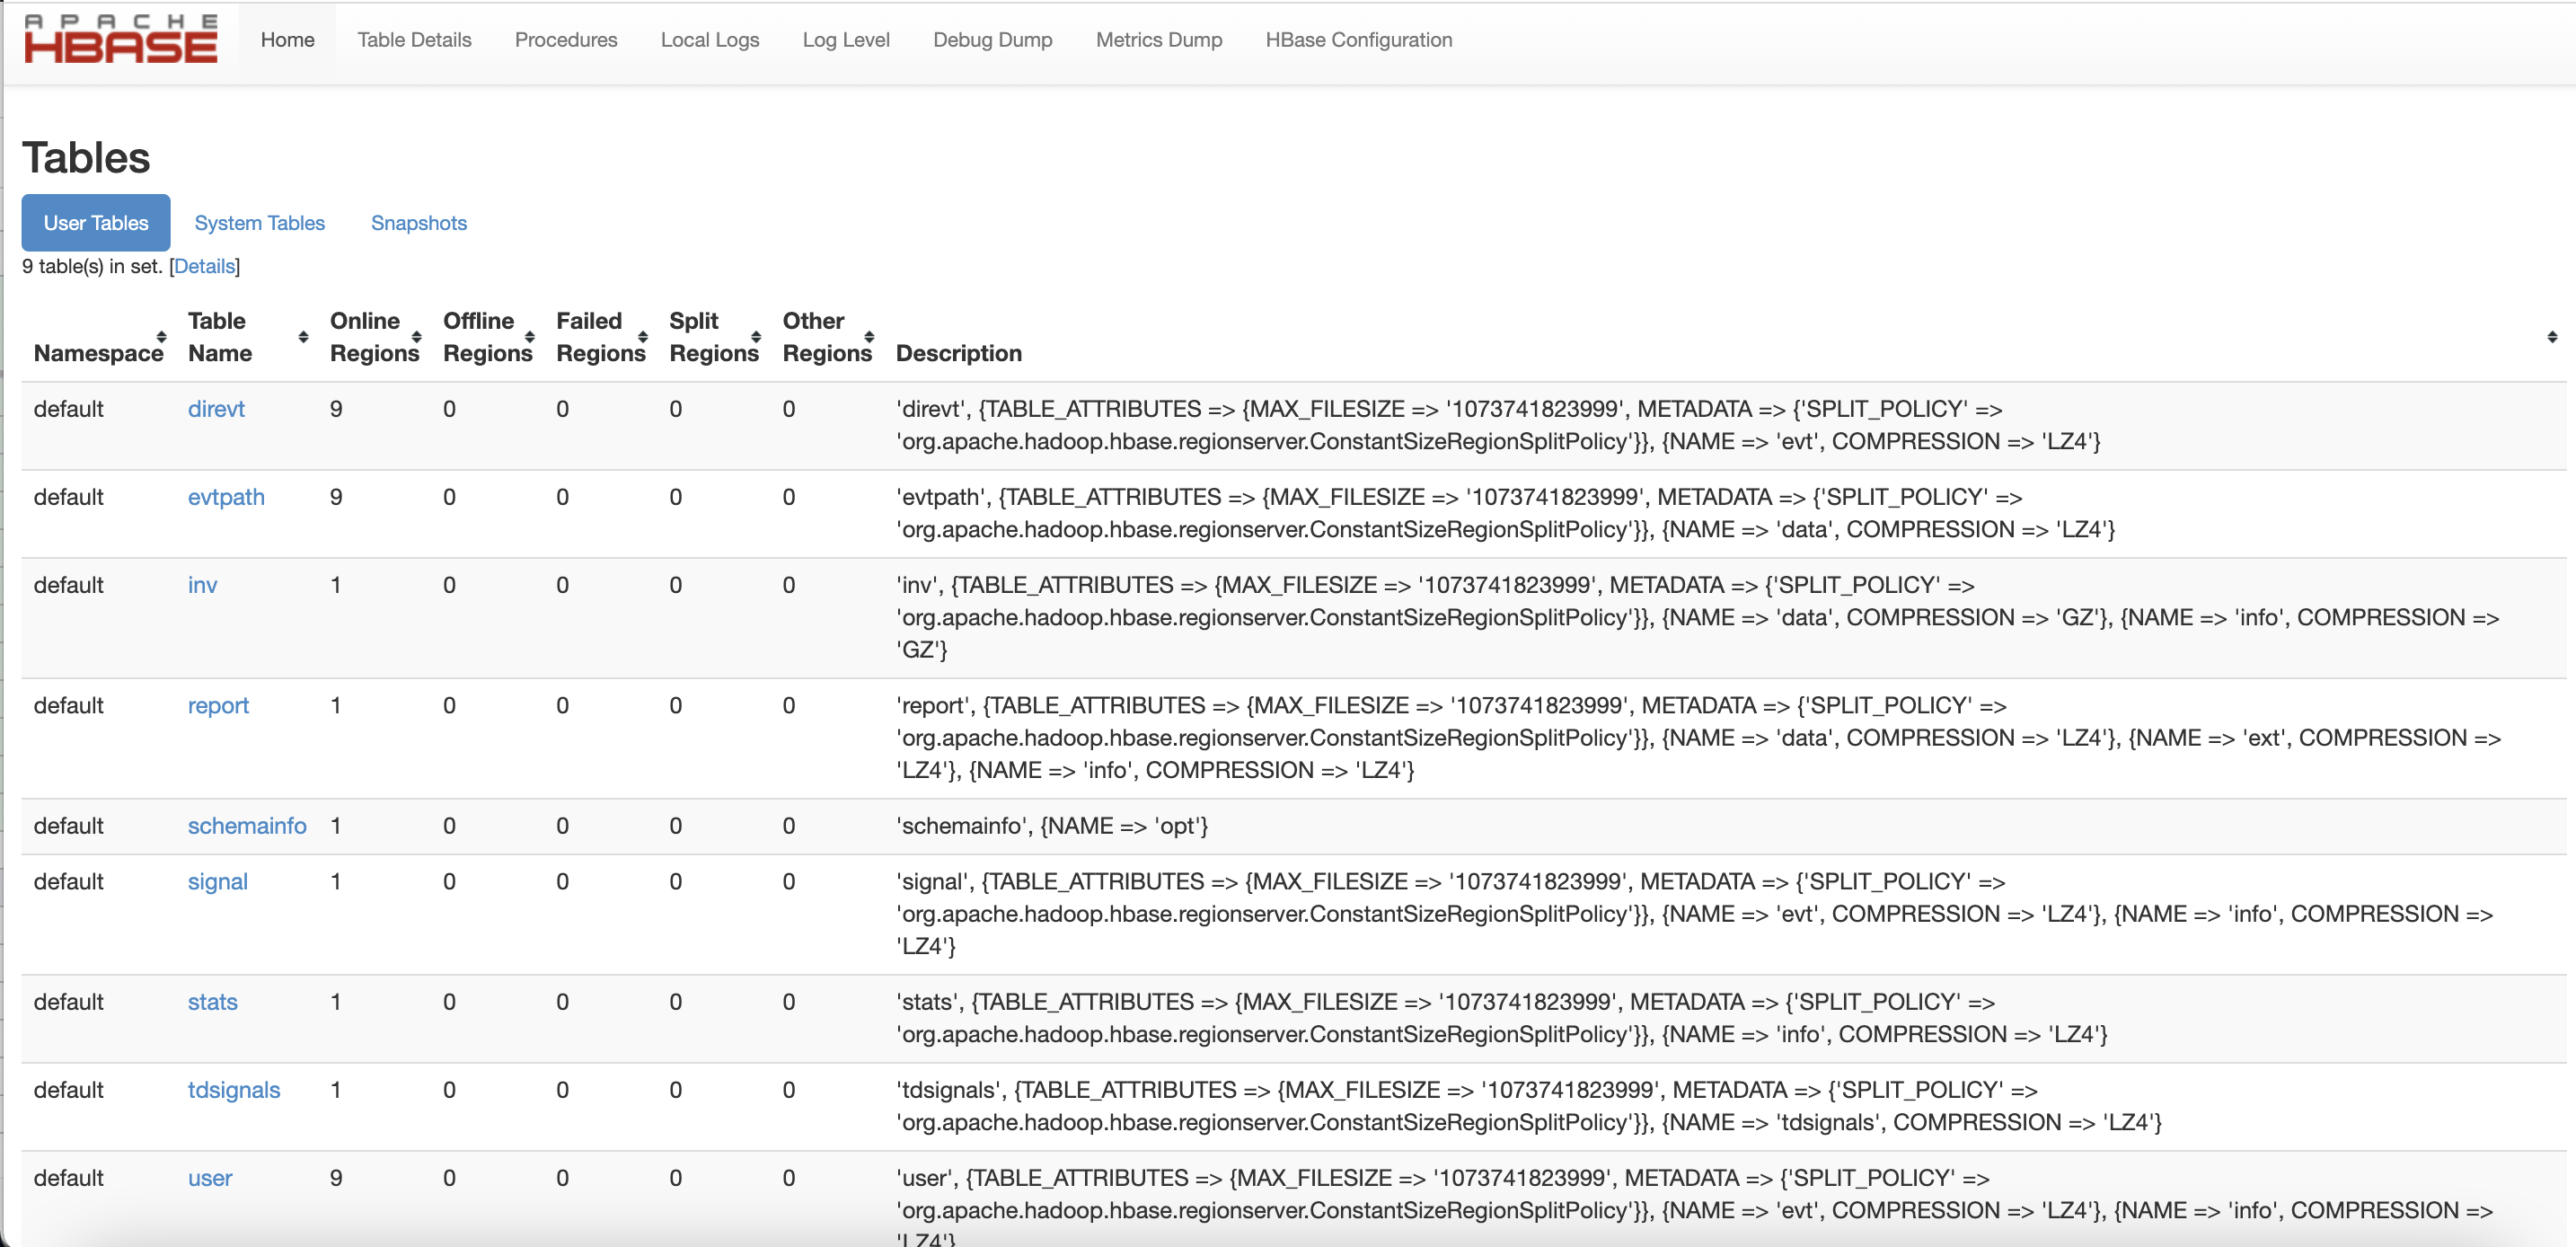
d) Collect the hbase-master server info and provide to support
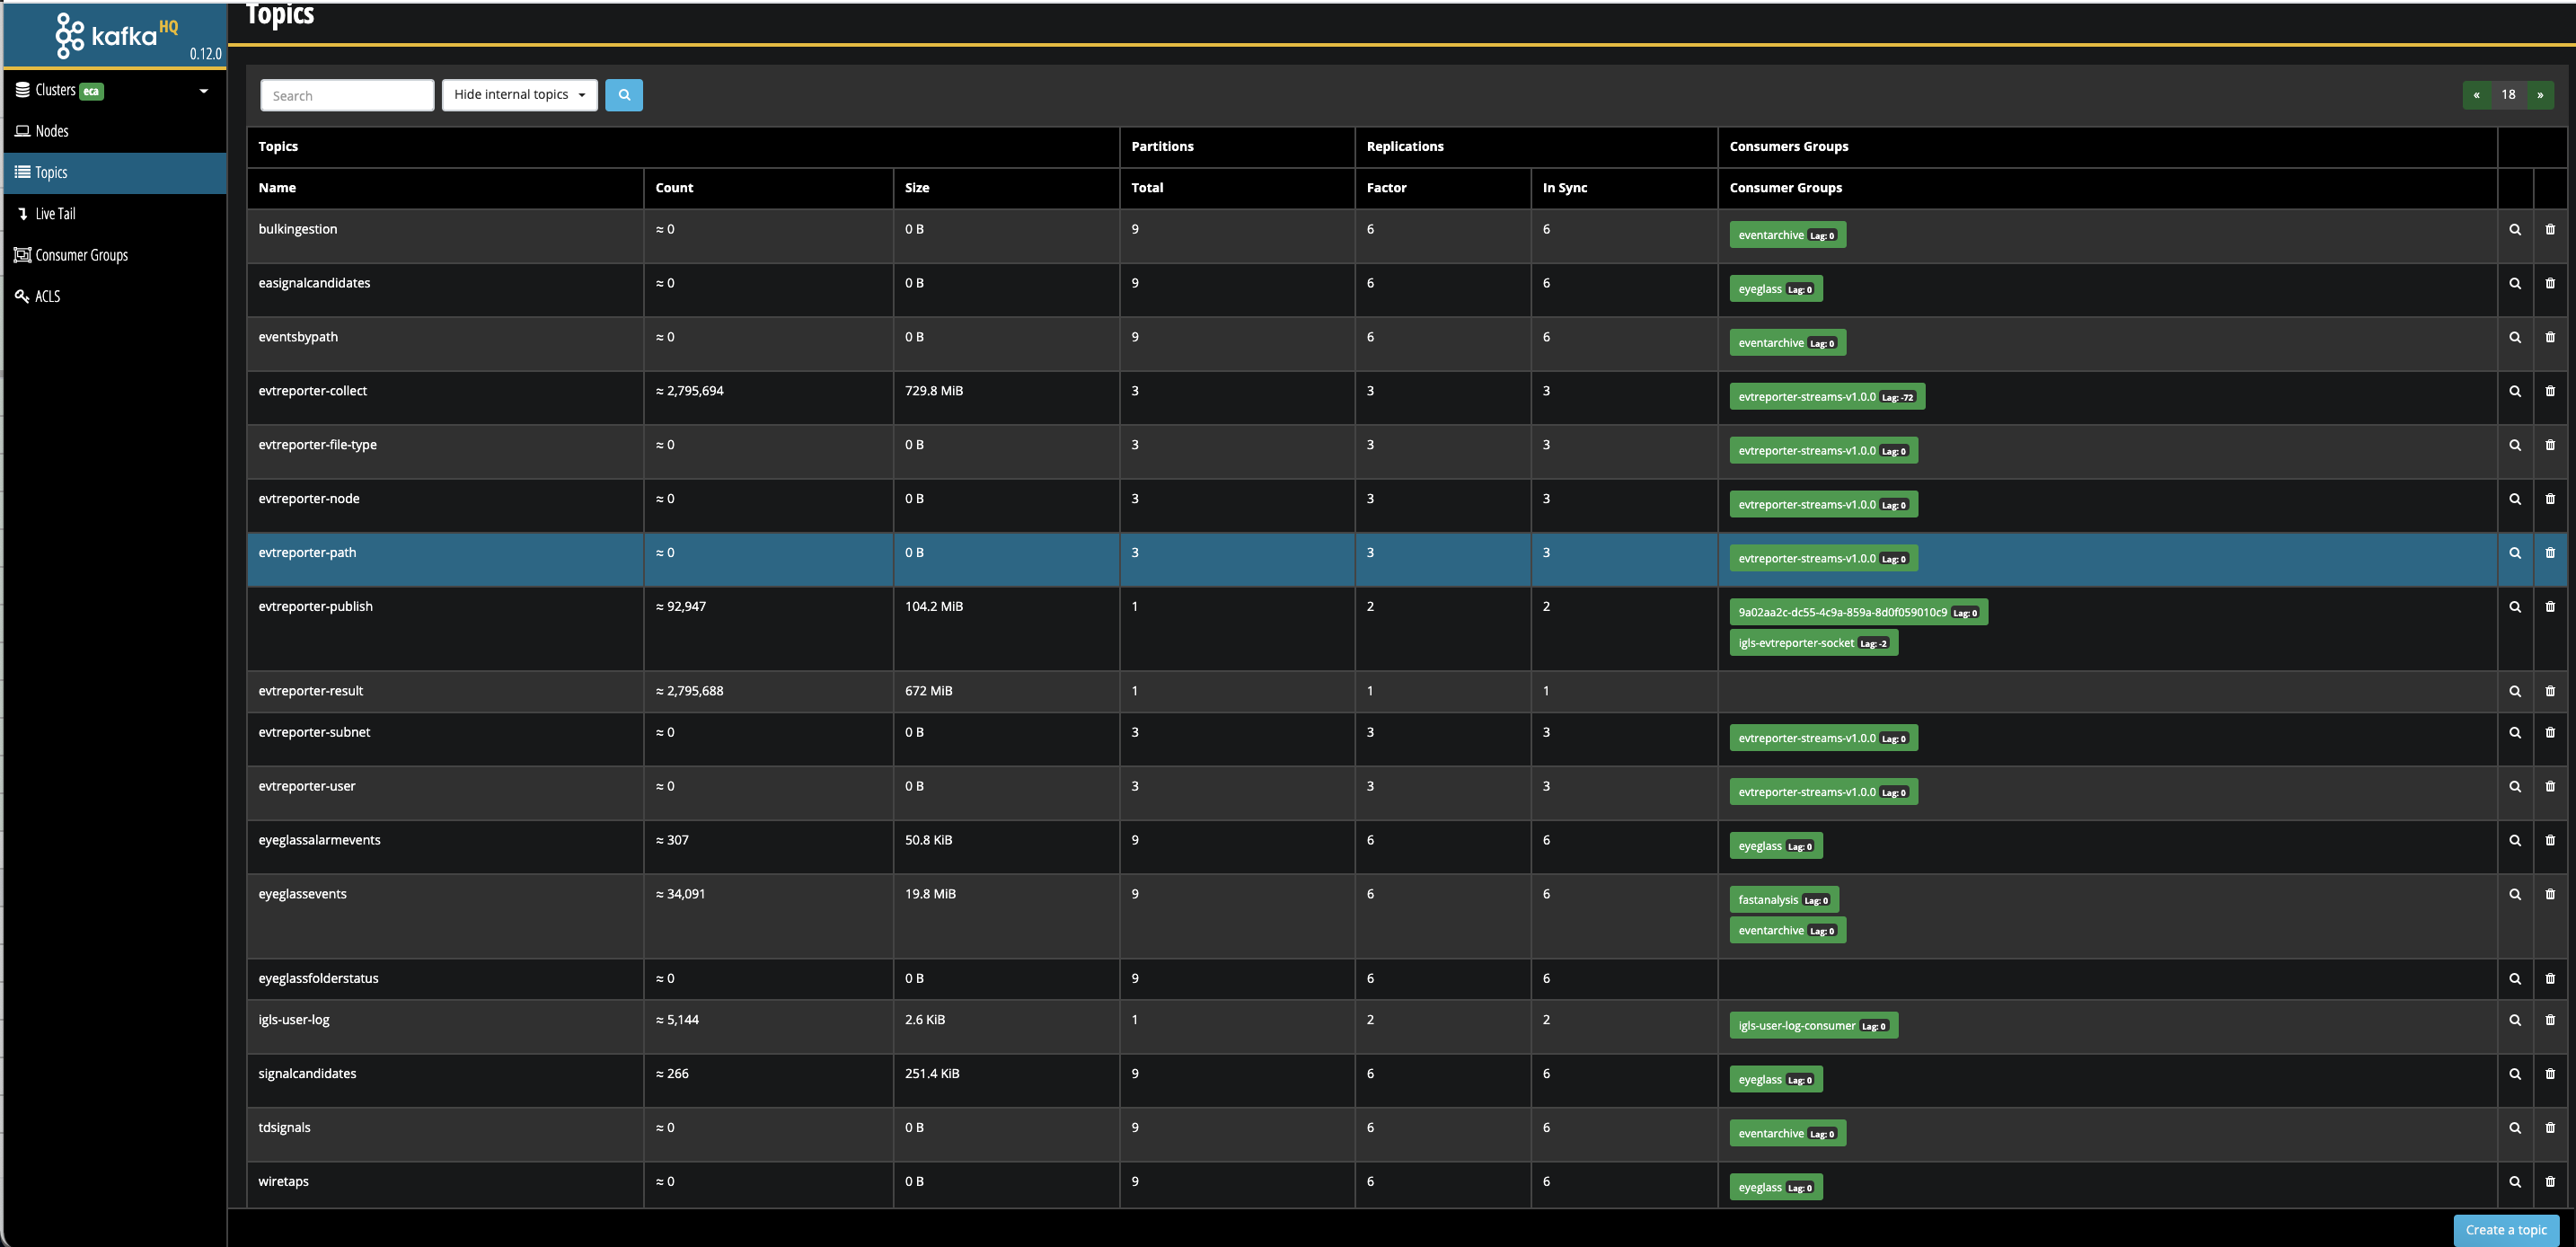
Kafka-manager Health Check
Support team may ask for kafka-manager status. To collect kafka-manager statistics,
a) Browse to http://<ECA_NODE1_IP>/kafkahq
b) If kafka-manager is NOT configured, set it up before using it from node 1 of the eca
ecactl containers up -d kafkahq
ecactl containers start kafkahq
Take screen shot and add to the support case
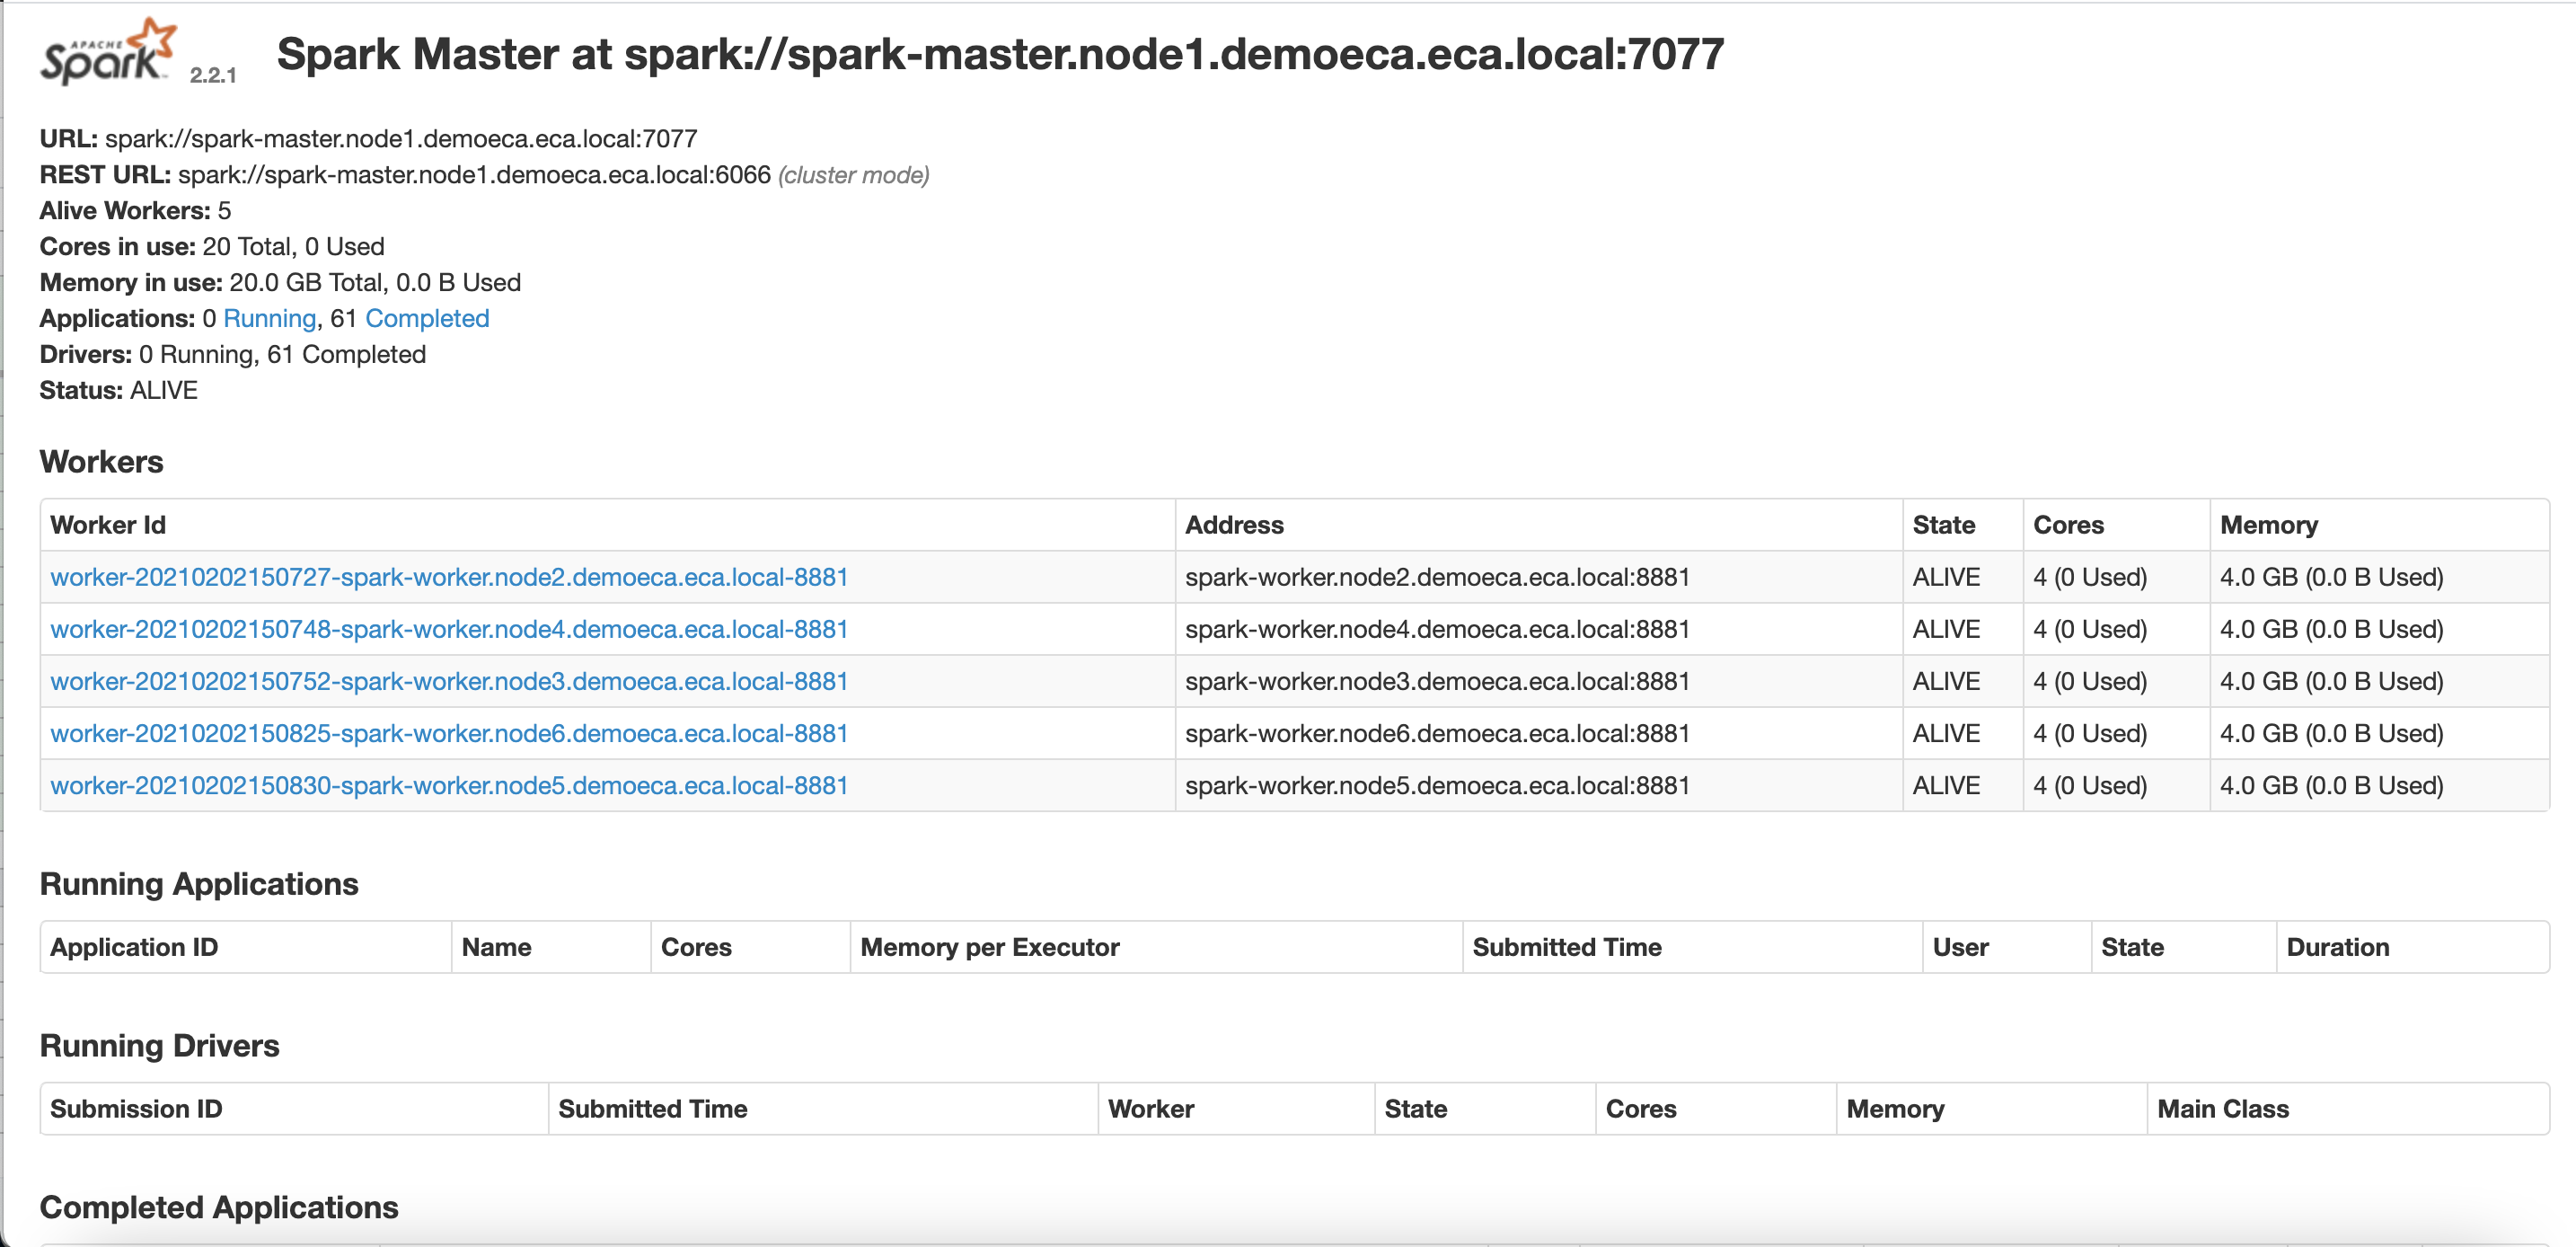
Spark-master Health Check
When Easy Auditor reports having issue, support team may ask you to check spark-master GUI. For this reason, you need to browse to spark-master Web UI
- Take a screenshot as per below.
© Superna Inc