How to Monitor the Eyeglass Assisted Failover
In-Progress Failover
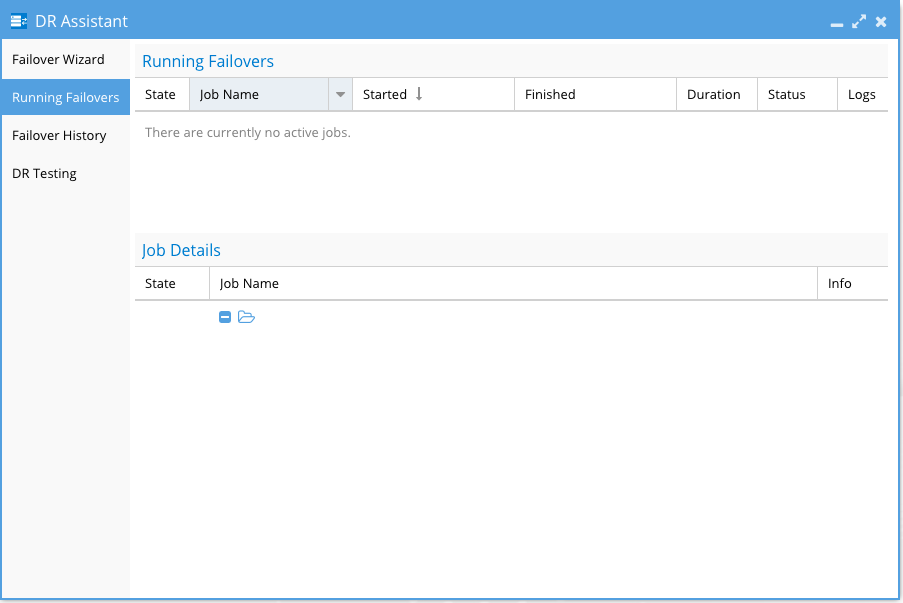
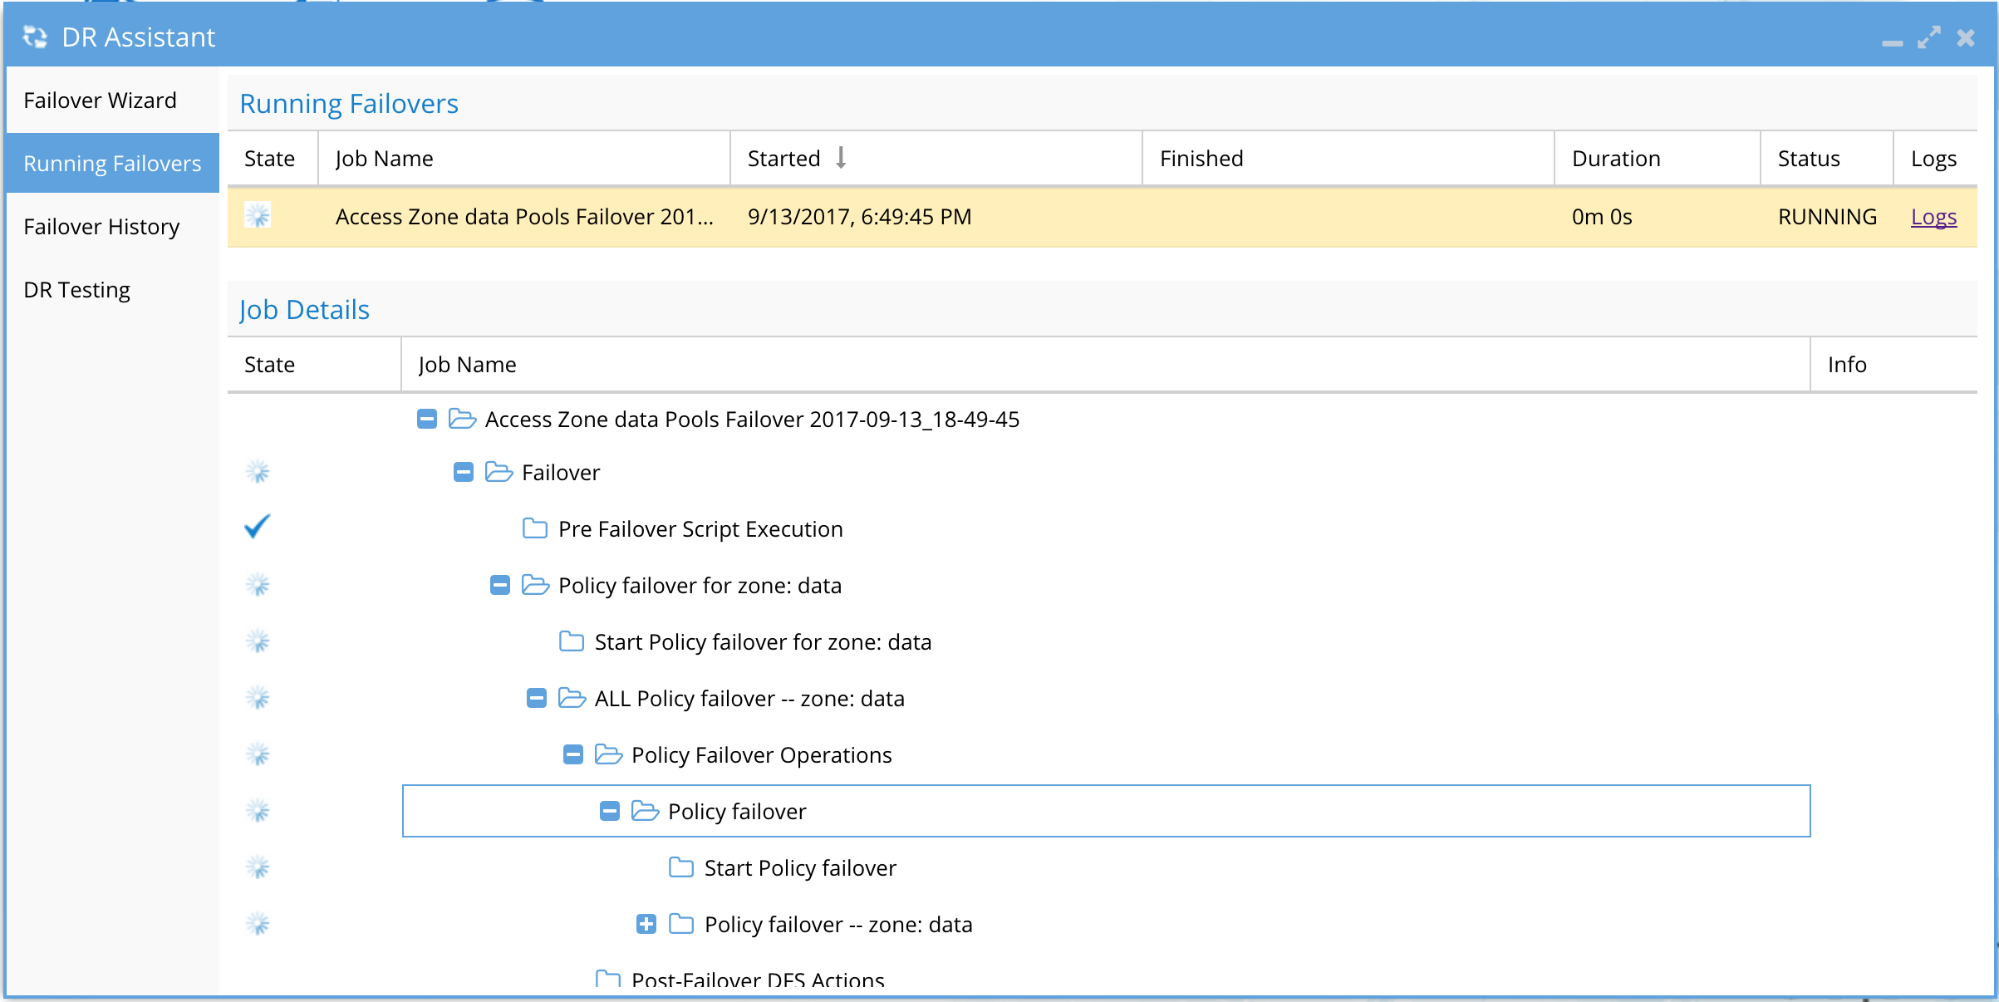
Once a failover has been started, you can monitor its progress from the Eyeglass DR Assistant / Running Failovers tab.
From this window you can expand the Job Details tree to see the progress and status for each failover step.
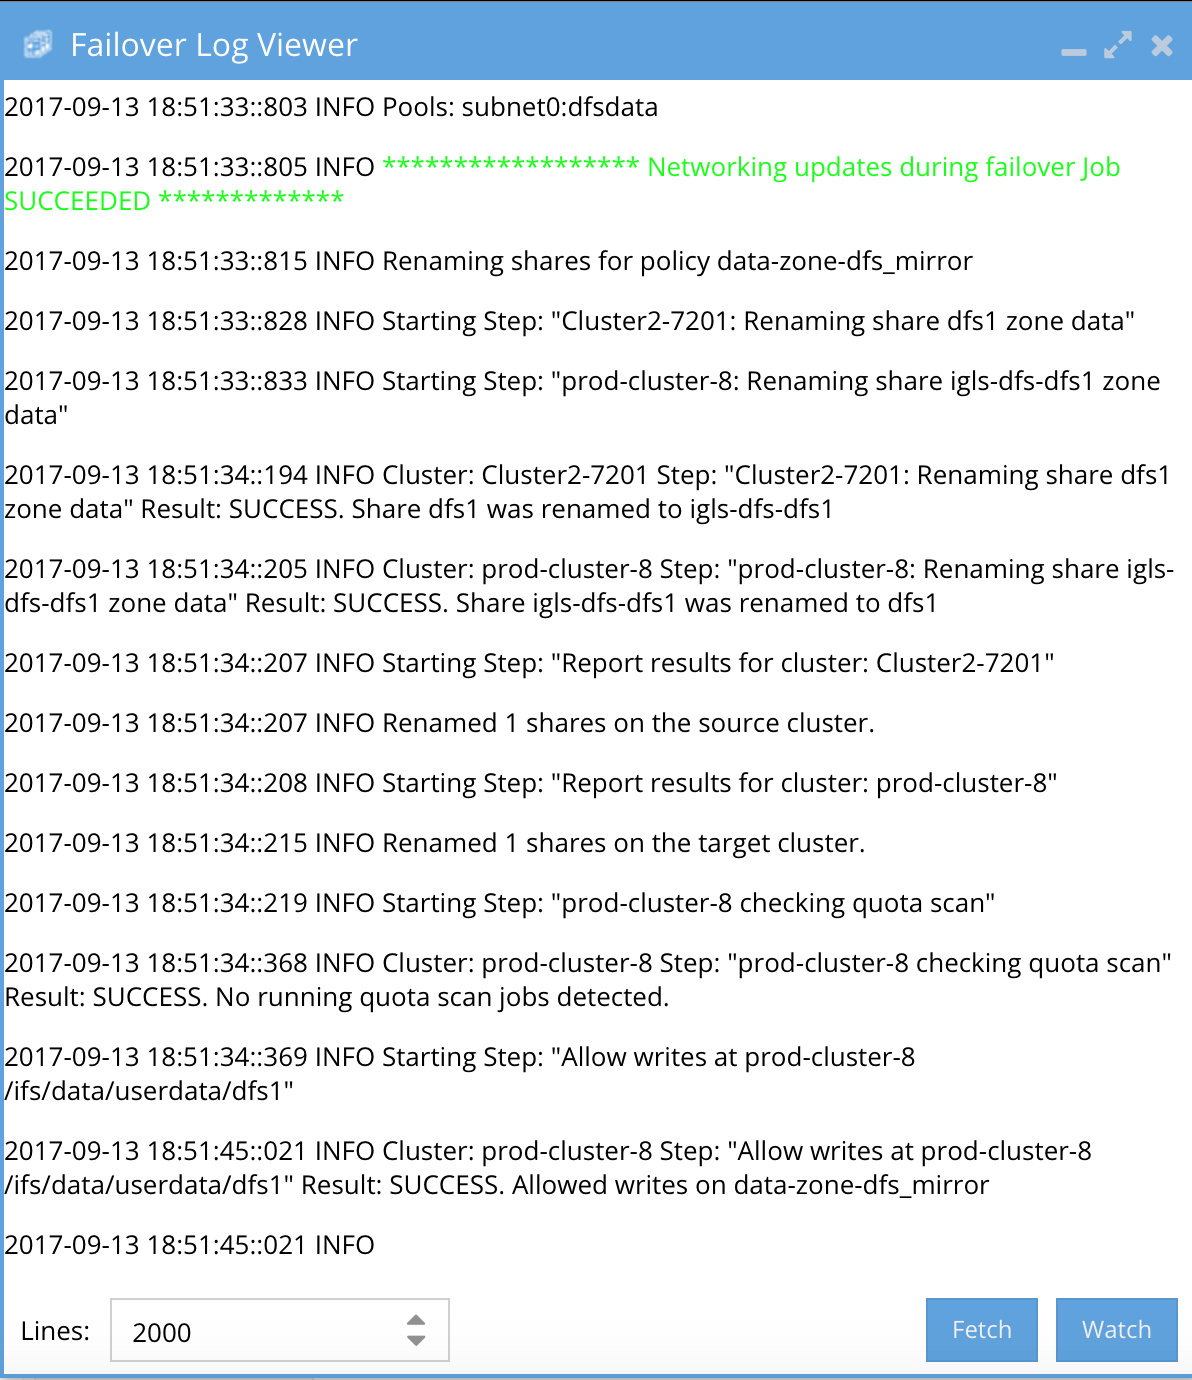
You can also open the failover log from this window to see the details for each step by selecting the Logs link.
- As of release 2.5.6 or later a copy to clipboard option is available and link to support site.
- The failover complete popup window is also new in 2.5.6 or later to prompt Data Access Testing as soon as all required steps are completed.
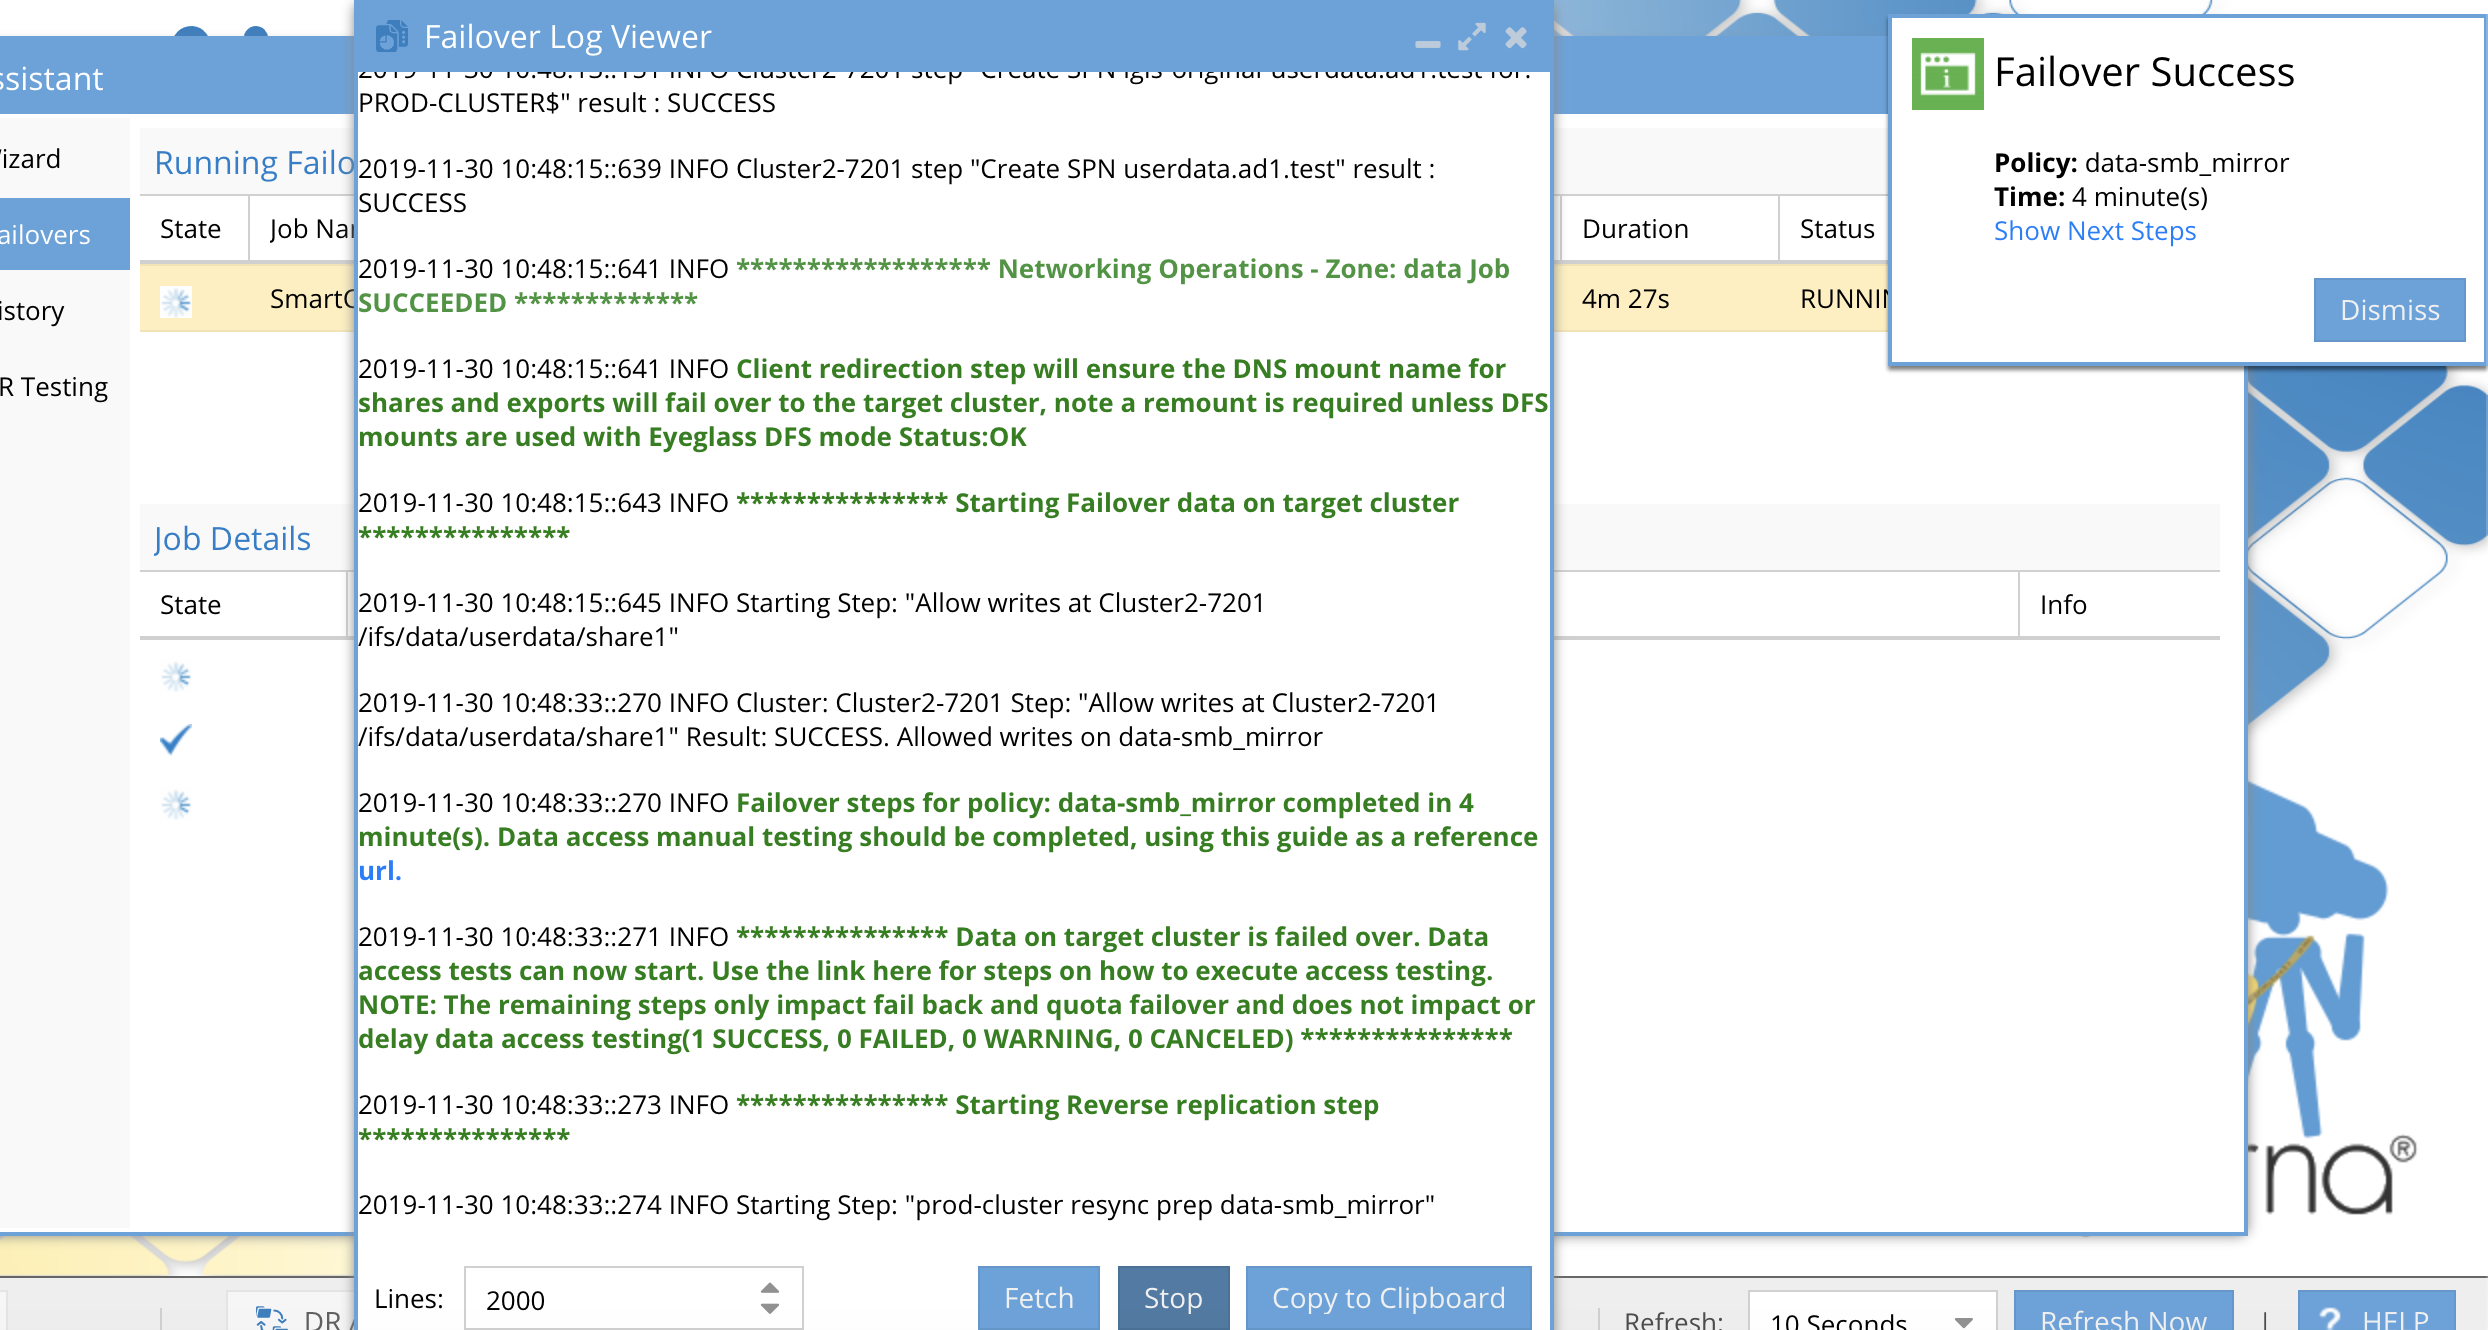
Each entry in the log is timestamped. The log is updated as the failover proceeds and you can see log updates by closing and opening the log file again.
Should an error occur during failover, an Eyeglass system alarm will be issued. If you have configured external notification by email or Twitter you will receive these alarms this way. The alarms are also visible from the Eyeglass Alarms window.

Completed Failover
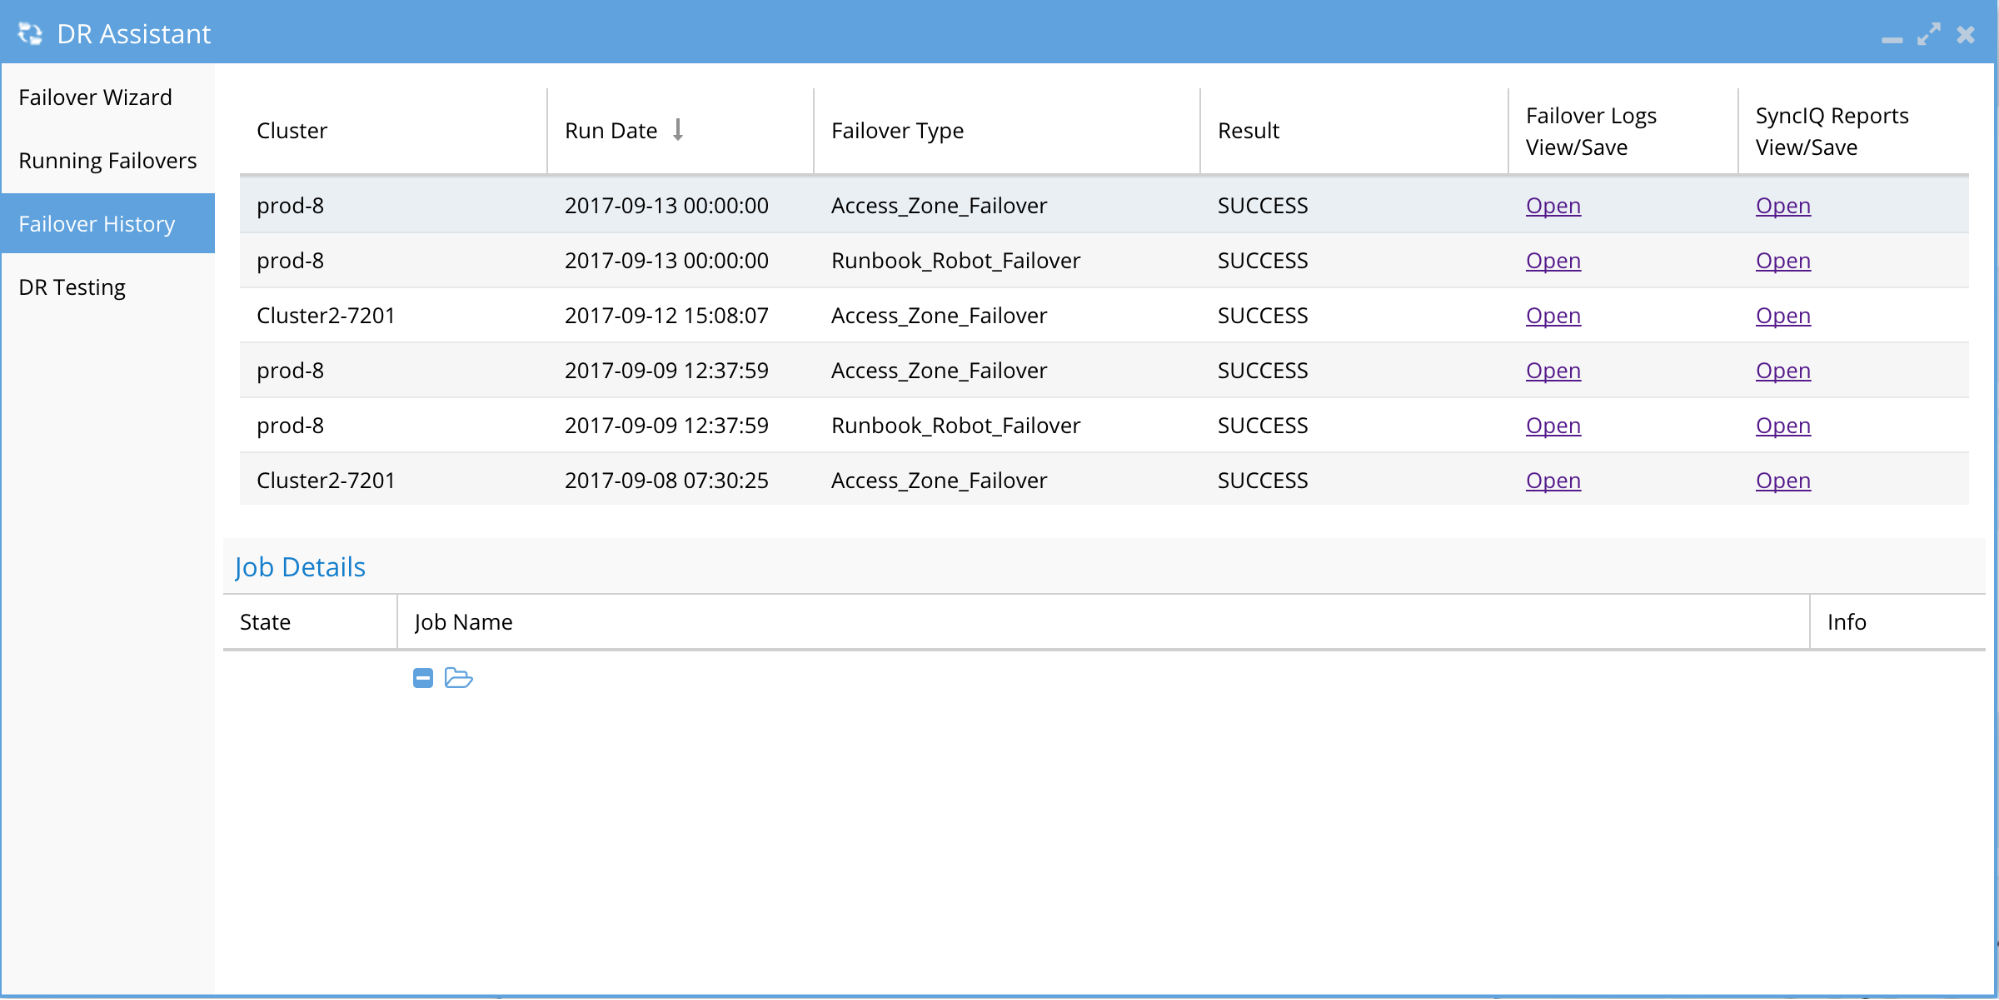
Once the failover is completed, it will appear in the DR Assistant / Failover History tab.
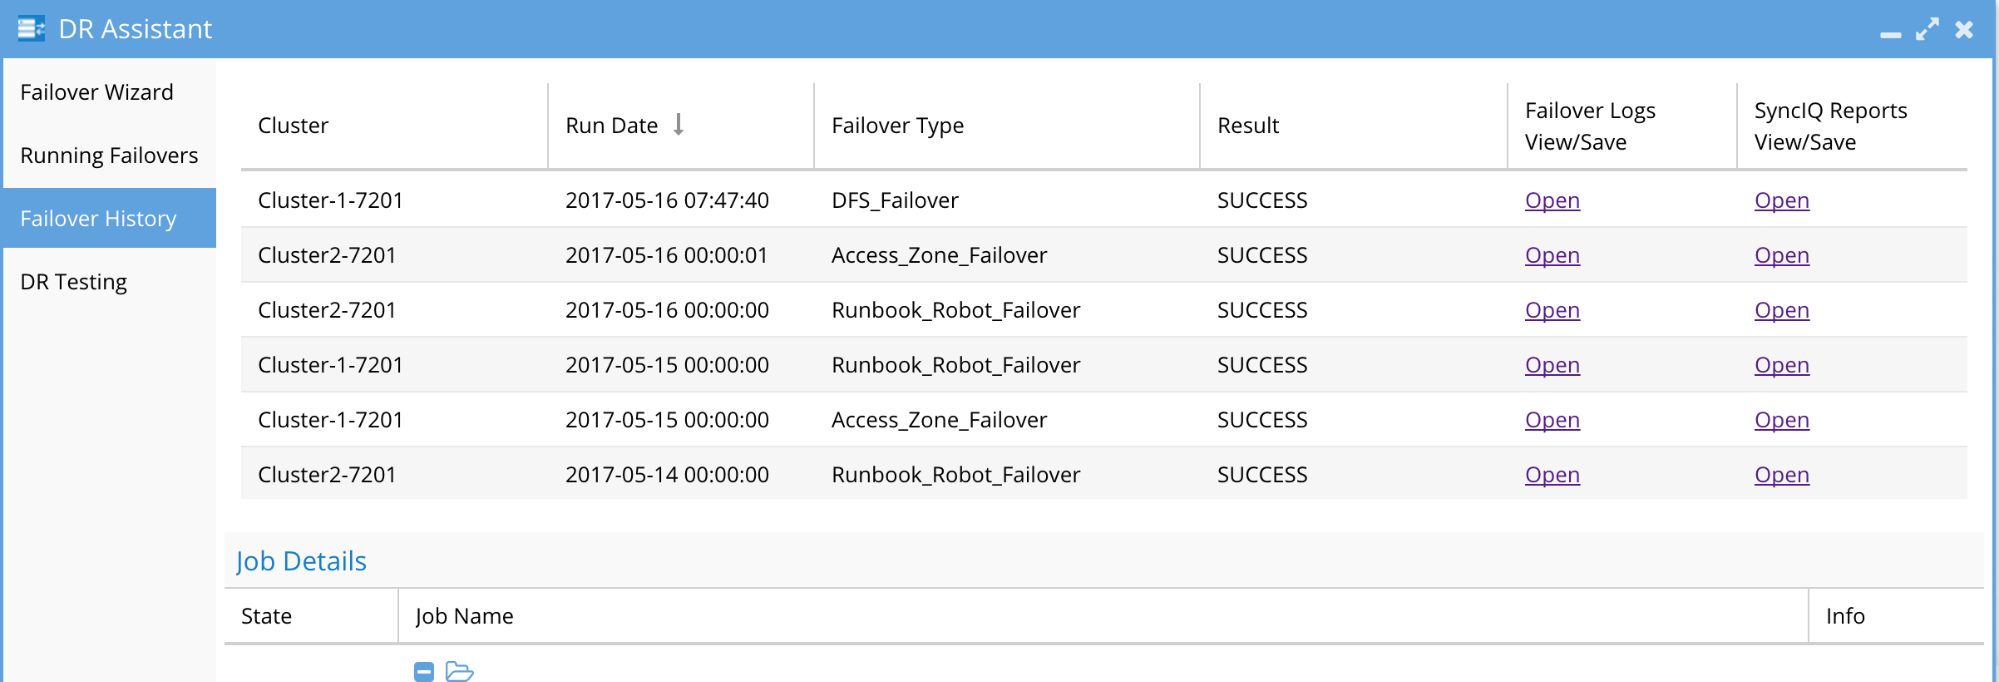
The Result column displays the SUCCESS if the Failover completed successfully and FAIL if there were errors encountered in the Failover steps. The SyncIQ reports are available separately to review cluster logs for each step of the failover.
Note: An Access Zone Failover with Result of SUCCESS may have had SPN errors. Please refer to the Access Zone Failover Guide for details on checking for SPN errors and resolution.
From the Failover History window, click on the row corresponding to the Failover that you would like to review. The Job Details tree will appear below and the Failover Log can be retrieved for viewing or download by selecting the Open link.
