Eyeglass Probe Technical Support Playbook
Eyeglass Probe Capabilities and Components Monitored
Eyeglass Probe for CA UIM leverages PowerScale REST API and SSH to monitor PowerScale clusters and provide DR status for SyncIQ replication:
Eyeglass Probe: This probe provides inventory, state and alarm collection from individual clusters and replicating pairs of clusters with SyncIQ replication.
This subject of this document is the Eyeglass Probe.
The primary capabilities of the Eyeglass Probe are to:
Collect cluster Events and convert to UIM alarms
Tag clusters with name and node for each alarm
Provide SyncIQ monitoring and DR status from Eyeglass DR dashboard and raise alarms on DR readiness changes
The Eyeglass Probe monitors the following components:
Component | Version |
PowerScale clusters | 7.2.0.x, 7.2.1.x, 8.0.0.x |
SyncIQ replication | 7.2.0.x, 7.2.1.x, 8.0.0.x |
Overview of Architecture
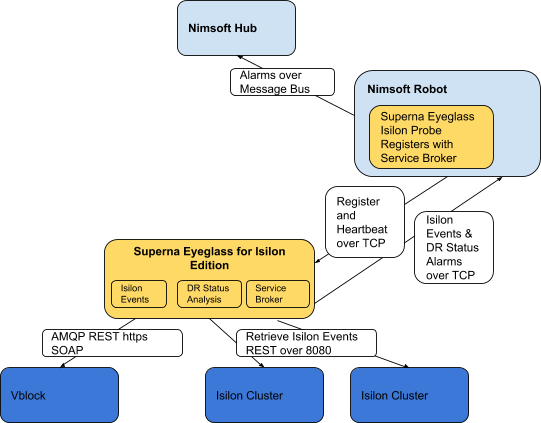
Eyeglass Probe is solution that monitors PowerScale clusters and Vblocks . It collects the inventory and state information from these clusters and passes it to the Eyeglass PowerScale Dashboard. It also collects alarm information from these devices and passes it to Nimsoft UIM bus.
The data flow between Eyeglass Probe.
Description of Main Probe Tasks:
Task | Description |
Inventory and Calculated (Calc) Status |
|
Events |
|
DR Status | Eyeglass REST API |
Events Vblock | AMQP |
Vblock Inventory | REST and SOAP |
Configuration and Log Files
Eyeglass Probe
Configuration Items
Configuration files are located in the C:\Program Files (x86)\Nimsoft\probes\marketplace\superna_eyeglass directory. Following files have primary function in configuration of running probe:
File | Description |
Superna_eyeglass.cfg .jar and .cfx | File containing parameters used by probe on initial startup. |
superna_eyeglass.txt | Log file with errors on startup or exit |
Log Files
Log files are located in the C:\Program Files (x86)\Nimsoft\probes\marketplace\superna_eyeglassdirectory. Following log files contain the operational logging information for the probe:
File | Description |
superna_eyeglass.txt | File containing logs related to:
Example log entry for Starting probe: May 27 13:26:40:976 [main, superna_eyeglass] =========== START: Calling startupAndRestartInitialization(0) ======== May 27 13:26:40:976 [main, superna_eyeglass] =========== START: Reading configuration files and setting up monitors ======== May 27 13:26:40:976 [main, superna_eyeglass] START: GenResourceFactory.readAllQosDefs May 27 13:26:40:976 [main, superna_eyeglass] DONE: GenResourceFactory.readAllQosDefs entries: 0 May 27 13:26:40:976 [main, superna_eyeglass] =========== START: Scheduling DataCollectors for Resources ======== May 27 13:26:40:992 [main, superna_eyeglass] SCHEDULER: using scheduler_thread_pool_size = 3 May 27 13:26:40:992 [main, superna_eyeglass] =========== DONE: Scheduling DataCollectors for Resources ======== May 27 13:26:40:992 [main, superna_eyeglass] =========== DONE: Reading configuration files and setting monitors ======== May 27 13:26:40:992 [main, superna_eyeglass] =========== DONE: Finished startupAndRestartInitialization ======== May 27 13:26:44:918 [pool-1-thread-1, superna_eyeglass] Starting the eyeglass probe in 5 seconds... May 27 13:26:44:918 [pool-1-thread-1, superna_eyeglass] -------- Right before the registration call ----------- May 27 13:26:44:965 [pool-1-thread-1, superna_eyeglass] Created service to listen on port 23457 May 27 13:26:44:965 [pool-1-thread-1, superna_eyeglass] Service listening |
Debugging Facilities
None available.
Troubleshooting
Inventory Not Collected
Setup:
Eyeglass Probe deployed and configured to Eyeglass appliance
Eyeglass PowerScale licenses installed
Eyeglass PowerScale connection to PowerScale Clusters
Problem:
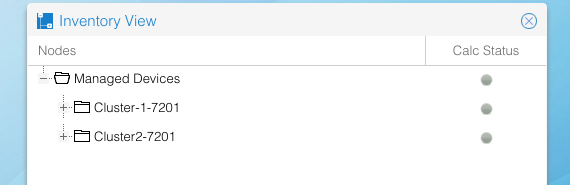
In the Eyeglass PowerScale inventory tree the cluster shows Adding…..
Troubleshooting:
1. Refresh the Eyeglass PowerScale Inventory tree.
2. Determine elapsed time since was added. inventory may take 5 - 10 minutes depending on the state of the system when the was added:
Was inventory collection task in progress when was added? The in-progress inventory task has to complete before inventory for a new is added.
How many inventories are being completed simultaneously.
3. Look in main.log and determine whether there was an inventory failure. You will see this almost immediately after NDEUpdate task starts with an entry in main.log that looks something like this:
2013-11-04 15:39:14,898 NDEUpdateTask:collectData [211] Failed to get Inventory Data.
2013-11-04 15:39:14,898 RefreshNEData:doDataRefresh [183] Could not sync inventory for new nodes - Failed to get Shelf Data - Inventory failed
Troubleshooting Steps for connect to Eyeglass appliance:
Connect using https://x.x.x.x
Ensure ports 443, 2011 and 2012 are not blocked between browser and the appliance
Unable to Load Licenses Troubleshooting
Problem:
Try to upload the license zip file to the Eyeglass license manager .
Troubleshooting:
1. Browser
License upload only works with Chrome browser.
Alarms not appearing in UIM
Setup:
Eyeglass Probe deployed and configured to Eyeglass appliance
Eyeglass PowerScale licenses installed
Eyeglass PowerScale connection to PowerScale Clusters
Problem:
Alarms do not appear to be processed in UIM from PowerScale clusters.
Troubleshooting
Login to eyeglass appliance and check status of the probe connection to the service broker process in eyeglass
On desktop open the Services
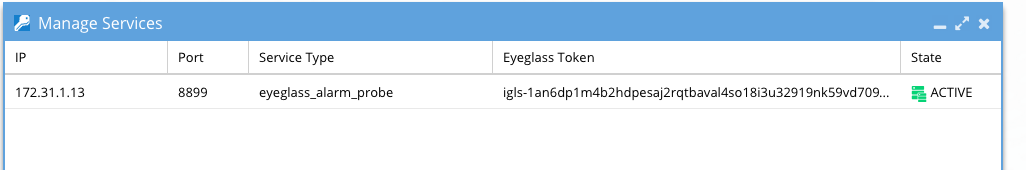
If the State shows inactive it means the IP connection has failed between the probe machine and the eyeglass appliance
Check probe machine and test ping from this machine to the appliance
If this is successful then:
Login to eyeglass appliance via ssh using admin user account
Check tcp connections from the probe host machine using
Netstat -p | grep x.x.x.x (where x.x.x.x is ip address of the machine running the probe)
If no tcp connections are seen from this source ip address it indicates connection issues on this port
Now try this command from the machine running the probe
telnet y.y.y.y 37356 (y.y.y.y is the ip address of the eyeglass appliance and requires telnet on the probe machine)
If connection is successful to the service broker port it indicates the connection is successful and telnet UI will appear to hang.
If this fails this message will be seen
Trying y.y.y.y...
telnet: connect to address y.y.y.y: Connection refused
telnet: Unable to connect to remote host
If the command fails use another PC other than the probe host and try the same command. This will help identify if a firewall is blocking access to this port between the probe host and the eyeglass appliance
Can not Add PowerScale clusters to Eyeglass Appliance
Setup:
Eyeglass Probe deployed and configured to Eyeglass appliance
Eyeglass PowerScale licenses installed
Problem:
Can not add clusters to eyeglass for monitoring
Troubleshooting
Verify that ports https over 8080 and ssh 22 are open between the eyeglass appliance the PowerScale clusters and try again
Eyeglass will return password error if the password is incorrect. Failure to add will not be user or password related
Verify the required service broker ports are open between the Eyeglass appliance the robot running the probe. Verify the firewall on the eyeglass appliance has opened the ports for the Probe default port connect and register.
Verify ip reachability with ping and no firewall blocks ports
Open a case with support if known of the above resolve the adding… cluster.